United Kingdom local elections, 1983
| | |||||||||||||||||||||||||||||||||||||||||||
| |||||||||||||||||||||||||||||||||||||||||||
| |||||||||||||||||||||||||||||||||||||||||||
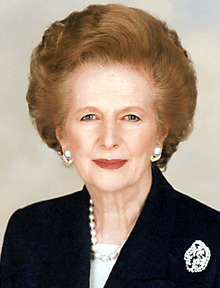
Local elections were held in the United Kingdom in 1983.[1][2] The results were a success for Conservative Prime Minister Margaret Thatcher, who soon afterwards called a general election in which the Conservatives won a landslide victory. The projected share of the vote was Conservative 39%, Labour Party 36%, Liberal-SDP Alliance 20%.
The three major parties all made net gains at the expense of smaller parties and independents, despite a slight reduction in the number of councillors.
The Conservatives gained 110 seats, giving them 10,557 councillors. Labour gained just 8 seats, finishing with 8,782 seats. The Liberal-SDP Alliance gained 321 seats, finishing with 2,171 seats. It was a decent showing for Labour - with a much larger share of the vote than any opinion poll had shown since the party's split in 1981 - but a major disappointment for the Alliance. However, the subsequent general election saw the Conservative government elected by a landslide, while the Alliance came close to Labour in terms of votes, although Labour won almost 10 times as many seats.
England
Metropolitan boroughs
All 36 metropolitan borough councils had one third of their seats up for election.
District councils
Whole council
In 193 districts the whole council was up for election.
In 54 districts there were new ward boundaries, following electoral boundary reviews by the Local Government Boundary Commission for England.
‡ New ward boundaries
Third of council
In 103 districts one third of the council was up for election.
Wales
District councils
References
- ↑ Rallings, Colin; Thrasher, Michael. Local Elections Handbook 1983. The Elections Centre. Retrieved 3 May 2016.
- ↑ "Council compositions". The Elections Centre. Retrieved 3 May 2016.
- Local elections 2006. House of Commons Library Research Paper 06/26.
- Vote 1999 BBC News
- Vote 2000 BBC News

.jpg)

