Ynys Môn (UK Parliament constituency)
Coordinates: 53°15′54″N 4°21′47″W / 53.265°N 4.363°W
| Ynys Môn | |
|---|---|
|
County constituency for the House of Commons | |
|
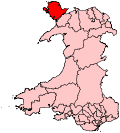
Boundary of Ynys Môn in Wales. | |
| Preserved county | Gwynedd |
| Electorate | 49,721 (December 2010)[1] |
| Major settlements | Holyhead, Llangefni, Beaumaris |
| Current constituency | |
| Created | 1536 |
| Member of parliament | Albert Owen (Labour) |
| Number of members | One |
| Overlaps | |
| Welsh Assembly | Ynys Môn, North Wales |
| European Parliament constituency | Wales |
Ynys Môn (Welsh pronunciation: [ˌənɨs ˈmoːn]; officially called Anglesey until 1983) is a constituency of the House of Commons of the Parliament of the United Kingdom. It elects one Member of Parliament (MP) by the first past the post system of election.
The Ynys Môn Welsh Assembly constituency was created with the same boundaries in 1999.
History
The Laws in Wales Act 1535 (26 Hen. VIII, c. 26) provided for a single county seat in the House of Commons for each of twelve historic Welsh counties (including Anglesey) and two for Monmouthshire. Using the modern year, starting on 1 January, these parliamentary constituencies were authorised in 1536.
The Act contains the following provision, which had the effect of enfranchising the shire of Anglesey.
And that for this present Parliament, and all other Parliaments to be holden and kept for this Realm, one Knight shall be chosen and elected to the same Parliaments for every of the Shires of Brecknock, Radnor, Mountgomery and Denbigh, and for every other Shire within the said Country of Dominion of Wales;
The earliest known results are a fragment of the 1541 returns, where the name of the Knight of the Shire for Anglesey (as Members of Parliament from county constituencies were known before the nineteenth century) has been lost. It is not known if Anglesey was represented in the parliaments of 1536 and 1539.[2]
The borough constituency of Newborough, soon renamed Beaumaris, returned a member of parliament for the boroughs of Anglesey. It was abolished in 1885, leaving only the county constituency of Anglesey. The official name of the constituency in English was Anglesey, until it was replaced by the Welsh name Ynys Môn. Parliament approved the change, to take effect from the 1983 general election. This was purely an alteration of the official name, as no boundary changes were involved.
Boundaries
Geographically, the constituency of Ynys Môn comprises the whole of the main island of Anglesey and the smaller Holy Island.
Members of Parliament
MPs 1545– 1640
| Parliament | Member |
|---|---|
| 1545 | William Bulkeley |
| 1547 | William Bulkeley |
| 1549 | Sir Richard Bulkeley (I) |
| 1553 (Mar) | Lewis Ab Owen ap Meurig |
| 1553 (Oct) | William Lewis |
| 1554 (Apr) | Sir Richard Bulkeley (I) |
| 1554 (Nov) | Sir Richard Bulkeley (I) |
| 1555 | William Lewis |
| 1558 | Rowland Ap Meredydd |
| 1562/3 | Richard Bulkeley (II) |
| 1571 | Sir Richard Bulkeley (I) |
| 1572 | Lewis Ab Owen ap Meurig |
| 1584 | Owen Holland |
| 1586 | Sir Henry Bagenal |
| 1588 | Richard Bulkeley (III) |
| 1593 | William Glynne |
| 1597 | Hugh Hughes |
| 1601 | Thomas Holland |
| 1604 | Sir Richard Bulkeley (II) |
| 1614 | Sir Richard Bulkeley (II) |
| 1621 | Richard Williams |
| 1624 | John Mostyn |
| 1625 | Sir Sackville Trevor |
| 1626 | Richard Bulkeley (IV) |
| 1628 | Richard Bulkeley (IV) |
| 1639–1640 | No Parliaments summoned |
MPs after 1640
- April 1640: John Bodvel
- 1640–1644: John Bodvel (Royalist) – disabled to sit, 5 February 1644
- 1646–1648: Richard Wood – excluded in Pride's Purge, December 1648
Anglesey was unrepresented in Barebone's Parliament
- 1654–1655: Col. George Twisleton
- 1654–1655: William Foxwist
Second Protectorate Parliament
- 1656–1658: Col. George Twisleton
- 1656–1658: Griffith Bodwrda
- 1659: Col. George Twisleton
Elections
Elections in the 2010s
| Party | Candidate | Votes | % | ± | |
|---|---|---|---|---|---|
| Labour | Albert Owen | 10,871 | 31.1 | −2.2 | |
| Plaid Cymru | John Rowlands | 10,642 | 30.5 | +4.3 | |
| Conservative | Michelle Willis | 7,393 | 21.2 | −1.3 | |
| UKIP | Nathan Gill | 5,121 | 14.7 | +11.2 | |
| Liberal Democrat | Mark Geoffrey Thomas Rosenthal[7] | 751 | 2.2 | −5.4 | |
| Socialist Labour | Liz Screen | 148 | 0.4 | N/A | |
| Majority | 229 | 0.7 | −6.4 | ||
| Turnout | 34,926 | 69.9 | +1.1 | ||
| Labour hold | Swing | −3.2 | |||
| Party | Candidate | Votes | % | ± | |
|---|---|---|---|---|---|
| Labour | Albert Owen | 11,490 | 33.4 | −1.3 | |
| Plaid Cymru | Dylan Rees | 9,029 | 26.2 | −4.9 | |
| Conservative | Anthony Ridge-Newman | 7,744 | 22.5 | +11.5 | |
| Liberal Democrat | Matt Wood | 2,592 | 7.5 | +0.7 | |
| Independent | Peter Rogers | 2,225 | 6.5 | −8.2 | |
| UKIP | Elaine Gill | 1,201 | 3.5 | +2.5 | |
| Christian | David Owen | 163 | 0.5 | +0.5 | |
| Majority | 2,461 | 7.1 | |||
| Turnout | 34,444 | 68.8 | +1.3 | ||
| Labour hold | Swing | +1.8 | |||
Elections in the 2000s
| Party | Candidate | Votes | % | ± | |
|---|---|---|---|---|---|
| Labour | Albert Owen | 12,278 | 34.6 | −0.4 | |
| Plaid Cymru | Eurig Wyn | 11,036 | 31.1 | −1.5 | |
| Independent | Peter Rogers | 5,216 | 14.7 | N/A | |
| Conservative | James Roach | 3,915 | 11.0 | −11.5 | |
| Liberal Democrat | Sarah Green | 2,418 | 6.8 | −1.3 | |
| UKIP | Elaine Gill | 367 | 1.0 | −0.1 | |
| Legalise Cannabis | Tim Evans | 232 | 0.7 | N/A | |
| Majority | 1,242 | 3.5 | +1.1 | ||
| Turnout | 35,462 | 67.5 | +3.8 | ||
| Labour hold | Swing | +0.6 | |||
| Party | Candidate | Votes | % | ± | |
|---|---|---|---|---|---|
| Labour | Albert Owen | 11,906 | 35.0 | +1.8 | |
| Plaid Cymru | Eilian Williams | 11,106 | 32.6 | −6.8 | |
| Conservative | Albie Fox | 7,653 | 22.5 | +1.0 | |
| Liberal Democrat | Nicholas Bennett | 2,772 | 8.1 | +4.3 | |
| UKIP | Francis Wykes | 359 | 1.1 | N/A | |
| Independent | Nona Donald | 222 | 0.7 | N/A | |
| Majority | 800 | 2.4 | N/A | ||
| Turnout | 34,018 | 63.7 | −11.2 | ||
| Labour gain from Plaid Cymru | Swing | +4.3 | |||
Elections in the 1990s
| Party | Candidate | Votes | % | ± | |
|---|---|---|---|---|---|
| Plaid Cymru | Ieuan Wyn Jones | 15,756 | 39.5 | +2.4 | |
| Labour | Owen Edwards | 13,275 | 33.2 | +9.7 | |
| Conservative | Gwilym Owen | 8,569 | 21.5 | −13.1 | |
| Liberal Democrat | Deric Burnham | 1,537 | 3.8 | −0.6 | |
| Referendum | Hugh Gray-Morris | 793 | 2.0 | N/A | |
| Majority | 2,481 | ||||
| Turnout | 39,930 | 75.4 | |||
| Plaid Cymru hold | Swing | ||||
| Party | Candidate | Votes | % | ± | |
|---|---|---|---|---|---|
| Plaid Cymru | Ieuan Wyn Jones | 15,984 | 37.1 | -6.1 | |
| Conservative | Gwynn Price Rowlands | 14,878 | 34.6 | +1.3 | |
| Labour | Dr Robin Owen Jones | 10,126 | 23.5 | +6.6 | |
| Liberal Democrat | Mrs Pauline Edna Badger | 1,891 | 4.4 | −2.3 | |
| Natural Law | Mrs Susan Marilyn Parry | 182 | 0.4 | N/A | |
| Majority | 1,106 | 2.6 | −7.4 | ||
| Turnout | 43,061 | 80.6 | −1.0 | ||
| Plaid Cymru hold | Swing | −3.7 | |||
Elections in the 1980s
| Party | Candidate | Votes | % | ± | |
|---|---|---|---|---|---|
| Plaid Cymru | Ieuan Wyn Jones | 18,580 | 43.2 | +9.9 | |
| Conservative | Roger Kenneth Evans | 14,282 | 33.2 | −4.3 | |
| Labour | Colin Parry | 7,252 | 16.9 | +0.0 | |
| Social Democratic | Ieuan Wilson Evans | 2,863 | 6.7 | −5.6 | |
| Majority | 4,298 | 10.0 | |||
| Turnout | 42,977 | 81.7 | +2.1 | ||
| Plaid Cymru gain from Conservative | Swing | +7.2 | |||
| Party | Candidate | Votes | % | ± | |
|---|---|---|---|---|---|
| Conservative | Keith Best | 15,017 | 37.5 | −1.5 | |
| Plaid Cymru | Ieuan Wyn Jones | 13,333 | 33.3 | +13.0 | |
| Labour | Tudor Williams | 6,791 | 16.9 | −14.8 | |
| Social Democratic | David Eryl Thomas | 4,947 | 12.3 | +3.3 | |
| Majority | 1,684 | 4.2 | −3.1 | ||
| Turnout | 79.6 | −1.6 | |||
| Conservative hold | Swing | ||||
Elections in the 1970s
| Party | Candidate | Votes | % | ± | |
|---|---|---|---|---|---|
| Conservative | Keith Best | 15,100 | 39.0 | +15.2 | |
| Labour | Elystan Morgan | 12,283 | 31.7 | −9.9 | |
| Plaid Cymru | John Lasarus Williams | 7,863 | 20.3 | +1.2 | |
| Liberal | John Gwynedd Jones | 3,500 | 9.0 | −6.5 | |
| Majority | 2,817 | 7.3 | −10.5 | ||
| Turnout | 38,746 | 81.2 | +5.1 | ||
| Conservative gain from Labour | Swing | +12.5 | |||
| Party | Candidate | Votes | % | ± | |
|---|---|---|---|---|---|
| Labour | Rt. Hon. Cledwyn Hughes | 13,947 | 41.6 | −0.2 | |
| Conservative | Vivan Lewis | 7,975 | 23.8 | −1.6 | |
| Plaid Cymru | Dafydd Iwan | 6,410 | 19.1 | −2.6 | |
| Liberal | Mervyn Ankers | 5,182 | 15.5 | +4.4 | |
| Majority | 5,972 | 17.8 | +1.4 | ||
| Turnout | 33,514 | 76.1 | −4.1 | ||
| Labour hold | Swing | +0.7 | |||
| Party | Candidate | Votes | % | ± | |
|---|---|---|---|---|---|
| Labour | Rt. Hon. Cledwyn Hughes | 14,652 | 41.8 | +0.7 | |
| Conservative | Thomas Vivan Lewis | 8,898 | 25.4 | −3.1 | |
| Plaid Cymru | Dafydd Iwan | 7,610 | 21.7 | −0.4 | |
| Liberal | Edwin Jones | 3,882 | 11.1 | +4.9 | |
| Majority | 5,754 | 16.4 | +1.7 | ||
| Turnout | 35,042 | 80.2 | +2 | ||
| Labour hold | Swing | +0.8 | |||
| Party | Candidate | Votes | % | ± | |
|---|---|---|---|---|---|
| Labour | Rt. Hon. Cledwyn Hughes | 13,966 | 43.2 | −11.8 | |
| Conservative | John Eilian Jones | 9,220 | 28.5 | −6.9 | |
| Plaid Cymru | John Lasarus Williams | 7,140 | 22.1 | +12.5 | |
| Liberal | George Winston Roddick | 2,013 | 6.2 | N/A | |
| Majority | 4,746 | 14.7 | −4.9 | ||
| Turnout | 78.2 | +5 | |||
| Labour hold | Swing | −2.4 | |||
Elections in the 1960s
| Party | Candidate | Votes | % | ± | |
|---|---|---|---|---|---|
| Labour | Cledwyn Hughes | 14,874 | 55 | ||
| Conservative | John Eilian Jones | 9,576 | 35.4 | ||
| Plaid Cymru | John Wynn Meredith | 2,596 | 9.6 | ||
| Majority | 5,298 | 19.6 | |||
| Turnout | 73.2 | ||||
| Labour hold | Swing | ||||
| Party | Candidate | Votes | % | ± | |
|---|---|---|---|---|---|
| Labour | Cledwyn Hughes | 13,553 | 48.1 | ||
| Conservative | John Eilian Jones | 7,016 | 25 | ||
| Liberal | E Gwyn Jones | 5,730 | 20.4 | ||
| Plaid Cymru | Robert Tudur Jones | 1,817 | 6.5 | ||
| Majority | 6,537 | 23.1 | |||
| Turnout | 78.6 | ||||
| Labour hold | Swing | ||||
Elections in the 1950s
| Party | Candidate | Votes | % | ± | |
|---|---|---|---|---|---|
| Labour | Cledwyn Hughes | 13,249 | 47 | ||
| Conservative | O. Meurig Hughes | 7,005 | 24.9 | ||
| Plaid Cymru | Robert Tudur Jones | 4,121 | 14.6 | ||
| Liberal | Rhys Gerran Lloyd | 3,796 | 13.5 | ||
| Majority | 6,244 | 22.1 | |||
| Turnout | 77.6 | ||||
| Labour hold | Swing | ||||
| Party | Candidate | Votes | % | ± | |
|---|---|---|---|---|---|
| Labour | Cledwyn Hughes | 13,986 | 48.4 | ||
| Liberal | John Williams Hughes | 9,413 | 32.6 | ||
| Conservative | Owen H Hughes | 3,333 | 13.3 | ||
| Plaid Cymru | J Rowland Jones | 2,183 | 7.5 | ||
| Majority | 4,573 | 15.8 | |||
| Turnout | 80.4 | ||||
| Labour hold | Swing | ||||
| Party | Candidate | Votes | % | ± | |
|---|---|---|---|---|---|
| Labour | Cledwyn Hughes | 11,814 | 40.1 | ||
| Liberal | Lady Megan Lloyd George | 11,219 | 38.2 | ||
| Conservative | O Meurig Roberts | 6,366 | 21.7 | ||
| Majority | 595 | 1.9 | |||
| Turnout | 81.4 | ||||
| Labour gain from Liberal | Swing | ||||
| Party | Candidate | Votes | % | ± | |
|---|---|---|---|---|---|
| Liberal | Lady Megan Lloyd George | 13,688 | 46.7 | ||
| Labour | Cledwyn Hughes | 11,759 | 40.0 | ||
| Conservative | J O Jones | 3,919 | 13.3 | ||
| Majority | 1,929 | 6.7 | |||
| Turnout | 82.7 | ||||
| Liberal hold | Swing | ||||
Elections in the 1940s
| Party | Candidate | Votes | % | ± | |
|---|---|---|---|---|---|
| Liberal | Lady Megan Lloyd George | 12,610 | 52.2 | ||
| Labour | Cledwyn Hughes | 11,529 | 47.8 | ||
| Majority | 1,081 | 4.4 | |||
| Turnout | 70.6 | ||||
| Liberal hold | Swing | ||||
Elections in the 1930s
| Party | Candidate | Votes | % | ± | |
|---|---|---|---|---|---|
| Liberal | Megan Lloyd George | 11,227 | 44.5 | ||
| Conservative | Francis John Watkin Williams | 7,045 | 27.9 | ||
| Labour | Henry Jones | 6,959 | 27.6 | ||
| Majority | 4,182 | 16.6 | |||
| Turnout | 74.4 | ||||
| Liberal hold | Swing | ||||
| Party | Candidate | Votes | % | ± | |
|---|---|---|---|---|---|
| Liberal | Megan Lloyd George | 14,839 | 58.3 | ||
| Conservative | Albert Hughes | 10,612 | 41.7 | ||
| Majority | 4,227 | 16.6 | |||
| Turnout | 75.5 | ||||
| Liberal hold | Swing | ||||
Elections in the 1920s
| Party | Candidate | Votes | % | ± | |
|---|---|---|---|---|---|
| Liberal | Megan Lloyd George | 13,181 | 49.4 | -14.5 | |
| Labour | William Edwards | 7,563 | 28.4 | -7.7 | |
| Unionist | Albert Hughes | 5,917 | 22.2 | n/a | |
| Majority | 5,618 | 21.0 | -6.8 | ||
| Turnout | 79.8 | +5.8 | |||
| Liberal hold | Swing | -3.4 | |||
| Party | Candidate | Votes | % | ± | |
|---|---|---|---|---|---|
| Liberal | Sir Robert John Thomas | 13,407 | 63.9 | n/a | |
| Labour | Cyril O Jones | 7,580 | 36.1 | n/a | |
| Majority | 5,827 | 27.8 | n/a | ||
| Turnout | 74.0 | n/a | |||
| Liberal hold | Swing | n/a | |||
| Party | Candidate | Votes | % | ± | |
|---|---|---|---|---|---|
| Liberal | Sir Robert John Thomas | unopposed | n/a | n/a | |
| Liberal hold | Swing | n/a | |||
| Party | Candidate | Votes | % | ± | |
|---|---|---|---|---|---|
| Liberal | Sir Robert John Thomas | 11,116 | 53.3 | +7.5 | |
| Labour | Edward Thomas John | 6,368 | 30.5 | -23.7 | |
| Unionist | Richard Owen Roberts | 3,385 | 16.2 | n/a | |
| Majority | 4,748 | 22.8 | 31.2 | ||
| Turnout | 76.4 | -4.1 | |||
| Liberal gain from Labour | Swing | +15.6 | |||
| Party | Candidate | Votes | % | ± | |
|---|---|---|---|---|---|
| Independent Labour | Sir Owen Thomas | 11,929 | 54.2 | +3.8 | |
| National Liberal | Sir Robert John Thomas | 10,067 | 45.8 | -3.8 | |
| Majority | 1,862 | 8.4 | |||
| Turnout | 80.5 | +11.1 | |||
| Independent Labour hold | Swing | +3.8 | |||
Elections in the 1910s
| Party | Candidate | Votes | % | ± | |
|---|---|---|---|---|---|
| Independent Labour | Sir Owen Thomas | 9,038 | 50.4 | n/a | |
| Liberal | 8.898 | 49.6 | n/a | ||
| Majority | 140 | 0.8 | n/a | ||
| Turnout | 69.4 | n/a | |||
| Independent Labour gain from Liberal | Swing | n/a | |||
- endorsed by Coalition Government
| Party | Candidate | Votes | % | ± | |
|---|---|---|---|---|---|
| Liberal | Ellis Jones Griffith | unopposed | n/a | n/a | |
| Liberal hold | Swing | n/a | |||
| Party | Candidate | Votes | % | ± | |
|---|---|---|---|---|---|
| Liberal | Ellis Jones Griffith | 5,888 | 70.7 | ||
| Conservative | Richard Owen Roberts | 2,436 | 29.3 | ||
| Majority | 3,452 | 41.4 | |||
| Turnout | 80.5 | ||||
| Liberal hold | Swing | ||||
Elections in the 1900s
At a by-election in 1907, Ellis Jones Griffith was re-elected unopposed.
| Party | Candidate | Votes | % | ± | |
|---|---|---|---|---|---|
| Liberal | Ellis Jones Griffith | 5,356 | 67.0 | n/a | |
| Conservative | C F Priestley | 2,638 | 33.0 | n/a | |
| Majority | 2,718 | 34.0 | n/a | ||
| Turnout | 79.9 | n/a | |||
| Liberal hold | Swing | n/a | |||
| Party | Candidate | Votes | % | ± | |
|---|---|---|---|---|---|
| Liberal | Ellis Jones Griffith | unopposed | n/a | n/a | |
| Liberal hold | Swing | n/a | |||
Elections in the 1890s
| Party | Candidate | Votes | % | ± | |
|---|---|---|---|---|---|
| Liberal | Ellis Jones Griffith | 4,224 | 56.9 | ||
| Conservative | J R Roberts | 3,197 | 43.1 | ||
| Majority | 1,027 | 13.8 | |||
| Turnout | 74.3 | ||||
| Liberal hold | Swing | ||||
| Party | Candidate | Votes | % | ± | |
|---|---|---|---|---|---|
| Liberal | Thomas Lewis | 4,420 | 62.1 | ||
| Conservative | Morgan Lloyd | 2,702 | 37.9 | ||
| Majority | 1,718 | 24.2 | |||
| Turnout | 70.6 | ||||
| Liberal hold | Swing | ||||
Elections in the 1880s
| Party | Candidate | Votes | % | ± | |
|---|---|---|---|---|---|
| Liberal | Thomas Lewis | 3,727 | 52.1 | ||
| Conservative | George Pritchard Rayner | 3,420 | 47.9 | ||
| Majority | 307 | 4.2 | |||
| Turnout | 70.6 | ||||
| Liberal hold | Swing | ||||
| Party | Candidate | Votes | % | ± | |
|---|---|---|---|---|---|
| Liberal | Richard Davies | 4,412 | 56 | ||
| Conservative | George Pritchard Rayner | 3,462 | 44 | ||
| Majority | 950 | 12 | |||
| Turnout | 80.5 | ||||
| Liberal hold | Swing | ||||
| Party | Candidate | Votes | % | ± | |
|---|---|---|---|---|---|
| Liberal | Richard Davies | 1,394 | |||
| Conservative | George Pritchard Rayner | 1,085 | |||
| Majority | 309 | ||||
| Turnout | |||||
| Liberal hold | Swing | ||||
Elections in the 1870s
| Party | Candidate | Votes | % | ± | |
|---|---|---|---|---|---|
| Liberal | Richard Davies | 1,636 | |||
| Conservative | R L M W Bulkeley | 793 | |||
| Majority | 843 | ||||
| Turnout | |||||
| Liberal hold | Swing | ||||
See also
Notes and references
- ↑ "Beyond 20/20 WDS – Table view". 2011 Electorate Figures. StatsWales. 1 December 2010. Retrieved 13 March 2011.
- ↑ Williams, William Retlaw (1895). The Parliamentary History of the Principality of Wales. Brecknock: E. Davies and Bell. pp. 1–8. Retrieved 2008-08-28.
- ↑ Leigh Rayment's Historical List of MPs – Constituencies beginning with "A" (part 2)
- ↑ Leigh Rayment's Historical List of MPs – Constituencies beginning with "Y"
- ↑ "Election results for Ynys Môn with full statistics". Election results for Ynys Môn. Isle of Anglesey Count Council. Retrieved 16 September 2015.
- ↑ "Formal Result for Ynys Môn" (PDF). Declaration of Result of Poll. Isle of Anglesey County Council. Retrieved 16 September 2015.
- ↑ "List of selected candidates". Liberal Democrats. 4 March 2015. Retrieved 15 March 2015.
- ↑ Ynys Môn, Anglesey Council – candidates
- ↑ "Election 2010 | Constituency | Ynys Mon". BBC News. Retrieved 2010-09-05.
- 1 2 Ynys Mon, guardian.co.uk
- ↑ "Politics Resources". Election 1992. Politics Resources. 9 April 1992. Retrieved 2010-12-06.
- ↑ UK General Election Results: June 1987
- ↑ UK General Election Results: June 1983
- ↑ F W S Craig, British Parliamentary Election Results 1918-1949; Political Reference Publications, Glasgow 1949
Further reading
- The House of Commons 1509–1558, by S.T. Bindoff (Secker & Warburg 1982)
- Williams, William Retlaw (1895). The Parliamentary History of the Principality of Wales. Brecknock: E. Davies and Bell. pp. 1–8. Retrieved 2008-08-28.
- F W S Craig, British Parliamentary Election Results, 1918–1949; Political Reference Publications, Glasgow, 1949
- Keele University, UK General Election Results, 1950