1944 Cuba–Florida hurricane
| Category 4 major hurricane (SSHWS/NWS) | |
| Formed | October 12, 1944 |
|---|---|
| Dissipated | October 20, 1944 |
| Highest winds |
1-minute sustained: 145 mph (230 km/h) |
| Lowest pressure | 937 mbar (hPa); 27.67 inHg |
| Fatalities | 318 direct |
| Damage | $10 million (1944 USD) |
| Areas affected | Swan Islands, Cayman Islands, Cuba, Florida, Carolinas, Virginia |
| Part of the 1944 Atlantic hurricane season | |
The 1944 Cuba–Florida hurricane (also known as the Pinar del Río Hurricane of 1944 and 1944 Havana Hurricane) was a large, intense Category 4 hurricane that affected western Cuba and Florida. The eleventh tropical cyclone, seventh hurricane, and third major hurricane of the season developed over the southern Caribbean Sea on October 12. It intensified to a hurricane on October 13, attained its peak on October 17, and struck Pinar del Río with gusts in excess of 160 mph (260 km/h). The hurricane accelerated, and it struck southwest Florida near Sarasota on October 19. It diminished to a tropical storm, briefly exited over water off southeast Georgia, and moved inland near Savannah on October 20. It became extratropical over southeastern Virginia on October 21. The late-season October storm was eventually responsible for very heavy rains, a wide swath of destruction, and over 300 deaths, especially in rural areas of Cuba.
Meteorological history
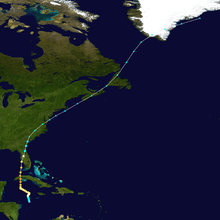
On the late afternoon of October 12, an area of disturbed weather organized to a tropical storm 190 miles (310 km) east of Cape Gracias a Dios, Nicaragua.[1] It was originally detected by the motorship Silver Arrow, while rough seas were reported near the Swan Islands.[2] The tropical storm moved slowly northward, and it quickly attained hurricane intensity. On October 13, heavy rainfall was reported through the afternoon at Grand Cayman, with sustained winds near 25 mph (40 km/h). The hurricane gradually intensified, and its forward motion slowed to a near stall 60 miles (100 km) southeast of George Town, Grand Cayman on October 14.[1] As the hurricane began to drift westward, conditions grew more severe on the Swan Islands, although maximum gusts remained below 60 mph (95 km/h).[2] On October 16, the hurricane strengthened to the equivalent of a Category 2 hurricane with maximum sustained winds near 100 mph (160 km/h). Grand Cayman remained north of the center, though the island recorded gusts near 118 mph (190 km/h) on October 15.[2]
The hurricane slowly turned to the north along 83°W Longitude, and it steadily intensified on October 17. The hurricane strengthened to the equivalent of a major hurricane shortly prior to its landfall on the Isles of Pines with winds near 130 mph (215 km/h).[2][1] Later, the hurricane reached its peak of 145 mph (230 km/h) as it made landfall on Pinar del Río Province. The hurricane passed 15 miles (25 km) west of La Habana Province, and its forward motion gradually increased when it entered the southern Gulf of Mexico on October 18. The cyclone maintained its intensity when it passed to the west of the Dry Tortugas, though its large size spread hurricane-force winds over the islands for several hours.[2] Early on October 19, the hurricane weakened significantly, and it struck the mainland of southwest Florida near Sarasota as a minimal hurricane with winds of 75 mph (120 km/h). The minimum pressure, 962 mbar (28.42 inHg),[3] was measured in Sarasota.[2]

The hurricane weakened as it moved inland, passing 20 miles (30 km) east of Tampa.[1] Its forward motion increased to 20 mph (30 km/h), and it passed over the central Florida communities of Dade City and Ocala.[2] The cyclone diminished to a tropical storm, and it moved into the western Atlantic waters 10 miles (15 km) east of Jacksonville. On October 20, the diminishing tropical storm moved ashore north of Savannah[2] with winds near 50 mph (80 km/h).[1] It moved inland over eastern South Carolina and North Carolina. On October 21, it became extratropical, and it passed into the Atlantic Ocean near Norfolk.[1] Its forward motion increased off the eastern shore of Maryland, and the extratropical remnants moved inland over Nova Scotia.[2] It produced gale force winds of Force 8 over Newfoundland, and it merged with a low pressure area off southern Greenland.[2][1]
Preparations
58 warnings and advisories were issued by the U.S. Weather Bureau during the nine-day period when the storm impacted the western Caribbean islands and United States.[2] In Miami, watches and warnings were broadcast via microphones at two to three-hour intervals when the hurricane threatened the state. The Red Cross reported 35,000 people were sheltered during the storm, which accounted for a small portion of those whom evacuated.[2] 150 small vessels were secured in Key West, while operational Army and Navy planes were transferred from Florida to safer airfields. In Cuba, communications were severed on the Isles of Pines, though Havana received ample warnings and was well prepared for the storm.[4]
Impact
| Rank | Hurricane | Season | Cost (2015 USD)[7] |
|---|---|---|---|
| 1 | "Miami" | 1926 | $190.3 billion |
| 2 | Katrina | 2005 | $130.9 billion |
| 3 | "Galveston" | 1900 | $120.4 billion |
| 4 | "Galveston" | 1915 | $82.3 billion |
| 5 | Andrew | 1992 | $67.5 billion |
| 6 | "New England" | 1938 | $47.5 billion |
| 7 | "Cuba–Florida" | 1944 | $46.9 billion |
| 8 | "Okeechobee" | 1928 | $40.6 billion |
| 9 | Ike | 2008 | $34.1 billion |
| 10 | Donna | 1960 | $32.4 billion |
| Main article: List of costliest Atlantic hurricanes | |||
The storm killed 300 people and left $10 million (1944 USD, $107 million 2005 USD) in damage. It is estimated that, if a similar hurricane struck here in the year 2010, it would cause $40.6 billion (2010 USD) in damage, making this one of the worst-case storms for western Florida.
Cayman Islands
Damage was minor and limited to docks and warehouses; however, severe flooding resulted from over 30 inches of rainfall on Grand Cayman Island. A 24-hour rainfall record of 16 inches was reportedly set.
Cuba
There was severe damage, mostly in the eastern and northern regions of Pinar del Río Province. Much of Havana harbor was strewn with wrecked and sunken ships. About 300 people were killed in Cuba.
Florida
There was serious tide damage along the southwest Florida coast, and much of the citrus harvest was ruined by the storm. Nine people died when their boat capsized during the storm.
See also
References
- 1 2 3 4 5 6 7 National Hurricane Center; Hurricane Research Division (July 6, 2016). "Atlantic hurricane best track (HURDAT version 2)". United States National Oceanic and Atmospheric Administration. Retrieved December 5, 2016.
- 1 2 3 4 5 6 7 8 9 10 11 12 H. C. Sumner. "The North Atlantic Hurricane of October 13–21, 1944" (PDF). U.S. Weather Bureau. Retrieved 2007-10-11.
- ↑ Blake; Rappaport & Landsea (2006). "The Deadliest, Costliest, and Most Intense United States Tropical Cyclones (1851 to 2006)" (PDF). NOAA. Archived (PDF) from the original on 25 October 2007. Retrieved 2007-10-11.
- ↑ Associated Press. "Hurricane Hits Cuba; Florida Set for Blow". The Salisbury Times. Retrieved 2007-10-13.
- ↑ Pielke, Roger A., Jr.; Gratz, Joel; Landsea, Christopher W.; Collins, Douglas; Saunders, Mark A.; Musulin, Rade (2008). "Normalized Hurricane Damage in the United States: 1900–2005" (PDF). Natural Hazards Review. 9 (1): 29–42. doi:10.1061/(ASCE)1527-6988(2008)9:1(29). Archived from the original (PDF) on June 17, 2013. Retrieved May 7, 2009.
- ↑ Blake, Eric S.; Landsea, Christopher W.; Gibney, Ethan J. (2011). "The Deadliest, Costliest, and the most intense United States Tropical Cyclones from 1851 to 2010 (and other frequently requested hurricane facts)" (PDF). NOAA Technical Memorandum NWS NHC-6.
- ↑ United States nominal Gross Domestic Product per capita figures follow the Measuring Worth series supplied in Johnston, Louis; Williamson, Samuel H. (2016). "What Was the U.S. GDP Then?". MeasuringWorth. Retrieved April 10, 2016. These figures follow the figures as of 2015.
External links
- Monthly Weather Review
- Sanibel Island Hurricane Track (Unisys)
- Florida's Hurricane History by Jay Barnes
Tropical cyclones of the 1944 Atlantic hurricane season | ||
|---|---|---|
 | ||
| ||