Ashfield (UK Parliament constituency)
| Ashfield | |
|---|---|
|
County constituency for the House of Commons | |
|
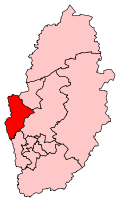
Boundary of Ashfield in Nottinghamshire. | |
|
Location of Nottinghamshire within England. | |
| County | Nottinghamshire |
| Population | 101,914 (2011 census)[1] |
| Electorate | 77,049 (December 2010)[2] |
| Major settlements | Sutton in Ashfield, Kirkby in Ashfield and Eastwood |
| Current constituency | |
| Created | 1955 |
| Member of parliament | Gloria De Piero (Labour) |
| Number of members | One |
| Overlaps | |
| European Parliament constituency | East Midlands |

Ashfield is a Nottinghamshire constituency [n 1] represented in the House of Commons of the UK Parliament since 2010 by Gloria De Piero of the Labour Party.[n 2]
Constituency profile
To date almost always a Labour Party seat which was created in 1955, Ashfield has been served by a former Secretary of State, Geoff Hoon, and since its creation for only two years has been served by one member of another party, Tim Smith of the Conservative Party, from 1977 to 1979. Ashfield's results indicate quite large Labour majorities. In 2010 the seat had a marginal majority of only 192, but this was increased to 8,820 in 2015.
Boundaries
1955-1974: The Urban Districts of Eastwood, Kirkby-in-Ashfield, and Sutton-in-Ashfield, and in the Rural District of Basford the civil parishes of Annesley, Bestwood Park, Brinsley, Felley, Linby, Newstead, Papplewick, and Selston.
1974-1983: The Urban Districts of Hucknall, Kirkby-in-Ashfield, and Sutton-in-Ashfield, and in the Rural District of Basford the civil parishes of Annesley, Felley, and Selston.
1983-2010: The District of Ashfield wards of Jacksdale, Kirkby-in-Ashfield Central, Kirkby-in-Ashfield East, Kirkby-in-Ashfield West, Selston, Sutton-in-Ashfield Central, Sutton-in-Ashfield East, Sutton-in-Ashfield North, Sutton-in-Ashfield West, Underwood, and Woodhouse, and the Borough of Broxtowe wards of Brinsley, Eastwood East, Eastwood North, and Eastwood South.
2010-present: The District of Ashfield wards of Jacksdale, Kirkby-in-Ashfield Central, Kirkby-in-Ashfield East, Kirkby-in-Ashfield West, Selston, Sutton-in-Ashfield Central, Sutton-in-Ashfield East, Sutton-in-Ashfield North, Sutton-in-Ashfield West, Underwood, and Woodhouse, and the Borough of Broxtowe wards of Brinsley, Eastwood North and Greasley Beauvale, and Eastwood South.
Members of Parliament
The former Cabinet minister Geoff Hoon represented the seat for the Labour Party from 1992, when he succeeded the three-term Labour member Frank Haynes, to 2010 when he retired.[3] Ashfield is now represented by Gloria De Piero, who came close to losing the seat after a 17.2% swing to the Liberal Democrats in 2010 but increased her majority again in 2015.
| Election | Member[4] | Party | ||
|---|---|---|---|---|
| 1955 | Will Warbey | Labour | ||
| 1966 | David Marquand | Labour | ||
| 1977 by-election | Tim Smith | Conservative | ||
| 1979 | Frank Haynes | Labour | ||
| 1992 | Geoff Hoon | Labour | 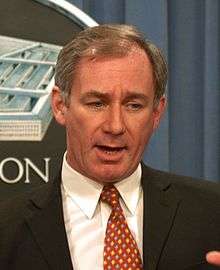 | |
| 2010 | Gloria De Piero | Labour |  | |
Elections
Elections in the 2010s
| Party | Candidate | Votes | % | ± | |
|---|---|---|---|---|---|
| Labour | Gloria De Piero | 19,448 | 41.0 | +7.3 | |
| Conservative | Helen Harrison[6] | 10,628 | 22.4 | +0.2 | |
| UKIP | Simon Ashcroft | 10,150 | 21.4 | +19.5 | |
| Liberal Democrat | Philip Smith[7] | 7,030 | 14.8 | -18.5 | |
| Justice for Men and Boys | Mike Buchanan | 153 | 0.3 | +0.3 | |
| Majority | 8,820 | 18.6 | +18.2 | ||
| Turnout | 47,409 | 61.5 | -0.8 | ||
| Labour hold | Swing | +3.55 | |||
| Party | Candidate | Votes | % | ± | |
|---|---|---|---|---|---|
| Labour | Gloria De Piero | 16,239 | 33.7 | −15.0 | |
| Liberal Democrat | Jason Zadrozny | 16,047 | 33.3 | +19.5 | |
| Conservative | Garry Hickton | 10,698 | 22.2 | −2.2 | |
| BNP | Edward Holmes | 2,781 | 5.8 | N/A | |
| English Democrats | Tony Ellis | 1,102 | 2.3 | N/A | |
| UKIP | Terry Coleman | 933 | 1.9 | N/A | |
| Independent | Eddie Smith | 396 | 0.8 | N/A | |
| Majority | 192 | 0.4 | −23.9 | ||
| Turnout | 48,196 | 62.3 | +5.2 | ||
| Labour hold | Swing | −17.2 | |||
Elections in the 2000s
| Party | Candidate | Votes | % | ± | |
|---|---|---|---|---|---|
| Labour | Geoff Hoon | 20,433 | 48.6 | −9.5 | |
| Conservative | Giles Inglis-Jones | 10,220 | 24.3 | −0.1 | |
| Liberal Democrat | Wendy Johnson | 5,829 | 13.9 | +2.6 | |
| Ashfield Independents | Roy Adkins | 2,292 | 5.5 | N/A | |
| Independent | Kate Allsop | 1,900 | 4.5 | N/A | |
| Veritas | Sarah Hemstock | 1,108 | 2.6 | N/A | |
| Independent | Eddie Grenfell | 269 | 0.6 | N/A | |
| Majority | 10,213 | 24.3 | |||
| Turnout | 42,051 | 57.3 | +3.7 | ||
| Labour hold | Swing | -4.7 | |||
| Party | Candidate | Votes | % | ± | |
|---|---|---|---|---|---|
| Labour | Geoff Hoon | 22,875 | 58.1 | −7.0 | |
| Conservative | Julian C.T. Leigh | 9,607 | 24.4 | +4.2 | |
| Liberal Democrat | William E. Smith | 4,428 | 11.3 | +1.6 | |
| Independent | Charlie Harby | 1,471 | 3.7 | N/A | |
| Socialist Alliance | George Watson | 589 | 1.5 | N/A | |
| Socialist Labour | Miss Katrina R. Howse | 380 | 1.0 | N/A | |
| Majority | 13,268 | 33.7 | |||
| Turnout | 39,350 | 53.6 | −16.4 | ||
| Labour hold | Swing | -5.6 | |||
Elections in the 1990s
| Party | Candidate | Votes | % | ± | |
|---|---|---|---|---|---|
| Labour | Geoff Hoon | 32,979 | 65.1 | +10.2 | |
| Conservative | Mark Jonathon Mortlock Simmonds | 10,251 | 20.3 | −12.3 | |
| Liberal Democrat | William E. Smith | 4,882 | 9.7 | −2.8 | |
| Referendum | Martin I. Betts | 1,896 | 3.8 | N/A | |
| BNP | Steven E. Belshaw | 595 | 1.2 | N/A | |
| Majority | 22,728 | 44.9 | |||
| Turnout | 50,603 | 70.0 | |||
| Labour hold | Swing | +11.3 | |||
| Party | Candidate | Votes | % | ± | |
|---|---|---|---|---|---|
| Labour | Geoff Hoon | 32,018 | 54.9 | +13.2 | |
| Conservative | Laurence Robertson | 19,031 | 32.6 | −1.0 | |
| Liberal Democrat | James S. Turton | 7,291 | 12.5 | −12.2 | |
| Majority | 12,987 | 22.3 | +14.2 | ||
| Turnout | 58,340 | 80.4 | +3.2 | ||
| Labour hold | Swing | +7.1 | |||
Elections in the 1980s
| Party | Candidate | Votes | % | ± | |
|---|---|---|---|---|---|
| Labour | Frank Haynes | 22,812 | 41.7 | 0 | |
| Conservative | Barry George Coleman | 18,412 | 33.6 | +2.9 | |
| Liberal | Frances Barbara Stein | 13,542 | 24.7 | -2.1 | |
| Majority | 4,400 | 8.1 | -3.7 | ||
| Turnout | 70,937 | 77.2 | |||
| Labour hold | Swing | -1.45 | |||
| Party | Candidate | Votes | % | ± | |
|---|---|---|---|---|---|
| Labour | Frank Haynes | 21,859 | 41.7 | ||
| Conservative | R Seligman | 15,772 | 30.7 | ||
| Liberal | F Stein | 13,812 | 26.8 | ||
| Majority | 6,087 | 11.8 | |||
| Turnout | 68,791 | 74.8 | |||
| Labour hold | Swing | ||||
Elections in the 1970s
| Party | Candidate | Votes | % | ± | |
|---|---|---|---|---|---|
| Labour | Frank Haynes | 33,116 | 52.8 | ||
| Conservative | Tim Smith | 25,319 | 40.4 | ||
| Liberal | Hampton Flint | 3,914 | 6.2 | ||
| National Front | W Annable | 397 | 0.6 | ||
| Majority | 7,797 | 12.4 | |||
| Turnout | 77,878 | 80.6 | |||
| Labour gain from Conservative | Swing | ||||
| Party | Candidate | Votes | % | ± | |
|---|---|---|---|---|---|
| Conservative | Tim Smith | 19,616 | 43.1 | +20.8 | |
| Labour | Michael Cowan | 19,352 | 42.5 | −20.9 | |
| Liberal | Hampton Flint | 4,380 | 9.6 | −4.7 | |
| National Front | George Herrod | 1,734 | 3.8 | N/A | |
| Socialist Workers | June Hall | 453 | 1.0 | N/A | |
| Majority | 264 | 0.6 | |||
| Turnout | |||||
| Conservative gain from Labour | Swing | 20.8 | |||
| Party | Candidate | Votes | % | ± | |
|---|---|---|---|---|---|
| Labour | David Marquand | 35,367 | 63.4 | ||
| Conservative | R. Kemm | 12,452 | 22.3 | ||
| Liberal | Hampton Flint | 7,959 | 14.3 | ||
| Majority | 22,915 | 41.1 | |||
| Turnout | 74,683 | 74.7 | |||
| Labour hold | Swing | ||||
| Party | Candidate | Votes | % | ± | |
|---|---|---|---|---|---|
| Labour | David Marquand | 35,994 | 59.3 | ||
| Conservative | R. Kemm | 14,206 | 23.4 | ||
| Liberal | Hampton Flint | 10,534 | 17.3 | ||
| Majority | 21,788 | 35.9 | |||
| Turnout | 74,095 | 82.0 | |||
| Labour hold | Swing | ||||
| Party | Candidate | Votes | % | ± | |
|---|---|---|---|---|---|
| Labour | David Marquand | 32,372 | 68.2 | ||
| Conservative | R Kemm | 15,089 | 31.8 | ||
| Majority | 17,283 | 36.4 | |||
| Turnout | 67,623 | 70.2 | |||
| Labour hold | Swing | ||||
Elections in the 1960s
| Party | Candidate | Votes | % | ± | |
|---|---|---|---|---|---|
| Labour | David Marquand | 33,477 | 73.63 | ||
| Conservative | ET Gibbons | 11,991 | 26.37 | ||
| Majority | 21,486 | 47.26 | |||
| Turnout | 62,030 | 73.30 | |||
| Labour hold | Swing | ||||
| Party | Candidate | Votes | % | ± | |
|---|---|---|---|---|---|
| Labour | William Warbey | 34,841 | 72.84 | ||
| Conservative | TL Wright | 12,989 | 27.16 | ||
| Majority | 21,852 | 45.69 | |||
| Turnout | 61,960 | 77.19 | |||
| Labour hold | Swing | ||||
Elections in the 1950s
| Party | Candidate | Votes | % | ± | |
|---|---|---|---|---|---|
| Labour | William Warbey | 35,432 | 70.69 | ||
| Conservative | JGW Sandys | 14,690 | 29.31 | ||
| Majority | 20,742 | 41.38 | |||
| Turnout | 61,139 | 81.98 | |||
| Labour hold | Swing | ||||
| Party | Candidate | Votes | % | ± | |
|---|---|---|---|---|---|
| Labour | William Warbey | 32,905 | 71.94 | ||
| Conservative | AS Plane | 12,836 | 28.06 | ||
| Majority | 20,069 | 43.88 | |||
| Turnout | 59,820 | 76.46 | |||
| Labour hold | Swing | ||||
See also
Notes and references
- Notes
- ↑ A county constituency (for the purposes of election expenses and type of returning officer)
- ↑ As with all constituencies, the constituency elects one Member of Parliament (MP) by the first past the post system of election at least every five years.
- References
- ↑ "Usual Resident Population, 2011". Neighbourhood Statistics. Office for National Statistics. Retrieved 26 January 2015.
- ↑ "Electorate Figures - Boundary Commission for England". 2011 Electorate Figures. Boundary Commission for England. 4 March 2011. Archived from the original on 6 November 2010. Retrieved 13 March 2011.
- ↑ BBC News; Ex-cabinet minister Geoff Hoon to stand down as an MP
- ↑ Leigh Rayment's Historical List of MPs – Constituencies beginning with "A" (part 3)
- ↑ "Election Data 2015". Electoral Calculus. Archived from the original on 17 October 2015. Retrieved 17 October 2015.
- ↑ http://www.chad.co.uk/news/local/conservatives-choose-ashfield-candidate-for-general-election-1-7073841
- ↑ Ashfield Liberal Democrats name new candidate Nottingham Post 2 April 2015 Retrieved 2015-04-07
- ↑ "Election Data 2010". Electoral Calculus. Archived from the original on 17 October 2015. Retrieved 17 October 2015.
- ↑ BBC - Election 2010 - Ashfield
- ↑ "Election Data 2005". Electoral Calculus. Archived from the original on 15 October 2011. Retrieved 18 October 2015.
- ↑ "Election Data 2001". Electoral Calculus. Archived from the original on 15 October 2011. Retrieved 18 October 2015.
- ↑ "Election Data 1997". Electoral Calculus. Archived from the original on 15 October 2011. Retrieved 18 October 2015.
- 1 2 3 4 5 6 7 http://www.politicsresources.net/area/uk/constit/441.htm
- ↑ "Election Data 1992". Electoral Calculus. Archived from the original on 15 October 2011. Retrieved 18 October 2015.
- ↑ "Politics Resources". Election 1992. Politics Resources. 9 April 1992. Retrieved 6 Dec 2010.
- ↑ "Election Data 1987". Electoral Calculus. Archived from the original on 15 October 2011. Retrieved 18 October 2015.
- ↑ "Election Data 1983". Electoral Calculus. Archived from the original on 15 October 2011. Retrieved 18 October 2015.
- ↑ http://www.politicsresources.net/area/uk/ge66/i01.htm
- ↑ http://www.politicsresources.net/area/uk/ge64/i01.htm
- ↑ http://www.politicsresources.net/area/uk/ge59/i01.htm
- ↑ http://www.politicsresources.net/area/uk/ge55/i01.htm
Sources
- Youngs, Frederic A., Guide to the Local Administrative Units of England, Vol II, Northern England, London, 1991
Coordinates: 53°07′N 1°16′W / 53.12°N 1.27°W