Amber Valley (UK Parliament constituency)
| Amber Valley | |
|---|---|
|
County constituency for the House of Commons | |
|
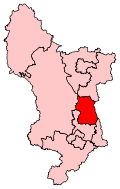
Boundary of Amber Valley in Derbyshire. | |
|
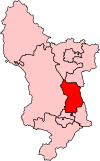
Location of Derbyshire within England. | |
| County | Derbyshire |
| Population | 87,883 (2011 census)[1] |
| Electorate | 69,538 (December 2010)[2] |
| Current constituency | |
| Created | 1983 |
| Member of parliament | Nigel Mills (Conservative) |
| Number of members | One |
| Created from | Belper, Derbyshire South East and Ilkeston[3] |
| Overlaps | |
| European Parliament constituency | East Midlands |

Amber Valley is a constituency[n 1] represented in the House of Commons of the UK Parliament since 2010 by Nigel Mills of the Conservative Party.[n 2]
History
The constituency was created in 1983 and was held by the Conservative Phillip Oppenheim from its creation until Labour's Judy Mallaber won the seat in 1997. She was narrowly defeated in 2010 by Nigel Mills, a Conservative, who increased his majority in 2015.[4]
Boundaries
1983-1997: The District of Amber Valley wards of Aldercar, Alfreton East, Alfreton West, Codnor, Denby and Horsley Woodhouse, Heage and Ambergate, Heanor and Loscoe, Heanor East, Heanor West, Holbrook and Horsley, Kilburn, Riddings, Ripley, Ripley and Marehay, Shipley Park, Somercotes, Swanwick, and Wingfield, and the Borough of Erewash wards of Breadsall and Morley, Little Eaton, and Stanley.
1997-2010: The Borough of Amber Valley wards of Aldercar, Alfreton East, Alfreton West, Codnor, Crich, Denby and Horsley Woodhouse, Heage and Ambergate, Heanor and Loscoe, Heanor East, Heanor West, Holbrook and Horsley, Kilburn, Riddings, Ripley, Ripley and Marehay, Shipley Park, Somercotes, Swanwick, and Wingfield, and the Borough of Erewash wards of Breadsall and Morley, Little Eaton, and Stanley.
2010-present: The Borough of Amber Valley wards of Alfreton, Codnor and Waingroves, Heage and Ambergate, Heanor and Loscoe, Heanor East, Heanor West, Ironville and Riddings, Kilburn, Denby and Holbrook, Langley Mill and Aldercar, Ripley, Ripley and Marehay, Shipley Park, Horsley and Horsley Woodhouse, Somercotes, Swanwick, and Wingfield.
Constituency profile
Amber Valley constituency covers the Derbyshire market and manufacturing towns of Alfreton, Heanor and Ripley, which in a majority of council elections from 1960-2012 been favourably disposed to the Labour Party. The constituency also has a considerable rural / suburban wards which in the same period have generally had a majority in support of the Conservative Party. The constituency stretches from the edge of the Peak District to the northern edge of Derby, which form another set of neighbourhoods more favourably disposed to the Conservatives.
Political control of Amber Valley District Council has not been with Labour since 1988 and has since 2000 been with local Conservatives who narrowly held on to it during their coalition with the Liberal Democrats in May 2012.
Despite swinging away from no overall control locally since 2000, the constituency's recent marginal majorities and bellwether status since 1983 (emulating the result by largest party nationally) means Amber Valley remains, on most common measures, a marginal seat.
Members of Parliament
| Election | Member[5] | Party | |
|---|---|---|---|
| 1983 | Phillip Oppenheim | Conservative | |
| 1997 | Judy Mallaber | Labour | |
| 2010 | Nigel Mills | Conservative | |
Elections
Elections in the 2010s
| Party | Candidate | Votes | % | ± | |
|---|---|---|---|---|---|
| Conservative | Nigel Mills [8] | 20,106 | 44.0 | +5.4 | |
| Labour | Kevin Gillott [9] | 15,901 | 34.8 | -2.7 | |
| UKIP | Stuart Bent | 7,263 | 15.9 | +13.9 | |
| Liberal Democrat | Kate Smith | 1,360 | 3.0 | -11.5 | |
| Green | John Devine [10] | 1,087 | 2.4 | +2.4 | |
| Majority | 4,205 | 9.2 | |||
| Turnout | 45,717 | 65.1 | |||
| Conservative hold | Swing | +4.05 | |||
Going into the 2015 general election, this was the 24th most marginal constituency in Great Britain, Labour requiring a swing from the Conservatives of 0.6% to take the seat (based on the result of the 2010 general election).[11]
| Party | Candidate | Votes | % | ± | |
|---|---|---|---|---|---|
| Conservative | Nigel Mills | 17,746 | 38.6 | +4.7 | |
| Labour | Judy Mallaber | 17,210 | 37.4 | −9.0 | |
| Liberal Democrat | Tom Snowdon | 6,636 | 14.4 | +2.1 | |
| BNP | Michael Clarke | 3,195 | 7.0 | +4.4 | |
| UKIP | Sue Ransome | 906 | 2.0 | +0.3 | |
| Monster Raving Loony | Sam Thing | 265 | 0.6 | N/A | |
| Majority | 536 | 1.2 | |||
| Turnout | 45,958 | 65.5 | +1.5 | ||
| Conservative gain from Labour | Swing | +6.9 | |||
Elections in the 2000s
| Party | Candidate | Votes | % | ± | |
|---|---|---|---|---|---|
| Labour | Judy Mallaber | 21,593 | 45.6 | −6.3 | |
| Conservative | Gillian Shaw | 16,318 | 34.4 | −1.3 | |
| Liberal Democrat | Kate Smith | 6,225 | 13.1 | +0.7 | |
| BNP | Paul Snell | 1,243 | 2.6 | N/A | |
| Veritas | Alex Stevenson | 1,224 | 2.6 | N/A | |
| UKIP | Hugh Price | 788 | 1.7 | N/A | |
| Majority | 5,275 | 11.1 | −5.1 | ||
| Turnout | 47,391 | 62.9 | +2.6 | ||
| Labour hold | Swing | −3.8 | |||
| Party | Candidate | Votes | % | ± | |
|---|---|---|---|---|---|
| Labour | Judy Mallaber | 23,101 | 51.9 | −2.8 | |
| Conservative | Gillian Shaw | 15,874 | 35.7 | +2.2 | |
| Liberal Democrat | Kate Smith | 5,538 | 12.4 | +4.7 | |
| Majority | 7,227 | 16.2 | −5.1 | ||
| Turnout | 44,513 | 60.3 | −15.6 | ||
| Labour hold | Swing | −2.5 | |||
Elections in the 1990s
| Party | Candidate | Votes | % | ± | |
|---|---|---|---|---|---|
| Labour | Judy Mallaber | 29,943 | 54.7 | +10.3 | |
| Conservative | Phillip Oppenheim | 18,330 | 33.4 | −13.0 | |
| Liberal Democrat | Roger Shelley | 4,219 | 7.7 | −1.4 | |
| Referendum | Irene McGibbon | 2,283 | 4.2 | N/A | |
| Majority | 11,613 | 21.3 | +19.2 | ||
| Turnout | 54,775 | 76.0 | −8.7 | ||
| Labour gain from Conservative | Swing | 11.7 | |||
| Party | Candidate | Votes | % | ± | |
|---|---|---|---|---|---|
| Conservative | Phillip Oppenheim | 27,418 | 46.1 | −5.3 | |
| Labour | John Gordon Cooper | 26,706 | 44.9 | +10.6 | |
| Liberal Democrat | Graham Brocklebank | 5,294 | 8.9 | −5.3 | |
| Majority | 712 | 1.2 | −15.9 | ||
| Turnout | 59,418 | 84.7 | +3.5 | ||
| Conservative hold | Swing | −7.9 | |||
Elections in the 1980s
| Party | Candidate | Votes | % | ± | |
|---|---|---|---|---|---|
| Conservative | Phillip Oppenheim | 28,603 | 51.4 | +9.7 | |
| Labour | David Melvyn Bookbinder | 19,103 | 34.4 | −0.9 | |
| Liberal | Stewart Reynolds | 7,904 | 14.2 | −7.1 | |
| Majority | 9,500 | 17.1 | +10.7 | ||
| Turnout | 68,478 | 81.2 | +4.0 | ||
| Conservative hold | Swing | +5.3 | |||
| Party | Candidate | Votes | % | ± | |
|---|---|---|---|---|---|
| Conservative | Phillip Oppenheim | 21,502 | 41.7 | N/A | |
| Labour | David Melvyn Bookbinder | 18,184 | 35.3 | N/A | |
| Liberal | Brian Murray Johnson | 10,989 | 21.3 | N/A | |
| Independent | Peter Franklyn Griffiths | 856 | 1.7 | N/A | |
| Majority | 3,318 | 6.4 | N/A | ||
| Turnout | 66,720 | 77.2 | N/A | ||
| Conservative win (new seat) | |||||
See also
- List of Parliamentary constituencies in Derbyshire
- Opinion polling for the next United Kingdom general election in individual constituencies
Notes
- ↑ A county constituency (for the purposes of election expenses and type of returning officer)
- ↑ As with all constituencies, the constituency elects one Member of Parliament (MP) by the first past the post system of election at least every five years.
References
- ↑ "Usual Resident Population, 2011". Neighbourhood Statistics. Office for National Statistics. Retrieved 25 January 2015.
- ↑ "Electorate Figures - Boundary Commission for England". 2011 Electorate Figures. Boundary Commission for England. 4 March 2011. Retrieved 13 March 2011.
- ↑ "'Amber Valley', June 1983 up to May 1997". ElectionWeb Project. Cognitive Computing Limited. Retrieved 10 March 2016.
- ↑ "Majority Sorted Seats". electoralcalculus.co.uk.
- ↑ Leigh Rayment's Historical List of MPs – Constituencies beginning with "A" (part 1)
- ↑ "Election Data 2015". Electoral Calculus. Archived from the original on 17 October 2015. Retrieved 17 October 2015.
- ↑ http://www.bbc.co.uk/news/politics/constituencies/E14000533
- ↑ "Political parties pick candidates in Amber Valley". Derby Telegraph.
- ↑ "The Labour Party". labour.org.uk.
- ↑ "General Election". Derbyshire Green Party.
- ↑ Ransome Mpini; Charlotte Thornton; John Walton; Marcelo Zanni (24 February 2014). "Election 2015: The political battleground". BBC News. Retrieved 29 January 2015.
- ↑ "Election Data 2010". Electoral Calculus. Archived from the original on 17 October 2015. Retrieved 17 October 2015.
- ↑ "Election Data 2005". Electoral Calculus. Archived from the original on 15 October 2011. Retrieved 18 October 2015.
- ↑ "Election Data 2001". Electoral Calculus. Archived from the original on 15 October 2011. Retrieved 18 October 2015.
- ↑ "Election Data 1997". Electoral Calculus. Archived from the original on 15 October 2011. Retrieved 18 October 2015.
- ↑ "Politics Resources". Election 1997. Politics Resources. 1 May 1997. Retrieved 7 Jan 2011.
- ↑ C. Rallings & M. Thrasher, The Media Guide to the New Parliamentary Constituencies, p.142 (Plymouth: LGC Elections Centre, 1995)
- ↑ The 1997 election result is calculated relative to the notional, not the actual, 1992 result.
- ↑ "Election Data 1992". Electoral Calculus. Archived from the original on 15 October 2011. Retrieved 18 October 2015.
- ↑ "Politics Resources". Election 1992. Politics Resources. 9 April 1992. Retrieved 6 Dec 2010.
- ↑ "Election Data 1987". Electoral Calculus. Archived from the original on 15 October 2011. Retrieved 18 October 2015.
- ↑ "Politics Resources". Election 1987. Politics Resources. 11 June 1987. Retrieved 8 Jan 2011.
- ↑ "Election Data 1983". Electoral Calculus. Archived from the original on 15 October 2011. Retrieved 18 October 2015.
- ↑ "Politics Resources". Election 1983. Politics Resources. 9 June 1983. Retrieved 8 Jan 2011.
Coordinates: 53°02′N 1°24′W / 53.03°N 1.40°W