Bassetlaw (UK Parliament constituency)
| Bassetlaw | |
|---|---|
|
County constituency for the House of Commons | |
|
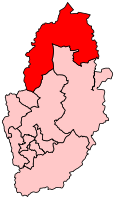
Boundary of Bassetlaw in Nottinghamshire for the 2010 general election. | |
|
Location of Nottinghamshire within England. | |
| County | Nottinghamshire |
| Population | 103,808 (2011 census)[1] |
| Electorate | 78,306 (December 2010)[2] |
| Major settlements | Worksop and Retford |
| Current constituency | |
| Created | 1885 |
| Member of parliament | John Mann (Labour) |
| Number of members | One |
| Created from | North Nottinghamshire |
| Overlaps | |
| European Parliament constituency | East Midlands |

Bassetlaw /ˈbæsᵻtˌlɔː/ is a constituency[n 1] in Nottinghamshire represented in the House of Commons of the UK Parliament since 2001 by John Mann of the Labour Party.[n 2]
Boundaries
The Bassetlaw constituency covers the north of Nottinghamshire, including the towns of Worksop and Retford. It shares the name of the Bassetlaw district.
The constituency includes 22 electoral wards from Bassetlaw District Council:
- Beckingham, Blyth, Carlton, Clayworth, East Retford East, East Retford North, East Retford South, East Retford West, Everton, Harworth, Langold, Misterton, Ranskill, Sturton, Sutton, Welbeck, Worksop East, Worksop North, Worksop North East, Worksop North West, Worksop South, Worksop South East.
Latest boundary changes
Following their review of parliamentary boundaries in Nottinghamshire, the Boundary Commission for England made changes to the constituency for the 2010 general election to allow for population changes, most noticeably by moving the small town of Market Warsop into Mansfield constituency.
History
The constituency was created in 1885 by the Redistribution of Seats Act.
History of boundaries
The Bassetlaw Division (named after one of the ancient Wapentakes of the county) as originally created in 1885 consisted of the municipal borough of East Retford, the petty sessional divisions of Retford and Worksop and part of Mansfield petty sessional division.
In 1918, the number of parliamentary divisions in Nottinghamshire was increased from four to five, with resulting changes in boundaries. Bassetlaw Division was now defined as containing the Municipal Borough of East Retford, the Urban Districts of Warsop and Worksop, and the Rural Districts of Blyth & Cuckney, Misterton and East Retford, with the civil parish of Sookholme from Skegby Rural District.
In 1950, the five Parliamentary Divisions of Nottinghamshire were reorganised as six County Constituencies. Local government boundary changes in the 1930s now meant that Bassetlaw County Constituency was defined as comprising the Municipal Boroughs of East Retford and Worksop, the Urban District of Warsop and the Rural Districts of East Retford and Worksop.
The constituency's boundaries then remained unchanged until 1983. In that year, the town of East Retford and the neighbouring areas were transferred to the redrawn Newark constituency. Bassetlaw constituency then comprised Worksop and surrounding areas in the Bassetlaw district as well as the town of Warsop in the Mansfield district (see list of wards during this period below). There were no boundary changes in 1997.
From 1983 to 2010, the constituency comprised the following Bassetlaw district wards:
- Beckingham, Blyth, Carlton, Clayworth, Everton, Harworth East, Harworth West, Hodsock, Misterton, Rampton, Ranskill, Sturton, Sutton, Welbeck, Worksop East, Worksop North, Worksop North East, Worksop North West, Worksop South, Worksop South East
along with two Mansfield district wards:
- Birklands, Meden (both in the Warsop area). These wards were transferred to Mansfield constituency in 2010.
-

Bassetlaw constituency boundary from 1885 to 1918, shown within the county of Nottinghamshire
-

Constituency boundary from 1950 to 1983, shown within the county of Nottinghamshire
-
Constituency boundary from 1983 to 2010, shown within the county of Nottinghamshire
-
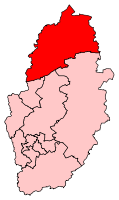
Constituency boundary since 2010, shown within the county of Nottinghamshire
Electoral history
Bassetlaw is a safe seat for the Labour Party, with their candidates having held it since 1935. In fact, Labour first won the seat in the 1929 general election. However, its Member of Parliament Malcolm MacDonald was one of the few Labour MPs to join his father Ramsay MacDonald's National Government. MacDonald held the seat as a National Labour candidate in the 1931 election, but was defeated at the next election in 1935 by Labour's Frederick Bellenger.
Bellenger held the seat until he died in 1968. At the subsequent by-election, the seat was retained for the Labour Party by Joe Ashton, who remained the constituency's MP until his retirement at the 2001 general election. The current MP, since 2001, is John Mann.
Members of Parliament
Elections
Elections in the 2010s
| Party | Candidate | Votes | % | ± | |
|---|---|---|---|---|---|
| Labour | John Mann[5] | 23,965 | 48.6 | -1.8 | |
| Conservative | Sarah Downes | 15,122 | 30.7 | -3.2 | |
| UKIP | Dave Scott[6] | 7,865 | 16.0 | +12.4 | |
| Liberal Democrat | Leon Duveen[7] | 1,331 | 2.7 | -8.5 | |
| Green | Kristopher Wragg[8] | 1,006 | 2.0 | +2 | |
| Majority | 8,843 | 17.9 | +1.3 | ||
| Turnout | 49,289 | 63.6 | -1.2 | ||
| Labour hold | Swing | +0.7 | |||
| Party | Candidate | Votes | % | ± | |
|---|---|---|---|---|---|
| Labour | John Mann | 25,018 | 50.5 | -2.5 | |
| Conservative | Keith Girling | 16,803 | 33.9 | -1.2 | |
| Liberal Democrat | David Dobbie | 5,570 | 11.2 | -0.7 | |
| UKIP | Andrea Hamilton | 1,779 | 3.6 | +3.6 | |
| Independent | Graham Whitehurst | 407 | 0.8 | +0.8 | |
| Majority | 8,215 | 16.6 | -10.3 | ||
| Turnout | 49,577 | 64.8 | +4.0 | ||
| Labour hold | Swing | 0.7 | |||
Elections in the 2000s
| Party | Candidate | Votes | % | ± | |
|---|---|---|---|---|---|
| Labour | John Mann | 22,847 | 56.6 | +1.3 | |
| Conservative | Jonathan Sheppard | 12,010 | 29.8 | -0.4 | |
| Liberal Democrat | David Dobbie | 5,485 | 13.6 | +0.9 | |
| Majority | 10,837 | 26.9 | +1.8 | ||
| Turnout | 40,342 | 58.1 | +1.3 | ||
| Labour hold | Swing | +0.9 | |||
| Party | Candidate | Votes | % | ± | |
|---|---|---|---|---|---|
| Labour | John Mann | 21,506 | 55.3 | -5.7 | |
| Conservative | Alison Holley | 11,758 | 30.2 | +5.3 | |
| Liberal Democrat | Neil Taylor | 4,942 | 12.7 | +2.5 | |
| Socialist Labour | Kevin Meloy | 689 | 1.8 | N/A | |
| Majority | 9,748 | 25.1 | -11.3 | ||
| Turnout | 38,895 | 56.8 | -13.6 | ||
| Labour hold | Swing | ||||
Elections in the 1990s
| Party | Candidate | Votes | % | ± | |
|---|---|---|---|---|---|
| Labour | Joseph William Ashton | 29,298 | 61.1 | +7.7 | |
| Conservative | Martyn Cleasby | 11,838 | 24.7 | −10.3 | |
| Liberal Democrat | Mike Kerringan | 4,950 | 10.3 | −1.3 | |
| Referendum | Roy Graham | 1,838 | 3.8 | N/A | |
| Majority | 17,460 | 36.4 | +18.0 | ||
| Turnout | 47,924 | 70.4 | −8.1 | ||
| Labour hold | Swing | +9.0 | |||
| Party | Candidate | Votes | % | ± | |
|---|---|---|---|---|---|
| Labour | Joseph William Ashton | 29,061 | 53.4 | +5.3 | |
| Conservative | Caroline Spelman | 19,064 | 35.0 | −2.5 | |
| Liberal Democrat | Mike J. Reynolds | 6,340 | 11.6 | −2.8 | |
| Majority | 9,997 | 18.4 | +7.7 | ||
| Turnout | 54,465 | 79.4 | +1.9 | ||
| Labour hold | Swing | +3.9 | |||
Elections in the 1980s
| Party | Candidate | Votes | % | ± | |
|---|---|---|---|---|---|
| Labour | Joseph William Ashton | 25,385 | 48.10 | ||
| Conservative | DRJ Selves | 19,772 | 37.47 | ||
| SDP–Liberal Alliance | WG Smith | 7,616 | 14.43 | ||
| Majority | 5,613 | 10.64 | |||
| Turnout | 52,773 | 77.56 | |||
| Labour hold | Swing | ||||
| Party | Candidate | Votes | % | ± | |
|---|---|---|---|---|---|
| Labour | Joseph William Ashton | 22,231 | 45.60 | ||
| Conservative | M Cleasby | 18,400 | 37.74 | ||
| SDP–Liberal Alliance | B Withnall | 8,124 | 16.66 | ||
| Majority | 3,831 | 7.86 | |||
| Turnout | 48,755 | 74.18 | |||
| Labour hold | Swing | ||||
Elections in the 1970s
| Party | Candidate | Votes | % | ± | |
|---|---|---|---|---|---|
| Labour | Joseph William Ashton | 29,426 | 50.23 | ||
| Conservative | DK Harris | 22,247 | 37.97 | ||
| Liberal | A Wilkinson | 6,913 | 11.80 | ||
| Majority | 7,179 | 12.25 | |||
| Turnout | 58,586 | 79.42 | |||
| Labour hold | Swing | ||||
| Party | Candidate | Votes | % | ± | |
|---|---|---|---|---|---|
| Labour | Joseph William Ashton | 28,663 | 53.69 | ||
| Conservative | DK Harris | 16,494 | 30.90 | ||
| Liberal | A Wilkinson | 7,821 | 14.65 | ||
| The Christian Party | A Storkey | 408 | 0.76 | ||
| Majority | 12,169 | 22.79 | |||
| Turnout | 53,386 | 74.43 | |||
| Labour hold | Swing | ||||
| Party | Candidate | Votes | % | ± | |
|---|---|---|---|---|---|
| Labour | Joseph William Ashton | 33,724 | 59.99 | ||
| Conservative | RC Heading | 22,490 | 40.01 | ||
| Majority | 11,234 | 19.98 | |||
| Turnout | 56,214 | 79.05 | |||
| Labour hold | Swing | ||||
| Party | Candidate | Votes | % | ± | |
|---|---|---|---|---|---|
| Labour | Joseph William Ashton | 28,959 | 54.87 | ||
| Conservative | James Theodore Lester | 20,698 | 39.21 | ||
| Liberal | Malcolm Anthony Haydon-Baillie | 3,125 | 5.92 | ||
| Majority | 8,261 | 15.65 | |||
| Turnout | 52,782 | 76.44 | |||
| Labour hold | Swing | ||||
Elections in the 1960s
| Party | Candidate | Votes | % | ± | |
|---|---|---|---|---|---|
| Labour | Joseph William Ashton | 21,394 | |||
| Conservative | James Theodore Lester | 20,654 | |||
| Independent | Thomas Lynch | 1,053 | |||
| Majority | 740 | ||||
| Turnout | |||||
| Labour hold | Swing | ||||
| Party | Candidate | Votes | % | ± | |
|---|---|---|---|---|---|
| Labour | Frederick John Bellenger | 27,623 | 61.63 | ||
| Conservative | Robert William Martin Orme | 17,195 | 38.37 | ||
| Majority | 10,428 | 23.27 | |||
| Turnout | 73.29 | ||||
| Labour hold | Swing | ||||
| Party | Candidate | Votes | % | ± | |
|---|---|---|---|---|---|
| Labour | Frederick John Bellenger | 27,612 | 59.03 | ||
| Conservative | Robert William Martin Orme | 19,167 | 40.97 | ||
| Majority | 8,445 | 18.05 | |||
| Turnout | 77.00 | ||||
| Labour hold | Swing | ||||
Elections in the 1950s
| Party | Candidate | Votes | % | ± | |
|---|---|---|---|---|---|
| Labour | Frederick John Bellenger | 27,875 | 58.03 | ||
| Conservative | Maurice John Cowling | 20,162 | 41.97 | ||
| Majority | 7,713 | 16.06 | |||
| Turnout | 80.19 | ||||
| Labour hold | Swing | ||||
| Party | Candidate | Votes | % | ± | |
|---|---|---|---|---|---|
| Labour | Frederick John Bellenger | 26,873 | 58.11 | ||
| Conservative | Mrs. Kathleen Voilet Maiden | 19,375 | 41.89 | ||
| Majority | 7,498 | 16.21 | |||
| Turnout | 79.46 | ||||
| Labour hold | Swing | ||||
| Party | Candidate | Votes | % | ± | |
|---|---|---|---|---|---|
| Labour | Frederick John Bellenger | 32,850 | 60.71 | ||
| Conservative | William Arnold Sime | 21,257 | 39.29 | ||
| Majority | 11,593 | 21.43 | |||
| Turnout | 84.36 | ||||
| Labour hold | Swing | ||||
| Party | Candidate | Votes | % | ± | |
|---|---|---|---|---|---|
| Labour | Frederick John Bellenger | 31,589 | 57.64 | ||
| Conservative | John James Cawdell Irving | 17,622 | 32.16 | ||
| Liberal | William GE Dyer | 5,590 | 10.20 | ||
| Majority | 13,967 | 25.49 | |||
| Turnout | 87.15 | ||||
| Labour hold | Swing | ||||
Election in the 1940s
| Party | Candidate | Votes | % | ± | |
|---|---|---|---|---|---|
| Labour | Frederick John Bellenger | 30,382 | 62.79 | ||
| Conservative | Robert Edward Laycock | 18,005 | 37.21 | ||
| Majority | 12,377 | 25.58 | |||
| Turnout | 76.75 | ||||
| Labour hold | Swing | ||||
Election in the 1930s
| Party | Candidate | Votes | % | ± | |
|---|---|---|---|---|---|
| Labour | Frederick John Bellenger | 21,903 | 51.33 | ||
| National Labour | Malcolm John Macdonald | 20,764 | 48.67 | ||
| Majority | 1,139 | 2.67 | |||
| Turnout | 79.87 | ||||
| Labour gain from National Labour | Swing | ||||
| Party | Candidate | Votes | % | ± | |
|---|---|---|---|---|---|
| National Labour | Malcolm John Macdonald | 27,136 | 66.64 | ||
| Labour | Harold Mostyn Watkins | 13,582 | 33.36 | ||
| Majority | 13,554 | 33.29 | |||
| Turnout | 79.55 | ||||
| National Labour gain from Labour | Swing | ||||
Election in the 1920s
| Party | Candidate | Votes | % | ± | |
|---|---|---|---|---|---|
| Labour | Malcolm John Macdonald | 23,681 | 58.7 | +17.7 | |
| Unionist | Sir Ellis William Hume-Williams | 16,670 | 41.3 | -5.0 | |
| Majority | 7,011 | 17.4 | 22.7 | ||
| Turnout | 40,351 | 82.0 | +0.8 | ||
| Labour gain from Unionist | Swing | +11.3 | |||
| Party | Candidate | Votes | % | ± | |
|---|---|---|---|---|---|
| Unionist | Sir Ellis William Hume-Williams | 12,732 | 46.3 | +4.0 | |
| Labour | Malcolm John Macdonald | 11,283 | 41.0 | +12.7 | |
| Liberal | Arthur Neal | 3,505 | 12.7 | -16.7 | |
| Majority | 1,449 | 5.3 | -7.6 | ||
| Turnout | 81.8 | +5.2 | |||
| Unionist hold | Swing | -4.3 | |||

| Party | Candidate | Votes | % | ± | |
|---|---|---|---|---|---|
| Unionist | Sir Ellis William Hume-Williams | 10,419 | 42.3 | -12.9 | |
| Liberal | Arthur Neal | 7,247 | 29.4 | n/a | |
| Labour | Malcolm John Macdonald | 6,973 | 28.3 | -16.5 | |
| Majority | 3,172 | 12.9 | +2.5 | ||
| Turnout | 76.6 | +2.2 | |||
| Unionist hold | Swing | n/a | |||
| Party | Candidate | Votes | % | ± | |
|---|---|---|---|---|---|
| Unionist | Sir Ellis William Hume-Williams | 12,944 | 55.2 | n/a | |
| Labour | Henry Joseph Odell | 10,502 | 44.8 | n/a | |
| Majority | 2,442 | 10.4 | n/a | ||
| Turnout | 74.4 | n/a | |||
| Unionist hold | Swing | n/a | |||
Election in the 1910s
| Party | Candidate | Votes | % | ± | |
|---|---|---|---|---|---|
| Unionist | unopposed | n/a | n/a | ||
- endorsed by Coalition Government
General Election 1914/15:
Another General Election was required to take place before the end of 1915. The political parties had been making preparations for an election to take place and by the July 1914, the following candidates had been selected;
- Unionist: William Ellis Hume-Williams
- Liberal:
| Party | Candidate | Votes | % | ± | |
|---|---|---|---|---|---|
| Conservative | William Ellis Hume-Williams | 5,436 | |||
| Liberal | Stopford William Wentworth Brooke | 5,221 | |||
| Majority | |||||
| Turnout | |||||
| Conservative hold | Swing | ||||
| Party | Candidate | Votes | % | ± | |
|---|---|---|---|---|---|
| Conservative | William Ellis Hume-Williams | 5,631 | |||
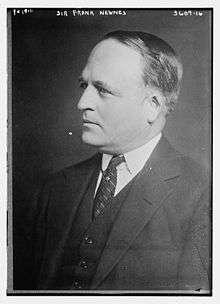
| Liberal | Frank Hillyard Newnes | 5,290 | |||
| Majority | |||||
| Turnout | |||||
| Conservative gain from Liberal | Swing | ||||
Elections in the 1900s
| Party | Candidate | Votes | % | ± | |
|---|---|---|---|---|---|
| Liberal | Frank Hillyard Newnes | 5,365 | n/a | ||
| Conservative | Rt Hon. Sir Frederick George Milner | 4,834 | n/a | ||
| Majority | 531 | n/a | |||
| Turnout | n/a | ||||
| Liberal gain from Conservative | Swing | n/a | |||
| Party | Candidate | Votes | % | ± | |
|---|---|---|---|---|---|
| Conservative | Rt Hon. Sir Frederick George Milner | unopposed | n/a | n/a | |
| Conservative hold | Swing | n/a | |||
Elections in the 1890s
| Party | Candidate | Votes | % | ± | |
|---|---|---|---|---|---|
| Conservative | Sir Frederick George Milner | 4,874 | |||
| Liberal | Robert Eadon Leader | 3,621 | |||
| Majority | 1,253 | ||||
| Turnout | |||||
| Conservative hold | Swing | ||||

| Party | Candidate | Votes | % | ± | |
|---|---|---|---|---|---|
| Conservative | Sir Frederick George Milner | 4,446 | |||
| Liberal | James Henry Yoxall | 4,044 | |||
| Majority | 402 | ||||
| Turnout | |||||
| Conservative hold | Swing | ||||
| Party | Candidate | Votes | % | ± | |
|---|---|---|---|---|---|
| Conservative | Sir Frederick George Milner | 4,381 | n/a | ||
| Liberal | John William Mellor | 3,653 | n/a | ||
| Majority | 728 | n/a | |||
| Conservative hold | Swing | n/a | |||
Elections in the 1880s
| Party | Candidate | Votes | % | ± | |
|---|---|---|---|---|---|
| Conservative | William Beckett-Denison | unopposed | n/a | n/a | |
| Conservative hold | Swing | n/a | |||
| Party | Candidate | Votes | % | ± | |
|---|---|---|---|---|---|
| Conservative | William Beckett-Denison | 4,367 | n/a | ||
| Liberal | Francis John Savile Foljambe | 4,072 | n/a | ||
| Majority | 295 | n/a | |||
| Turnout | n/a | ||||
| Conservative win (new seat) | |||||
See also
Notes and references
- Notes
- ↑ A county constituency (for the purposes of election expenses and type of returning officer)
- ↑ As with all constituencies, the constituency elects one Member of Parliament (MP) by the first past the post system of election at least every five years.
- References
- ↑ "Usual Resident Population, 2011". Neighbourhood Statistics. Office for National Statistics. Retrieved 28 January 2015.
- ↑ "Electorate Figures - Boundary Commission for England". 2011 Electorate Figures. Boundary Commission for England. 4 March 2011. Archived from the original on 6 November 2010. Retrieved 13 March 2011.
- ↑ Leigh Rayment's Historical List of MPs – Constituencies beginning with "B" (part 1)
- ↑ "Election Data 2015". Electoral Calculus. Archived from the original on 17 October 2015. Retrieved 17 October 2015.
- ↑
- ↑
- ↑
- ↑ https://my.greenparty.org.uk/candidates?display_name=Bassetlaw&display_name_1=&display_name_2=All&relationship_type=All[]
- ↑ "Election Data 2010". Electoral Calculus. Archived from the original on 26 July 2013. Retrieved 17 October 2015.
- ↑ "Election Data 2005". Electoral Calculus. Archived from the original on 15 October 2011. Retrieved 18 October 2015.
- ↑ "Election Data 2001". Electoral Calculus. Archived from the original on 15 October 2011. Retrieved 18 October 2015.
- ↑ "Election Data 1997". Electoral Calculus. Archived from the original on 15 October 2011. Retrieved 18 October 2015.
- ↑ "Election Data 1992". Electoral Calculus. Archived from the original on 15 October 2011. Retrieved 18 October 2015.
- ↑ "Politics Resources". Election 1992. Politics Resources. 9 April 1992. Retrieved 2010-12-06.
- ↑ "Election Data 1987". Electoral Calculus. Archived from the original on 15 October 2011. Retrieved 18 October 2015.
- ↑ "Election Data 1983". Electoral Calculus. Archived from the original on 15 October 2011. Retrieved 18 October 2015.
- ↑ British Parliamentary Election Results 1918-1949, FWS Craig
- ↑ British Parliamentary Election Results 1918-1949, FWS Craig
- ↑ British Parliamentary Election Results 1918-1949, FWS Craig
- ↑ British Parliamentary Election Results 1918-1949, FWS Craig
- ↑ British Parliamentary Election Results 1918-1949, FWS Craig
- ↑ Debrett's House of Commons & Judicial Bench, 1916
- ↑ Debrett's House of Commons & Judicial Bench, 1916
- 1 2 3 4 5 6 7 The Liberal Year Book, 1907
- ↑ Debrett's House of Commons & Judicial Bench, 1901
- ↑ Debrett's House of Commons & Judicial Bench, 1901
- ↑ "Election Intelligence, Nottinghamshire (Bassetlaw Division): Result Of The Poll". The Times. 17 December 1890.
- ↑ The Constitiutional Year Book, 1904, published by Conservative Central Office, page 151 (175 in web page)
- ↑ Debrett's House of Commons & Judicial Bench, 1886
Sources
- UK General Election 1945 results
- UK General Election 1950 results
- UK General Election 1951 results
- UK General Election 1955 results
- UK General Election 1959 results
- UK General Election 1964 results
- UK General Election 1966 results
- UK General Election 1970 results
- UK General Election February 1974 results
- UK General Election October 1974 results
- UK General Election 1979 results
- UK General Election 1983 results
- UK General Election 1987 results
- UK General Election 1992 results
- UK General Election 1997 results
- UK General Election 2001 results
- UK General Election 2005 results
- UK General Election 2010 results (BBC)
Coordinates: 53°24′N 0°57′W / 53.40°N 0.95°W