North West Leicestershire (UK Parliament constituency)
| North West Leicestershire | |
|---|---|
|
County constituency for the House of Commons | |
|
Boundary of North West Leicestershire in Leicestershire. | |
|
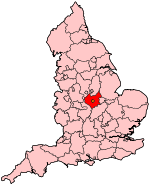
Location of Leicestershire within England. | |
| County | Leicestershire |
| Electorate | 72,022 (December 2010)[1] |
| Major settlements | Coalville and Ashby-de-la-Zouch |
| Current constituency | |
| Created | 1983 |
| Member of parliament | Andrew Bridgen (Conservative) |
| Number of members | One |
| Created from | Bosworth and Loughborough |
| Overlaps | |
| European Parliament constituency | East Midlands |

North West Leicestershire is a constituency[n 1] represented in the House of Commons of the UK Parliament since 2010 by Andrew Bridgen, a Conservative.[n 2]
History
The constituency was won in 1983 by the Conservative David Ashby. He stood down in 1997 and the seat was won by Labour's David Taylor, who held the seat until he died of a heart attack in December 2009. Taylor had already announced that he would stand down at the 2010 general election. With the next election being due on 6 May 2010, it was considered uneconomic and (based on precedent) unnecessary to arrange a by-election. In the 2010 election, Andrew Bridgen took the seat for the Conservatives with a swing of 12% from Labour to the Conservatives and with a smaller Lab-LD swing. Bridgen's majority was 7,511 or 14.5% of the total votes cast.
At the 2010 election the BNP unusually succeeded in holding their deposit by winning more than 5% of the vote, and for the first time in the constituency they achieved fourth place.
Constituency profile
A marginal seat and bellwether since 1983, North West Leicestershire's main settlements are Coalville and Ashby-de-la-Zouch. The population is divided between Labour-inclined former mining areas with high rates of employment[2] and low social housing dependency,[3][n 3] and Conservative-inclined rural villages, with most people focused close to the two towns named.[4]
In 2011 Coalfield Resources plc were given permission to develop an opencast coal mining pit on the site of the former Minorca colliery on the outskirts of Measham in the seat which will be 1 mi (1.6 km) across and extract 1,250,000 tonnes (1,230,000 tons) of coal over five years, and 250,000 tonnes (about 245,000 tons) of clay. This will be one of three large mines all operated by the main UK coal-extracting company.[5]
Boundaries
North West Leicestershire constituency was created in 1983 from parts of the seats of Bosworth to the south and Loughborough to the east. It covers the same area as the North West Leicestershire district in the East Midlands.
Parliament accepted the Boundary Commission's Fifth Periodic Review of Westminster constituencies making no changes for the 2010 general election and so the area has the electoral wards:
- Appleby; Ashby: Castle, Holywell, Ivanhoe; Bardon; Breedon; Castle Donington; Coalville; Greenhill; Hugglescote; Ibstock and Heather; Kegworth and Whatton; Measham; Moira; Oakthorpe and Donisthorpe; Ravenstone and Packington; Snibston; Thringstone; Valley and Whitwick.[6]
Members of Parliament
| Election | Member[7] | Party | Notes | |
|---|---|---|---|---|
| 1983 | David Ashby | Conservative | ||
| 1997 | David Taylor | Labour | Died December 2009 | |
| 2010 | Andrew Bridgen | Conservative | ||
Elections
Elections in the 2010s
| Party | Candidate | Votes | % | ± | |
|---|---|---|---|---|---|
| Conservative | Andrew Bridgen | 25,505 | 49.5 | +4.9 | |
| Labour | Jamie McMahon | 14,132 | 27.4 | −2.7 | |
| UKIP | Andy McWilliam[9] | 8,704 | 16.9 | +14.7 | |
| Liberal Democrat | Mark Argent[10] | 2,033 | 3.9 | −12.7 | |
| Green | Benjamin Gravestock[11] | 1,174 | 2.3 | +2.3 | |
| Majority | 11,373 | 22.1 | |||
| Turnout | 51,548 | 71.4 | |||
| Conservative hold | Swing | +3.8 | |||
Previously David Parsons was announced as the UKIP candidate for 2015.[12]
| Party | Candidate | Votes | % | ± | |
|---|---|---|---|---|---|
| Conservative | Andrew Bridgen | 23,147 | 44.6 | +8.6 | |
| Labour | Ross Willmott | 15,636 | 30.1 | −15.4 | |
| Liberal Democrat | Paul Reynolds | 8,639 | 16.6 | +4.6 | |
| BNP | Ian Meller | 3,396 | 6.5 | +3.4 | |
| UKIP | Martin Green | 1,134 | 2.2 | −1.1 | |
| Majority | 7,511 | 14.5 | |||
| Turnout | 51,952 | 72.9 | +6.1 | ||
| Conservative gain from Labour | Swing | +12.0 | |||
Elections in the 2000s
| Party | Candidate | Votes | % | ± | |
|---|---|---|---|---|---|
| Labour Co-op | David Leslie Taylor | 21,449 | 45.5 | −6.6 | |
| Conservative | Nicola Le Page | 16,972 | 36.0 | +2.1 | |
| Liberal Democrat | Roderick Alan Keys | 5,682 | 12.1 | +1.8 | |
| UKIP | John Blunt | 1,563 | 3.3 | +1.0 | |
| BNP | Clive Barrie Potter | 1,474 | 3.1 | N/A | |
| Majority | 4,477 | 9.5 | |||
| Turnout | 47,140 | 66.8 | +1.0 | ||
| Labour Co-op hold | Swing | −4.4 | |||
| Party | Candidate | Votes | % | ± | |
|---|---|---|---|---|---|
| Labour Co-op | David Leslie Taylor | 23,431 | 52.1 | −4.3 | |
| Conservative | Nick Weston | 15,274 | 33.9 | +2.9 | |
| Liberal Democrat | Charlie Dennis Fraser-Fleming | 4,651 | 10.3 | +1.7 | |
| UKIP | William Nattrass | 1,021 | 2.3 | N/A | |
| Independent | Robert Nettleton | 632 | 1.4 | N/A | |
| Majority | 8,157 | 19.0 | |||
| Turnout | 43,219 | 65.8 | −14.2 | ||
| Labour Co-op hold | Swing | ||||
Elections in the 1990s
| Party | Candidate | Votes | % | ± | |
|---|---|---|---|---|---|
| Labour Co-op | David Leslie Taylor | 29,332 | 56.4 | +12.5 | |
| Conservative | Robert Goodwill | 16,113 | 31.0 | −14.5 | |
| Liberal Democrat | Stan Heptinstall | 4,492 | 8.6 | −1.7 | |
| Referendum | Maurice Michael Huddleston Abney-Hastings | 2,008 | 4.0 | N/A | |
| Majority | 13,219 | 25.4 | |||
| Turnout | 51,945 | 80.0 | |||
| Labour Co-op gain from Conservative | Swing | ||||
| Party | Candidate | Votes | % | ± | |
|---|---|---|---|---|---|
| Conservative | David Ashby | 28,379 | 45.5 | −2.1 | |
| Labour | David Leslie Taylor | 27,400 | 43.9 | +9.7 | |
| Liberal Democrat | Jeremy William Ronald Beckett | 6,353 | 10.2 | −7.0 | |
| Natural Law | David John Fawcett | 229 | 0.4 | N/A | |
| Majority | 979 | 1.6 | −11.8 | ||
| Turnout | 62,361 | 86.1 | +3.3 | ||
| Conservative hold | Swing | −5.9 | |||
Elections in the 1980s
| Party | Candidate | Votes | % | ± | |
|---|---|---|---|---|---|
| Conservative | David Ashby | 27,872 | 47.6 | +3.0 | |
| Labour | Mrs. Susan Andree Waddington | 20,044 | 34.3 | +1.7 | |
| Liberal | David Stuart Emmerson | 10,034 | 17.1 | −4.6 | |
| Green | Miss Helen Theresa Michetschlager | 570 | 1.0 | −0.1 | |
| Majority | 7,828 | 13.38 | |||
| Turnout | 58,520 | 82.85 | |||
| Conservative hold | Swing | ||||
| Party | Candidate | Votes | % | ± | |
|---|---|---|---|---|---|
| Conservative | David Ashby | 24,760 | 44.6 | N/A | |
| Labour | Imelda Mary Read | 18,098 | 32.6 | N/A | |
| Liberal | Geoffrey Ronald Cort | 12,043 | 21.7 | N/A | |
| Ecology | Mrs. Dinah Gillian Freer | 637 | 1.15 | N/A | |
| Majority | 6,662 | 12.0 | N/A | ||
| Turnout | 55,538 | 81.07 | N/A | ||
| Conservative win (new seat) | |||||
See also
Notes and references
- Notes
- ↑ A county constituency (for the purposes of election expenses and type of returning officer)
- ↑ As with all constituencies, the constituency elects one Member of Parliament (MP) by the first past the post system of election at least every five years.
- ↑ This should be contrasted with most constituencies in County Durham, South Yorkshire and West Yorkshire which historically had a similar but more densely populated mining population and which have higher Indicators of Multiple Deprivation and are Labour safe seats based on length of service by one political party
- References
- ↑ "Electorate Figures - Boundary Commission for England". 2011 Electorate Figures. Boundary Commission for England. 4 March 2011. Retrieved 13 March 2011.
- ↑ 2011 census interactive maps
- ↑ 2001 Census
- ↑ Open Street Map
- ↑ "Leicestershire opencast coal mine gains approval" BBC News
- ↑ 2010 post-revision map non-metropolitan areas and unitary authorities of England
- ↑ Leigh Rayment's Historical List of MPs – Constituencies beginning with "L" (part 2)
- ↑ "Election Data 2015". Electoral Calculus. Archived from the original on 17 October 2015. Retrieved 17 October 2015.
- ↑ http://ukpollingreport.co.uk/2015guide/hampshirenorthwest/
- ↑ http://www.markargent4nwleics.org.uk
- ↑ https://my.greenparty.org.uk/candidates/106112
- ↑ Owen, David W (10 September 2014). "Former Conservative county council leader gives up UKIP parliamentary candidacy". Retrieved 22 January 2015.
- ↑ "Election Data 2010". Electoral Calculus. Archived from the original on 17 October 2015. Retrieved 17 October 2015.
- 1 2 "Election Data 2001". Electoral Calculus. Archived from the original on 15 October 2011. Retrieved 18 October 2015.
- ↑ North West Leicestershire general election, 2005 results, North West Leicestershire District Council
- 1 2 Henig, Simon; Lewis Baston (2002). The Political Map of Britain. London: Politico's. p. 477. ISBN 1-84275-015-1.
- ↑ "Election Data 1997". Electoral Calculus. Archived from the original on 15 October 2011. Retrieved 18 October 2015.
- ↑ "Election Data 1992". Electoral Calculus. Archived from the original on 15 October 2011. Retrieved 18 October 2015.
- ↑ "Politics Resources". Election 1992. Politics Resources. 9 April 1992. Retrieved 2010-12-06.
- ↑ "Election Data 1987". Electoral Calculus. Archived from the original on 15 October 2011. Retrieved 18 October 2015.
- ↑ "Election Data 1983". Electoral Calculus. Archived from the original on 15 October 2011. Retrieved 18 October 2015.
Coordinates: 52°45′N 1°24′W / 52.75°N 1.4°W