California's 1st congressional district
| California's 1st congressional district | ||
|---|---|---|
.tif.png) | ||
| Current Representative | Doug LaMalfa (R–Richvale) | |
| Ethnicity | 79.1% White, 1.7% Black, 3.1% Asian, 12% Hispanic, 4.1[1]% other | |
| Cook PVI | R+10 | |
California's 1st congressional district is a congressional district in the U.S. state of California.
Doug LaMalfa, a Republican, has represented the district since January 2013.
Currently, the 1st district encompasses the northeastern part of the state. It consists of Butte, Lassen, Modoc, Plumas, Shasta, Sierra, Siskiyou, and Tehama counties plus portions of Glenn, Nevada, and Placer counties.[2]
Prior to redistricting by the California Citizens Redistricting Commission of 2011, the 1st district encompassed the northern coast of the state. It consisted of Del Norte, Humboldt, Lake, Mendocino and Napa counties plus portions of Sonoma and Yolo counties. Much of that area is now the 5th district, while the current 1st district comprises much of the territory that had been the 2nd district.
Competitiveness
The GOP held the seat for all but three years from 1949 to 1983. After 20-year incumbent Don Clausen was unseated in 1983, the district was a swing area for most of the next 15 years. The GOP last held the seat in 1998 when U.S. Representative Frank Riggs decided to run for the U.S. Senate. Riggs was replaced by long-time Democratic Assemblyman and State Senator Mike Thompson. Redistricting in 2001 added Democratic-leaning areas of Yolo County.
John Kerry won the district in 2004 presidential election with 59.7% of the vote. Barack Obama carried the district in 2008 presidential election with 65.60% of the vote.
Election results from recent statewide races
| Year | U.S. President | U.S. Senator (Class 1) | U.S. Senator (Class 3) | Governor |
|---|---|---|---|---|
| 1992 | Clinton 46.8 - 29.2% | Feinstein 57.9 - 33.8% | Boxer 49.8 - 39.4% | — |
| 1994 | — | Feinstein 47.9 - 43.1% | — | Wilson 53.0 - 41.8% |
| 1996 | Clinton 48.2 - 35.4% | — | — | — |
| 1998 | — | — | [Data unknown/missing. You can help!] | [Data unknown/missing. You can help!] |
| 2000 | Gore 50.0 - 41.0%[3] | Feinstein 53.1 - 36.0%[4] | — | — |
| 2002 | — | — | — | Davis 46.9 - 36.3%[5] |
| 2003 | — | — | — | Recall: No 53.0 - 47.0%[6][7] |
| Schwarzenegger 40.8 - 36.0% | ||||
| 2004 | Kerry 59.7 - 38.4%[8] | — | Boxer 60.5 - 34.2%[9] | — |
| 2006 | — | Feinstein 62.7 - 29.6%[10] | — | Schwarzenegger 51.0 - 40.9% |
| 2008 | Obama 65.6 - 31.7%[11] | — | — | — |
| 2010 | — | — | Boxer 59.4 - 34.6%[12] | Brown 57.0 - 35.9%[13] |
| 2012 | Romney 56.6 - 40.3% | [Data unknown/missing. You can help!] | — | — |
| 2014 | — | — | — | [Data unknown/missing. You can help!] |
List of representatives
| Representative | Party | Years | Electoral history | Counties |
|---|---|---|---|---|
| District created | March 4, 1865 | |||
 Donald C. McRuer Donald C. McRuer |
Republican | March 4, 1865 – March 3, 1867 |
Retired. | Fresno, Inyo, Kern, Los Angeles, Mariposa, Merced, Monterey, San Diego, San Francisco, San Luis Obispo, San Mateo, Santa Barbara, Santa Clara, Santa Cruz, Stanislaus, Tulare |
 Samuel Beach Axtell Samuel Beach Axtell |
Democratic | March 4, 1867 – March 3, 1871 |
Retired. | |
 Sherman Otis Houghton Sherman Otis Houghton |
Republican | March 4, 1871 – March 3, 1873 |
Redistricted to the 4th district. | |
 Charles Clayton Charles Clayton |
Republican | March 4, 1873 – March 3, 1875 |
Retired. | San Francisco |
 William Adam Piper William Adam Piper |
Democratic | March 4, 1875 – March 3, 1877 |
Lost re-election. | |
 Horace Davis Horace Davis |
Republican | March 4, 1877 – March 3, 1881 |
Lost re-election. | |
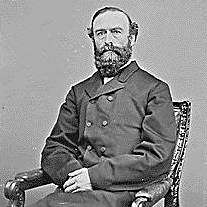
 William Rosecrans William Rosecrans |
Democratic | March 4, 1881 – March 3, 1885 |
Retired. | |
.jpg) Barclay Henley Barclay Henley |
Democratic | March 4, 1885 – March 3, 1887 |
Redistricted from the 3rd district. | Colusa, Del Norte, Humboldt, Lake, Lassen, Mendocino, Modoc, Napa, Plumas, Shasta, Sierra, Siskiyou, Sonoma, Tehama, Trinity |
 Thomas L. Thompson Thomas L. Thompson |
Democratic | March 4, 1887 – March 3, 1889 |
Lost re-election. | |
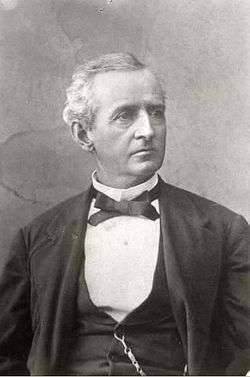
 John J. De Haven John J. De Haven |
Republican | March 4, 1889 – October 1, 1890 |
Resigned after being appointed associate justice of California Supreme Court. | |
| Vacant | October 1, 1890 – December 9, 1890 | |||
 Thomas J. Geary Thomas J. Geary |
Democratic | December 9, 1890 – March 3, 1895 |
First elected to finish De Haven's term. Redistricted to the 2nd district. | |
 John All Barham John All Barham |
Republican | March 4, 1895 – March 3, 1901 |
Retired. | Del Norte, Humboldt, Lassen, Marin, Mendocino, Modoc, Napa, Plumas, Shasta, Sierra, Siskiyou, Sonoma, Tehama, Trinity |
 Frank Coombs Frank Coombs |
Republican | March 4, 1901 – March 3, 1903 |
Lost re-election. | |
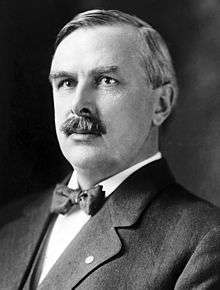
 James N. Gillett James N. Gillett |
Republican | March 4, 1903 – November 4, 1906 |
Resigned after being elected Governor. | Alpine, Amador, Calaveras, Del Norte, El Dorado, Humboldt, Lassen, Mariposa, Modoc, Mono, Nevada, Placer, Plumas, Shasta, Sierra, Siskiyou, Tehama, Trinity, Tuolumne |
| Vacant | November 4, 1906 – November 6, 1906 | |||
.jpg) William F. Englebright William F. Englebright |
Republican | November 6, 1906 – March 3, 1911 |
First elected to finish Gillett's term. Lost re-election. | |
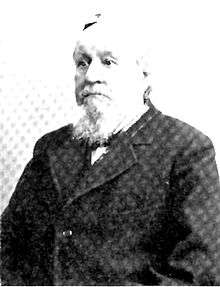
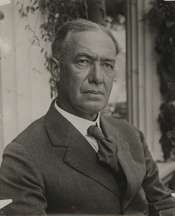
 John E. Raker John E. Raker |
Democratic | March 4, 1911 – March 3, 1913 |
Redistricted to the 2nd district. | |
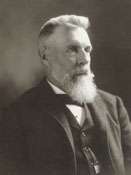
 William Kent William Kent |
Independent | March 4, 1913 – March 3, 1917 |
Redistricted from the 2nd district Retired. |
Butte, Colusa, Del Norte, Glenn, Humboldt, Lake, Marin, Mendocino, Sonoma, Sutter, Yuba |
 Clarence F. Lea Clarence F. Lea |
Democratic | March 4, 1917 – January 3, 1949 |
Retired. | |
 Hubert B. Scudder Hubert B. Scudder |
Republican | January 3, 1949 – January 3, 1953 |
Retired. | |
| January 3, 1953 – January 3, 1959 |
Del Norte, Humboldt, Lake, Marin, Mendocino, Napa, Sonoma | |||
 Clement Woodnutt Miller Clement Woodnutt Miller |
Democratic | January 3, 1959 – October 7, 1962 |
Died | |
| Vacant | October 7, 1962 – January 22, 1963 | |||
 Donald H. Clausen Donald H. Clausen |
Republican | January 22, 1963 – January 3, 1967 |
First elected to finish Miller's term. Redistricted to the 2nd district. |
Del Norte, Humboldt, Marin, Mendocino, Napa, Sonoma |
| January 3, 1967 – January 3, 1973 |
Del Norte, Humboldt, most of Marin, Mendocino, Napa, Sonoma | |||
| January 3, 1973 – January 3, 1975 |
Butte, Glenn, Lassen, Modoc, Nevada, Placer, Plumas, Shasta, Sierra, Siskiyou, Tehama, Trinity, Yuba | |||
 Harold T. Johnson Harold T. Johnson |
Democratic | January 3, 1975 – January 3, 1981 |
Redistricted from the 2nd district Lost re-election. | |
 Eugene A. Chappie Eugene A. Chappie |
Republican | January 3, 1981 – January 3, 1983 |
Redistricted to the 2nd district. | |
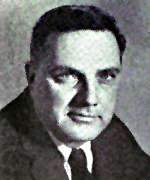
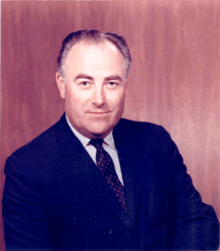
 Douglas H. Bosco Douglas H. Bosco |
Democratic | January 3, 1983 – January 3, 1991 |
Lost re-election. | Del Norte, Humboldt, western Lake, Mendocino, southern Napa, northern Sonoma |
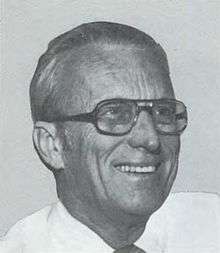
 Frank Riggs Frank Riggs |
Republican | January 3, 1991 – January 3, 1993 |
Lost re-election. | |
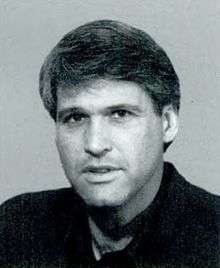 Daniel Hamburg Daniel Hamburg |
Democratic | January 3, 1993 – January 3, 1995 |
Lost re-election. | Del Norte, Humboldt, western Lake, Mendocino, Napa, northwestern Solano, northeastern Sonoma |
| Frank Riggs |
Republican | January 3, 1995 – January 3, 1999 |
Retired to run for Senate. | |
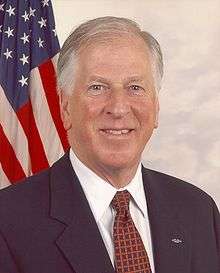 Mike Thompson Mike Thompson |
Democratic | January 3, 1999 – January 3, 2003 |
First elected in 1998. Redistricted to the 5th district. | |
| January 3, 2003 – January 3, 2013 |
 Del Norte, Humboldt, Lake, Mendocino, Napa, eastern Sonoma, southern Yolo | |||
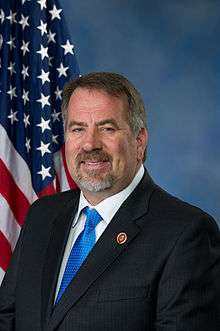 Doug LaMalfa Doug LaMalfa |
Republican | January 3, 2013 – present |
First elected in 2012. | Inland Northern California including Chico and Redding |
Election results for representatives
|
1864 • 1866 • 1868 • 1870 • 1872 • 1874 • 1876 • 1878 • 1880 • 1882 • 1884 • 1886 • 1888 • 1890 (Special) • 1892 • 1894 • 1896 • 1898 • 1900 • 1902 • 1904 • 1906 (Special) • 1908 • 1910 • 1912 • 1914 • 1916 • 1918 • 1920 • 1922 • 1924 • 1926 • 1928 • 1930 • 1932 • 1934 • 1936 • 1938 • 1940 • 1942 • 1944 • 1946 • 1948 • 1950 • 1952 • 1954 • 1956 • 1958 • 1960 • 1962 • 1963 (Special) • 1964 • 1966 • 1968 • 1970 • 1972 • 1974 • 1976 • 1978 • 1980 • 1982 • 1984 • 1986 • 1988 • 1990 • 1992 • 1994 • 1996 • 1998 • 2000 • 2002 • 2004 • 2006 • 2008 • 2012 • 2014 |
1864
| Party | Candidate | Votes | % | |
|---|---|---|---|---|
| Republican | Donald C. McRuer | 20,370 | 58.9 | |
| Democratic | Joseph B. Crocker | 14,191 | 41.1 | |
| Total votes | 34,561 | 100.0 | ||
| Voter turnout | % | |||
| Republican hold | ||||
1866
| Party | Candidate | Votes | % | |
|---|---|---|---|---|
| Democratic | Samuel Beach Axtell | 18,793 | 57.3 | |
| Republican | Timothy Guy Phelps | 13,989 | 42.7 | |
| Total votes | 32,782 | 100.0 | ||
| Voter turnout | % | |||
| Democratic hold | ||||
1868
| Party | Candidate | Votes | % | |
|---|---|---|---|---|
| Democratic | Samuel Beach Axtell (inc.) | 23,632 | 54.1 | |
| Republican | Frank M. Pixley | 20,081 | 45.9 | |
| Total votes | 43,713 | 100.0 | ||
| Voter turnout | % | |||
| Democratic hold | ||||
1870
| Party | Candidate | Votes | % | |
|---|---|---|---|---|
| Republican | Sherman Otis Houghton | 25,971 | 51.6 | |
| Democratic | Lawrence Archer | 24,374 | 48.4 | |
| Total votes | 50,345 | 100.0 | ||
| Voter turnout | % | |||
| Republican hold | ||||
1872
| Party | Candidate | Votes | % | ||
|---|---|---|---|---|---|
| Republican | Charles Clayton | 11,938 | 52.3 | ||
| Democratic | William Adam Piper | 10,883 | 47.7 | ||
| Total votes | 22,821 | 100.0 | |||
| Voter turnout | % | ||||
| Republican win (new seat) | |||||
1874
| Party | Candidate | Votes | % | |
|---|---|---|---|---|
| Democratic | William Adam Piper | 12,417 | 49.1 | |
| Republican | Ira P. Rankin | 6,791 | 26.8 | |
| Independent | John F. Swift | 6,103 | 24.1 | |
| Total votes | 25,311 | 100.0 | ||
| Voter turnout | % | |||
| Democratic hold | ||||
1876
| Party | Candidate | Votes | % | |
|---|---|---|---|---|
| Republican | Horace Davis | 22,134 | 53.3 | |
| Democratic | William Adam Piper (inc.) | 19,363 | 46.7 | |
| Total votes | 41,497 | 100.0 | ||
| Voter turnout | % | |||
| Republican hold | ||||
1878
| Party | Candidate | Votes | % | |
|---|---|---|---|---|
| Republican | Horace Davis (incumbent) | 20,074 | 48.4 | |
| Independent | Clitus Barbour | 18,449 | 44.5 | |
| Democratic | Charles R. Summer | 2,940 | 7.1 | |
| Total votes | 41,463 | 100.0 | ||
| Voter turnout | % | |||
| Republican hold | ||||
1880
| Party | Candidate | Votes | % | |
|---|---|---|---|---|
| Democratic | William Rosecrans | 21,005 | 51.0 | |
| Republican | Horace Davis (incumbent) | 19,496 | 47.3 | |
| Greenback | Stephen Maybell | 683 | 1.7 | |
| Total votes | 41,184 | 100.0 | ||
| Voter turnout | % | |||
| Democratic hold | ||||
1882
| Party | Candidate | Votes | % | |
|---|---|---|---|---|
| Democratic | William Rosecrans (inc.) | 22,733 | 59.5 | |
| Republican | Paul Neumann | 14,847 | 38.8 | |
| Prohibition | James M. Shafter | 580 | 1.5 | |
| Greenback | H. S. Fitch | 67 | 0.2 | |
| Total votes | 38,227 | 100.0 | ||
| Voter turnout | % | |||
| Democratic hold | ||||
1884
| Party | Candidate | Votes | % | |
|---|---|---|---|---|
| Democratic | Barclay Henley | 16,461 | 49.7 | |
| Republican | Thomas L. Carothers | 16,316 | 49.3 | |
| Independent | C. C. Bateman [14] | 321 | 1.0 | |
| Total votes | 33,098 | 100.0 | ||
| Voter turnout | % | |||
| Democratic hold | ||||
1886
| Party | Candidate | Votes | % | |
|---|---|---|---|---|
| Democratic | Thomas Larkin Thompson | 16,499 | 50.1 | |
| Republican | Charles A. Garter | 15,526 | 47.1 | |
| Prohibition | L. W. Simmons | 849 | 2.6 | |
| Independent | Philip Cowen | 80 | 0.2 | |
| Total votes | 32,954 | 100.0 | ||
| Voter turnout | % | |||
| Democratic hold | ||||
1888
| Party | Candidate | Votes | % | |
|---|---|---|---|---|
| Republican | John J. De Haven | 19,345 | 49.9 | |
| Democratic | Thomas Larkin Thompson (I) | 19,019 | 49.0 | |
| Know Nothing | W. D. Reynolds [15] | 428 | 1.1 | |
| Total votes | 38,792 | 100.0 | ||
| Voter turnout | % | |||
| Republican hold | ||||
1890 (Special)
| Party | Candidate | Votes | % | |
|---|---|---|---|---|
| Democratic | Thomas J. Geary | 19,334 | 49.3 | |
| Republican | John All Barham | 19,153 | 48.8 | |
| Prohibition | L. B. Scranton | 759 | 1.9 | |
| Total votes | 39,246 | 100.0 | ||
| Voter turnout | % | |||
| Democratic hold | ||||
1892
| Party | Candidate | Votes | % | |
|---|---|---|---|---|
| Democratic | Thomas J. Geary (incumbent) | 19,308 | 56.8 | |
| Republican | Edward W. Davis | 13,123 | 38.6 | |
| Populist | C. C. Swafford | 1,546 | 4.6 | |
| Total votes | 33,977 | 100.0 | ||
| Voter turnout | % | |||
| Democratic hold | ||||
1894
| Party | Candidate | Votes | % | |
|---|---|---|---|---|
| Republican | John All Barham | 15,101 | 41.1 | |
| Democratic | Thomas J. Geary (incumbent) | 13,570 | 37.0 | |
| Populist | Roger F. Grigsby | 7,246 | 19.7 | |
| Prohibition | J. R. Gregory | 790 | 2.2 | |
| Total votes | 36,707 | 100.0 | ||
| Voter turnout | % | |||
| Republican hold | ||||
1896
| Party | Candidate | Votes | % | |
|---|---|---|---|---|
| Republican | John All Barham (incumbent) | 17,826 | 49.7 | |
| Democratic | Fletcher A. Cutler | 16,328 | 45.5 | |
| Populist | George W. Montieth | 1,497 | 4.2 | |
| Prohibition | B. F. Taylor | 249 | 0.7 | |
| Total votes | 35,900 | 100.0 | ||
| Voter turnout | % | |||
| Republican hold | ||||
1898
| Party | Candidate | Votes | % | |
|---|---|---|---|---|
| Republican | John All Barham (incumbent) | 19,598 | 51.8 | |
| Democratic | Emmet Seawell | 18,244 | 48.2 | |
| Total votes | 37,842 | 100.0 | ||
| Voter turnout | % | |||
| Republican hold | ||||
1900
| Party | Candidate | Votes | % | |
|---|---|---|---|---|
| Republican | Frank Coombs | 21,227 | 55.3 | |
| Democratic | James F. Farraher | 16,270 | 42.4 | |
| Social Democrat | William Morgan [16] | 599 | 1.6 | |
| Prohibition | Charles T. Clark | 310 | 0.8 | |
| Total votes | 38,406 | 100.0 | ||
| Voter turnout | % | |||
| Republican hold | ||||
1902
| Party | Candidate | Votes | % | |
|---|---|---|---|---|
| Republican | James Gillett (inc.) | 21,268 | 50.5 | |
| Democratic | Anthony Caminetti | 19,696 | 46.7 | |
| Socialist | M. F. Shore | 810 | 1.9 | |
| Prohibition | W. O. Clark | 362 | 0.9 | |
| Total votes | 42,136 | 100.0 | ||
| Voter turnout | % | |||
| Republican hold | ||||
1904
| Party | Candidate | Votes | % | |
|---|---|---|---|---|
| Republican | James Gillett (inc.) | 21,602 | 54.1 | |
| Democratic | Anthony Caminetti | 15,706 | 39.3 | |
| Socialist | A. J. Gaylord | 2,197 | 5.5 | |
| Prohibition | Jarrot L. Rollins | 421 | 1.1 | |
| Total votes | 39,926 | 100.0 | ||
| Voter turnout | % | |||
| Republican hold | ||||
1906 (Special)
| Party | Candidate | Votes | % | |
|---|---|---|---|---|
| Republican | William F. Englebright | 18,125 | 95.2 | |
| Democratic | F. W. Taft | 539 | 2.8 | |
| Socialist | J. C. Weybright | 325 | 1.7 | |
| Prohibition | R. L. Webb | 51 | 0.3 | |
| Total votes | 19,040 | 100.0 | ||
| Voter turnout | % | |||
| Republican hold | ||||
1908
| Party | Candidate | Votes | % | |
|---|---|---|---|---|
| Republican | William F. Englebright (inc.) | 20,624 | 54.1 | |
| Democratic | E. W. Holland | 14,031 | 36.8 | |
| Socialist | D. N. Cunningham | 2,898 | 7.6 | |
| Prohibition | W. P. Fassett | 546 | 1.4 | |
| Total votes | 38,099 | 100.0 | ||
| Voter turnout | % | |||
| Republican hold | ||||
1910
| Party | Candidate | Votes | % | |
|---|---|---|---|---|
| Democratic | John E. Raker | 16,704 | 45.4 | |
| Republican | William F. Englebright (inc.) | 16,570 | 45.1 | |
| Socialist | William Morgan | 3,231 | 8.8 | |
| Prohibition | C. H. Essex | 259 | 0.7 | |
| Total votes | 37,064 | 100.0 | ||
| Voter turnout | % | |||
| Democratic hold | ||||
1912
| Party | Candidate | Votes | % | |
|---|---|---|---|---|
| Independent | William Kent (incumbent) | 20,341 | 37.3 | |
| Democratic | I. G. Zumwalt | 18,756 | 34.4 | |
| Republican | Edward H. Hart | 10,585 | 19.4 | |
| Socialist | Joseph Bredsteen | 4,892 | 9.0 | |
| Total votes | 54,574 | 100.0 | ||
| Voter turnout | % | |||
| Independent hold | ||||
1914
| Party | Candidate | Votes | % | |
|---|---|---|---|---|
| Independent | William Kent (incumbent) | 35,403 | 48.1 | |
| Republican | Edward H. Hart | 28,166 | 38.3 | |
| Democratic | O. F. Meldon | 7,987 | 10.8 | |
| Prohibition | Henry P. Stipp | 2,068 | 2.8 | |
| Total votes | 73,624 | 100.0 | ||
| Voter turnout | % | |||
| Independent hold | ||||
1916
| Party | Candidate | Votes | % | |||
|---|---|---|---|---|---|---|
| Democratic | Clarence F. Lea | 32,797 | 48.8 | |||
| Republican | Edward H. Hart | 28,769 | 42.8 | |||
| Socialist | Mary M. Morgan | 3,730 | 5.5 | |||
| Prohibition | Jay Scott Ryder | 1,935 | 2.9 | |||
| Total votes | 67,231 | 100.0 | ||||
| Voter turnout | % | |||||
| Democratic gain from Independent | ||||||
1918
| Party | Candidate | Votes | % | |
|---|---|---|---|---|
| Democratic | Clarence F. Lea (incumbent) | 42,063 | 100.0 | |
| Voter turnout | % | |||
| Democratic hold | ||||
1920
| Party | Candidate | Votes | % | |
|---|---|---|---|---|
| Democratic | Clarence F. Lea (incumbent) | 34,427 | 61.7 | |
| Republican | C. A. Bodwell, Jr. | 18,569 | 33.3 | |
| Socialist | A. K. Gifford | 2,773 | 5.0 | |
| Total votes | 55,769 | 100.0 | ||
| Voter turnout | % | |||
| Democratic hold | ||||
1922
| Party | Candidate | Votes | % | |
|---|---|---|---|---|
| Democratic | Clarence F. Lea (incumbent) | 53,129 | 100.0 | |
| Voter turnout | % | |||
| Democratic hold | ||||
1924
| Party | Candidate | Votes | % | |
|---|---|---|---|---|
| Democratic | Clarence F. Lea (incumbent) | 47,250 | 100.0 | |
| Voter turnout | % | |||
| Democratic hold | ||||
1926
| Party | Candidate | Votes | % | |
|---|---|---|---|---|
| Democratic | Clarence F. Lea (incumbent) | 60,207 | 100.0 | |
| Voter turnout | % | |||
| Democratic hold | ||||
1928
| Party | Candidate | Votes | % | |
|---|---|---|---|---|
| Democratic | Clarence F. Lea (incumbent) | 56,381 | 100.0 | |
| Voter turnout | % | |||
| Democratic hold | ||||
1930
| Party | Candidate | Votes | % | |
|---|---|---|---|---|
| Democratic | Clarence F. Lea (incumbent) | 66,703 | 100.0 | |
| Voter turnout | % | |||
| Democratic hold | ||||
1932
| Party | Candidate | Votes | % | |
|---|---|---|---|---|
| Democratic | Clarence F. Lea (incumbent) | 73,400 | 100.0 | |
| Voter turnout | % | |||
| Democratic hold | ||||
1934
| Party | Candidate | Votes | % | |
|---|---|---|---|---|
| Democratic | Clarence F. Lea (incumbent) | 98,661 | 93.6 | |
| Socialist | Allen K. Gifford | 6,698 | 6.4 | |
| Total votes | 105,359 | 100.0 | ||
| Voter turnout | % | |||
| Democratic hold | ||||
1936
| Party | Candidate | Votes | % | |
|---|---|---|---|---|
| Democratic | Clarence F. Lea (incumbent) | 58,073 | 53.8 | |
| Republican | Nelson B. Van Matre | 48,647 | 45.1 | |
| Communist | Vernon Dennis Healy | 1,218 | 1.1 | |
| Total votes | 107,938 | 100.0 | ||
| Voter turnout | % | |||
| Democratic hold | ||||
1938
| Party | Candidate | Votes | % | |
|---|---|---|---|---|
| Democratic | Clarence F. Lea (incumbent) | 73,636 | 63 | |
| Townsend | Ernest S. Mitchell | 43,320 | 37 | |
| Total votes | 116,956 | 100 | ||
| Voter turnout | % | |||
| Democratic hold | ||||
1940
| Party | Candidate | Votes | % | |
|---|---|---|---|---|
| Democratic | Clarence F. Lea (incumbent) | 103,547 | 93.3 | |
| Communist | Albert J. Lima | 5,647 | 5.1 | |
| Independent | Ernest S. Mitchell (write-in) | 1,828 | 1.6 | |
| Total votes | 111,022 | 100.0 | ||
| Voter turnout | % | |||
| Democratic hold | ||||
1942
| Party | Candidate | Votes | % | |
|---|---|---|---|---|
| Democratic | Clarence F. Lea (incumbent) | 78,281 | 93.2 | |
| Communist | Albert J. Lima | 5,703 | 6.8 | |
| Total votes | 83,984 | 100.0 | ||
| Voter turnout | % | |||
| Democratic hold | ||||
1944
| Party | Candidate | Votes | % | |
|---|---|---|---|---|
| Democratic | Clarence F. Lea (incumbent) | 92,706 | 100.0 | |
| Voter turnout | % | |||
| Democratic hold | ||||
1946
| Party | Candidate | Votes | % | |
|---|---|---|---|---|
| Democratic | Clarence F. Lea (incumbent) | 77,653 | 100.0 | |
| Voter turnout | % | |||
| Democratic hold | ||||
1948
| Party | Candidate | Votes | % | |||
|---|---|---|---|---|---|---|
| Republican | Hubert B. Scudder | 82,947 | 54.5 | |||
| Democratic | Sterling J. Norgard | 68,951 | 45.3 | |||
| Progressive | Roger Kent (write-in) | 304 | 0.2 | |||
| Total votes | 152,302 | 100.0 | ||||
| Voter turnout | % | |||||
| Republican gain from Democratic | ||||||
1950
| Party | Candidate | Votes | % | |
|---|---|---|---|---|
| Republican | Hubert B. Scudder (inc.) | 85,122 | 54.0 | |
| Democratic | Roger Kent | 72,584 | 46.0 | |
| Total votes | 157,706 | 100.0 | ||
| Voter turnout | % | |||
| Republican hold | ||||
1952
| Party | Candidate | Votes | % | |
|---|---|---|---|---|
| Republican | Hubert B. Scudder (inc.) | 137,801 | 86.4 | |
| Progressive | Carl Sullivan | 21,734 | 13.6 | |
| Total votes | 159,535 | 100.0 | ||
| Voter turnout | % | |||
| Republican hold | ||||
1954
| Party | Candidate | Votes | % | |
|---|---|---|---|---|
| Republican | Hubert B. Scudder (inc.) | 83,762 | 59.1 | |
| Democratic | Max Kortum | 58,004 | 40.9 | |
| Total votes | 141,766 | 100.0 | ||
| Voter turnout | % | |||
| Republican hold | ||||
1956
| Party | Candidate | Votes | % | |
|---|---|---|---|---|
| Republican | Hubert B. Scudder (inc.) | 102,604 | 53.6 | |
| Democratic | Clement Woodnutt Miller | 88,962 | 46.4 | |
| Total votes | 191,566 | 100.0 | ||
| Voter turnout | % | |||
| Republican hold | ||||
1958
| Party | Candidate | Votes | % | |||
|---|---|---|---|---|---|---|
| Democratic | Clement Woodnutt Miller | 102,096 | 54.9 | |||
| Republican | Frederick G. Dupuis | 84,807 | 45.1 | |||
| Total votes | 185,903 | 100.0 | ||||
| Voter turnout | % | |||||
| Democratic gain from Republican | ||||||
1960
| Party | Candidate | Votes | % | |
|---|---|---|---|---|
| Democratic | Clement Woodnutt Miller (inc.) | 115,829 | 51.6 | |
| Republican | Frederick G. Dupuis | 108,505 | 48.4 | |
| Total votes | 224,334 | 100.0 | ||
| Voter turnout | % | |||
| Democratic hold | ||||
1962
| Party | Candidate | Votes | % | |
|---|---|---|---|---|
| Democratic | Clement Woodnutt Miller (inc.) | 100,962 | 50.8 | |
| Republican | Donald H. Clausen | 97,949 | 49.2 | |
| Total votes | 198,911 | 100.0 | ||
| Voter turnout | % | |||
| Democratic hold | ||||
1963 (Special)
| Party | Candidate | Votes | % | |||
|---|---|---|---|---|---|---|
| Republican | Don H. Clausen | ' | 54.2 | |||
| Democratic | William F. Grader | 44.7 | ||||
| Democratic | John C. Stuart (write-in) | 1.1 | ||||
| Total votes | ' | 100.0 | ||||
| Voter turnout | % | |||||
| Republican gain from Democratic | ||||||
1964
| Party | Candidate | Votes | % | |
|---|---|---|---|---|
| Republican | Donald H. Clausen (inc.) | 141,048 | 59.1 | |
| Democratic | George McCabe | 97,651 | 40.9 | |
| Total votes | 238,699 | 100.0 | ||
| Voter turnout | % | |||
| Republican hold | ||||
1966
| Party | Candidate | Votes | % | |
|---|---|---|---|---|
| Republican | Donald H. Clausen (inc.) | 143,755 | 65.1 | |
| Democratic | Thomas T. Storer | 77,000 | 34.9 | |
| Total votes | 220,755 | 100.0 | ||
| Voter turnout | % | |||
| Republican hold | ||||
1968
| Party | Candidate | Votes | % | |
|---|---|---|---|---|
| Republican | Donald H. Clausen (inc.) | 132,433 | 75.1 | |
| Democratic | Donald W. Graham | 37,650 | 21.4 | |
| Peace and Freedom | Adolph N. Hofmann | 3,372 | 1.9 | |
| American Independent | Gladys O'Neil | 2,882 | 1.6 | |
| Total votes | 176,337 | 100.0 | ||
| Voter turnout | % | |||
| Republican hold | ||||
1970
| Party | Candidate | Votes | % | |
|---|---|---|---|---|
| Republican | Donald H. Clausen (inc.) | 108,358 | 63.5 | |
| Democratic | William Kortum | 62,688 | 36.5 | |
| Total votes | 171,046 | 100.0 | ||
| Voter turnout | % | |||
| Republican hold | ||||
1972
| Party | Candidate | Votes | % | |
|---|---|---|---|---|
| Republican | Donald H. Clausen (inc.) | 140,807 | 62.2 | |
| Democratic | William A. Nighswonger | 77,138 | 34.1 | |
| Peace and Freedom | Jonathan T. Ames | 8,470 | 3.7 | |
| Total votes | 226,145 | 100.0 | ||
| Voter turnout | % | |||
| Republican hold | ||||
1974
| Party | Candidate | Votes | % | |
|---|---|---|---|---|
| Democratic | Harold T. Johnson (inc.) | 137,849 | 85.8 | |
| American Independent | Dorothy D. Paradis | 22,628 | 14.2 | |
| Total votes | 160,477 | 100.0 | ||
| Voter turnout | % | |||
| Democratic hold | ||||
1976
| Party | Candidate | Votes | % | |
|---|---|---|---|---|
| Democratic | Harold T. Johnson (inc.) | 160,477 | 73.9 | |
| Republican | James E. Taylor | 56,539 | 26.1 | |
| Total votes | 217,016 | 100.0 | ||
| Voter turnout | % | |||
| Democratic hold | ||||
1978
| Party | Candidate | Votes | % | |
|---|---|---|---|---|
| Democratic | Harold T. Johnson (inc.) | 125,122 | 59.4 | |
| Republican | James E. Taylor | 85,690 | 40.6 | |
| Total votes | 210,812 | 100.0 | ||
| Voter turnout | % | |||
| Democratic hold | ||||
1980
| Party | Candidate | Votes | % | |
|---|---|---|---|---|
| Republican | Eugene A. Chappie | 145,098 | 53.7 | |
| Democratic | Harold T. Johnson (incumbent) | 107,682 | 39.8 | |
| Libertarian | Jim McClarin | 17,419 | 6.5 | |
| Total votes | 270,199 | 100.0 | ||
| Voter turnout | % | |||
| Republican hold | ||||
1982
| Party | Candidate | Votes | % | |
|---|---|---|---|---|
| Democratic | Douglas H. Bosco | 107,749 | 49.8 | |
| Republican | Donald H. Clausen (inc.) | 102,043 | 47.2 | |
| Libertarian | David Redick | 6,374 | 2.9 | |
| Total votes | 216,166 | 100.0 | ||
| Voter turnout | % | |||
| Democratic hold | ||||
1984
| Party | Candidate | Votes | % | |
|---|---|---|---|---|
| Democratic | Douglas H. Bosco (incumbent) | 157,037 | 62.3 | |
| Republican | Floyd G. Sampson | 95,186 | 37.7 | |
| Total votes | 252,223 | 100.0 | ||
| Voter turnout | % | |||
| Democratic hold | ||||
1986
| Party | Candidate | Votes | % | |
|---|---|---|---|---|
| Democratic | Douglas H. Bosco (incumbent) | 138,174 | 67.5 | |
| Republican | Floyd G. Sampson | 54,436 | 26.6 | |
| Peace and Freedom | Elden McFarland | 12,149 | 5.9 | |
| Total votes | 204,759 | 100.0 | ||
| Voter turnout | % | |||
| Democratic hold | ||||
1988
| Party | Candidate | Votes | % | |
|---|---|---|---|---|
| Democratic | Douglas H. Bosco (incumbent) | 159,815 | 62.9 | |
| Republican | Samuel "Mark" Vanderbilt | 72,189 | 28.4 | |
| Peace and Freedom | Eric Fried | 22,150 | 8.7 | |
| Total votes | 254,154 | 100.0 | ||
| Voter turnout | % | |||
| Democratic hold | ||||
1990
| Party | Candidate | Votes | % | |||
|---|---|---|---|---|---|---|
| Republican | Frank Riggs | 99,782 | 43.3 | |||
| Democratic | Douglas H. Bosco (incumbent) | 96,468 | 41.9 | |||
| Peace and Freedom | Darlene G. Comingore | 34,011 | 14.8 | |||
| Total votes | 230,261 | 100.0 | ||||
| Voter turnout | % | |||||
| Republican gain from Democratic | ||||||
1992
| Party | Candidate | Votes | % | |||
|---|---|---|---|---|---|---|
| Democratic | Dan Hamburg | 119,676 | 47.6 | |||
| Republican | Frank Riggs (incumbent) | 113,266 | 45.1 | |||
| Peace and Freedom | Phil Baldwin | 10,764 | 4.3 | |||
| Libertarian | Matthew L. Howard | 7,500 | 3.0 | |||
| Total votes | 251,206 | 100.0 | ||||
| Voter turnout | % | |||||
| Democratic gain from Republican | ||||||
1994
| Party | Candidate | Votes | % | |||
|---|---|---|---|---|---|---|
| Republican | Frank Riggs | 106,870 | 53.3 | |||
| Democratic | Dan Hamburg (incumbent) | 93,717 | 46.7 | |||
| No party | Chase (write-in) | 86 | 0.0% | |||
| Total votes | 200,673 | 100.0 | ||||
| Voter turnout | % | |||||
| Republican gain from Democratic | ||||||
1996
| Party | Candidate | Votes | % | |
|---|---|---|---|---|
| Republican | Frank Riggs (incumbent) | 110,242 | 49.7 | |
| Democratic | Michela Alioto | 96,522 | 43.4 | |
| Libertarian | Emil Rossi | 15,354 | 6.9 | |
| Total votes | 222,118 | 100.0 | ||
| Voter turnout | % | |||
| Republican hold | ||||
1998
| Party | Candidate | Votes | % | |||
|---|---|---|---|---|---|---|
| Democratic | Mike Thompson | 121,713 | 61.9 | |||
| Republican | Mark Luce | 64,622 | 32.8 | |||
| Libertarian | Emil Rossi | 5,404 | 2.8 | |||
| Peace and Freedom | Ernest K. Jones, Jr. | 4,996 | 2.5 | |||
| Republican | Lawrence R. Weisner (write-in) | 37 | 0.0 | |||
| Total votes | 196,772 | 100.0 | ||||
| Voter turnout | % | |||||
| Democratic gain from Republican | ||||||
2000
| Party | Candidate | Votes | % | |
|---|---|---|---|---|
| Democratic | Mike Thompson (incumbent) | 155,638 | 65.1 | |
| Republican | Russel J. "Jim" Chase | 66,987 | 28.0 | |
| Natural Law | Cheryl Kreier | 7,173 | 3.0 | |
| Libertarian | Emil P. Rossi | 6,376 | 2.6 | |
| Reform | Pamela Elizondo | 3,161 | 1.3 | |
| Total votes | 239,335 | 100.0 | ||
| Voter turnout | % | |||
| Democratic hold | ||||
2002
| Party | Candidate | Votes | % | |
|---|---|---|---|---|
| Democratic | Mike Thompson (incumbent) | 118,669 | 64.1 | |
| Republican | Lawrence R. Wiesner | 60,013 | 32.4 | |
| Libertarian | Kevin Bastian | 6,534 | 3.5 | |
| Total votes | 185,216 | 100.0 | ||
| Voter turnout | % | |||
| Democratic hold | ||||
2004
| Party | Candidate | Votes | % | |
|---|---|---|---|---|
| Democratic | Mike Thompson (incumbent) | 189,336 | 67.0 | |
| Republican | Lawrence R. Wiesner | 79,970 | 28.2 | |
| Green | Pamela Elizondo | 13,635 | 4.8 | |
| Total votes | 282,941 | 100.0 | ||
| Voter turnout | % | |||
| Democratic hold | ||||
2006
| Party | Candidate | Votes | % | |
|---|---|---|---|---|
| Democratic | Mike Thompson (incumbent) | 144,409 | 66.3 | |
| Republican | John W. Jones | 63,194 | 29.0 | |
| Green | Pamela Elizondo | 6,899 | 3.1 | |
| Peace and Freedom | Timothy J. Stock | 3,503 | 1.6 | |
| Total votes | 218,044 | 100.0 | ||
| Voter turnout | % | |||
| Democratic hold | ||||
2008
| Party | Candidate | Votes | % | |
|---|---|---|---|---|
| Democratic | Mike Thompson (incumbent) | 154,006 | 68.2 | |
| Republican | Zane Starkewolf | 53,561 | 23.7 | |
| Green | Carol Wolman | 18,492 | 8.1 | |
| Total votes | 226,059 | 100.00 | ||
| Voter turnout | % | |||
| Democratic hold | ||||
2010
| Party | Candidate | Votes | % | |
|---|---|---|---|---|
| Democratic | Mike Thompson (incumbent) | 136,605 | 63% | |
| Republican | Loren Hanks | 67,217 | 31% | |
| Green | Carol Wolman | 7,576 | 3% | |
| Libertarian | Mike Rodrigues | 5,484 | 3% | |
| Total votes | 216,882 | 100% | ||
| Voter turnout | % | |||
| Democratic hold | ||||
2012
| Party | Candidate | Votes | % | |
|---|---|---|---|---|
| Republican | Doug LaMalfa | 168,827 | 57% | |
| Democratic | Jim Reed | 125,386 | 43% | |
| Total votes | 294,213 | 100% | ||
| Voter turnout | % | |||
| Republican hold | ||||
2014
| Party | Candidate | Votes | % | |
|---|---|---|---|---|
| Republican | Doug LaMalfa | 132,052 | 61% | |
| Democratic | Heidi Hall | 84,320 | 39% | |
| Total votes | 216,372 | 100% | ||
| Voter turnout | % | |||
| Republican hold | ||||
Living former Members
As of April 2015, there are four former members of the U.S. House of Representatives from California's 1st congressional district that are currently living.
| Representative | Term in office | Date of birth (and age) |
|---|---|---|
| Douglas H. Bosco | 1983 - 1991 | July 28, 1946 |
| Frank Riggs | 1991 - 1993 1995 - 1999 |
September 5, 1950 |
| Daniel Hamburg | 1993 - 1995 | October 6, 1948 |
| Mike Thompson | 1999 - 2013 | January 24, 1951 |
See also
References
- ↑ "California election results - 2012 election". Los Angeles Times. November 6, 2012. Retrieved February 24, 2013.
- ↑ "Maps: Final Congressional Districts". Citizens Redistricting Commission. Retrieved February 24, 2013.
- ↑ Statement of Vote (2000 President)
- ↑ Statement of Vote (2000 Senator)
- ↑ Statement of Vote (2002 Governor)
- ↑ Statement of Vote (2003 Recall Question)
- ↑ Statement of Vote (2003 Governor)
- ↑ Statement of Vote (2004 President)
- ↑ Statement of Vote (2004 Senator)
- ↑ Statement of Vote (2006 Senator)
- ↑ California Secretary of State. Supplement to the Statement of Vote. President. Counties by Congressional District.
- ↑ Statement of Vote (2010 Governor
- ↑ Statement of Vote (2010 Governor)
- ↑ http://www.joincalifornia.com/candidate/7102
- ↑ http://www.joincalifornia.com/candidate/7304
- ↑ http://www.joincalifornia.com/candidate/6613
- ↑ 1920 general election results
- ↑ 1922 general election results
- ↑ 1924 general election results
- ↑ 1926 general election results
- ↑ 1928 general election results
- ↑ 1930 general election results
- ↑ 1932 general election results
- ↑ 1934 general election results
- ↑ 1936 general election results
- ↑ 1938 general election results
- ↑ 1940 general election results
- ↑ 1942 general election results
- ↑ 1944 general election results
- ↑ 1946 general election results
- ↑ 1948 general election results
- ↑ 1950 general election results
- ↑ 1952 general election results
- ↑ 1954 general election results
- ↑ 1956 general election results
- ↑ 1958 general election results
- ↑ 1960 general election results
- ↑ 1962 general election results
- ↑ 1963 special election results
- ↑ 1964 general election results
- ↑ 1966 general election results
- ↑ 1968 general election results
- ↑ 1970 general election results
- ↑ 1972 general election results
- ↑ 1974 general election results
- ↑ 1976 general election results
- ↑ 1978 general election results
- ↑ 1980 general election results
- ↑ 1982 general election results
- ↑ 1984 general election results
- ↑ 1986 general election results
- ↑ 1988 general election results
- ↑ 1990 general election results
- ↑ 1992 general election results
- ↑ 1994 general election results
- ↑ 1996 general election results
- ↑ 1998 general election results
- ↑ 2000 general election results
- ↑ 2002 general election results Archived February 3, 2009, at the Wayback Machine.
- ↑ 2004 general election results
- ↑ 2006 general election results Archived November 27, 2008, at the Wayback Machine.
- ↑ 2008 general election results
- ↑ 2010 general election results - United States Representative
- ↑ 2012 general election results - United States Representative
External links
- GovTrack.us: California's 1st congressional district
- RAND California Election Returns: District Definitions (out of date)
- California Voter Foundation map - CD01 (out of date)
Coordinates: 40°42′N 121°24′W / 40.7°N 121.4°W