United States House of Representatives elections, 1876
| | |||||||||||||||||||||||||||||||||||
| |||||||||||||||||||||||||||||||||||
| |||||||||||||||||||||||||||||||||||
| |||||||||||||||||||||||||||||||||||

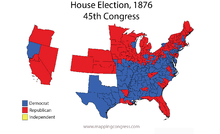
Elections to the United States House of Representatives were held in 1876 (with one state in 1877) for Representatives to the 45th Congress. These elections coincided with the (heavily contested) election of President Rutherford B. Hayes and the United States Centennial.
Hayes' Republican Party was able to recover from the Democratic Party many of the seats it had lost two years before as the economy improved slightly. However, the Democrats retained a majority and were able to use the disinterest of the people in Republican Reconstruction-led projects to help keep crucial seats. Republican Congressional leadership had a difficult time distancing itself from the corruption of the Grant administration or the legislature's impact on the economy downturn.
Election summaries
| 157 | 136 |
| Democratic | Republican |
| State | Type | Total seats |
Democratic | Republican | ||
|---|---|---|---|---|---|---|
| Seats | Change | Seats | Change | |||
| Alabama | District[Note 6] | 8 | 8 | |
0 | |
| Arkansas | District | 4 | 4[Note 7] | |
0 | |
| California | District | 4 | 2 | |
2 | |
| Colorado | At-large | 1 | 1 | |
0 | |
| Connecticut | District | 4 | 3 | |
1 | |
| Delaware | At-large | 1 | 1 | |
0 | |
| Florida | District | 2 | 2 | |
0 | |
| Georgia[Note 8] | District | 9 | 9[Note 7] | |
0 | |
| Illinois | District | 19 | 8 | |
11 | |
| Indiana[Note 8] | District | 13 | 4 | |
9 | |
| Iowa[Note 8] | District | 9 | 0 | |
9 | |
| Kansas | District | 3 | 0 | |
3 | |
| Kentucky | District | 10 | 10 | |
0 | |
| Louisiana | District | 6 | 5 | |
1 | |
| Maine[Note 8] | District | 5 | 0 | |
5 | |
| Maryland | District | 6 | 6 | |
0 | |
| Massachusetts | District | 11 | 2 | |
9 | |
| Michigan | District | 9 | 1 | |
8 | |
| Minnesota | District | 3 | 0 | |
3 | |
| Mississippi | District | 6 | 6 | |
0 | |
| Missouri | District | 13 | 9 | |
4 | |
| Nebraska | At-large | 1 | 0 | |
1 | |
| Nevada | At-large | 1 | 0 | |
1 | |
| New Hampshire[Note 9] | District | 3 | 1 | |
2 | |
| New Jersey | District | 7 | 4 | |
3 | |
| New York | District | 33 | 16 | |
17 | |
| North Carolina | District | 8 | 7 | |
1 | |
| Ohio[Note 8] | District | 20 | 8 | |
12 | |
| Oregon[Note 8] | At-large | 1 | 0 | |
1 | |
| Pennsylvania | District | 27 | 10 | |
17 | |
| Rhode Island | District | 2 | 0 | |
2 | |
| South Carolina | District | 5 | 2 | |
3 | |
| Tennessee | District | 10 | 8 | |
2 | |
| Texas | District | 6 | 6 | |
0 | |
| Vermont[Note 8] | District | 3 | 0 | |
3 | |
| Virginia | District | 9 | 8 | |
1 | |
| West Virginia[Note 8] | District | 3 | 3 | |
0 | |
| Wisconsin | District | 8 | 3 | |
5 | |
| Total | 293 | 157[1][Note 4] 53.6% |
|
136[1] 46.4% |
| |
The previous election included 4 Independents, in Illinois and Massachusetts.
[[File:45 us house membership.png|thumb|left|350px|
]] |
[[File:45 us house changes.png|thumb|right|350px|
]] | |||||||||||||||||||
Election dates
In 1845, Congress passed a law providing for a uniform nationwide date for choosing Presidential electors.[2] This law did not affect election dates for Congress, which remained within the jurisdiction of State governments, but over time, the States moved their Congressional elections to this date as well. In 1876–77, there were still 8 states with earlier election dates, and 1 state with a later election date.
- Early elections (1876):
- Late election (1877):
- March 13, 1877 New Hampshire
All races
California
| District | Incumbent | Party | First elected |
Result | Candidates |
|---|---|---|---|---|---|
| California 1 | William Adam Piper | Democratic | |
Lost re-election Republican gain |
Horace Davis (R) 53.3% William A. Piper (D) 46.7% |
| California 2 | Horace F. Page | Republican | |
Incumbent re-elected | Horace F. Page (R) 56.7% G. J. Carpenter (D) 43.3% |
| California 3 | John K. Luttrell | Democratic | |
Incumbent re-elected | John K. Luttrell (D) 51.1% Joseph McKenna (R) 48.9% |
| California 4 | Peter D. Wigginton | Democratic | |
Lost re-election Republican gain |
Romualdo Pacheco (R) 50% Peter D. Wigginton (D) 50% |
Florida
| District | Incumbent | Party | First elected |
Result | Candidates |
|---|---|---|---|---|---|
| Florida 1 | William J. Purman | Republican | 1872 | Lost re-election Democratic gain |
Robert H. M. Davidson (D) 51.2% William J. Purman (R) 48.8% |
| Florida 2 | Jesse J. Finley | Democratic | 1874[Note 10] | Lost re-election Republican gain |
Horatio Bisbee, Jr. (R) 50.0% Jesse J. Finley (D) 50.0% |
The election in the 2nd district was extremely close, with initial returns showing a difference between the two candidates of only 3 votes. Finley challenged Bisbee's election and was eventually seated on February 20, 1879
South Carolina
| District | Incumbent | Party | First elected |
Result | Candidates |
|---|---|---|---|---|---|
| South Carolina 1 | Joseph Rainey | Republican | 1870 (special) | Re-elected | Joseph Rainey (R) 52.2% John S. Richardson (D) 47.8% |
| South Carolina 2 | Seat declared vacant by Congress on July 19, 1876 due to contested election of previous incumbent Edmund W. M. Mackey (IR) | Republican hold | Richard H. Cain (R) 62.1% Michael P. O'Connor (D) 37.9% | ||
| South Carolina 3 | Solomon L. Hoge | Republican | 1874 | Retired Democratic gain |
D. Wyatt Aiken (D) 58.0% Lewis C. Carpenter (R) 42.0% |
| South Carolina 4 | Alexander S. Wallace | Republican | 1868 | Lost re-election Democratic gain |
John H. Evins (D) 57.6% Alexander S. Wallace (R) 42.4% |
| South Carolina 5 | Robert Smalls | Republican | 1874 | Re-elected | Robert Smalls (R) 51.9% George D. Tillman (D) 48.1% |
See also
Notes
- ↑ The majority of states held their elections on this date. Nine states held elections on different dates between June 5, 1876 and March 13, 1877.
- ↑ Included 1 Independent Democrat.
- ↑ Included 3 Independent Republicans.
- 1 2 Includes 2 Independent Democrats, Jordan E. Cravens of AR-03, and Alexander H. Stephens of GA-07.
- 1 2 There is a significant discrepancy for the party totals in the U.S House resulting from the 1874 elections between Dubin (p. 241, who records 150 Democrats, 2 Independent Democrats, and 141 Republicans), and Martis (pp. 130–131). The discrepancy seems to be accounted for by the fact that Dubin's party figures represent the party totals on the first day of the 45th United States Congress, while Martis' figures take into account the results of later contested elections (all of which were decided in favor of the Democratic candidates who challenged the election results).
- ↑ At-large seats eliminated in redistricting.
- 1 2 Includes 1 Independent Democrat.
- 1 2 3 4 5 6 7 8 Elections held early
- ↑ Elections held late
- ↑ After disputed election
References
Bibliography
- Dubin, Michael J. (March 1, 1998). United States Congressional Elections, 1788-1997: The Official Results of the Elections of the 1st Through 105th Congresses. McFarland and Company. ISBN 978-0786402830.
- Martis, Kenneth C. (January 1, 1989). The Historical Atlas of Political Parties in the United States Congress, 1789-1989. Macmillan Publishing Company. ISBN 978-0029201701.
- Moore, John L., ed. (1994). Congressional Quarterly's Guide to U.S. Elections (Third ed.). Congressional Quarterly Inc. ISBN 978-0871879967.
- "Party Divisions of the House of Representatives* 1789–Present". Office of the Historian, House of United States House of Representatives. Retrieved January 21, 2015.
External links
- Office of the Historian (Office of Art & Archives, Office of the Clerk, U.S. House of Representatives)