California Insurance Commissioner election, 2002
California Insurance Commissioner election, 2002

|
|
|
|
|
|
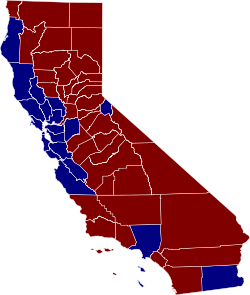
| Election results by county |
|
|
The 2002 California Insurance Commissioner election occurred on November 5, 2002. The primary elections took place on March 5, 2002. Former Deputy Secretary of the Interior John Garamendi, the Democratic nominee, defeated Corporations Commissioner Gary Mendoza, the Republican nominee, for the office previously held by Harry W. Low.
Primary Results
A bar graph of statewide results in this contest are available at http://primary2002.ss.ca.gov/Returns/ins/00.htm.
Results by county are available here and here.
Democratic
California Insurance Commissioner Democratic primary, 2002
| Candidate |
Votes |
Percentage |
| John Garamendi |
800,146 |
38.55% |
| Tom Umberg |
586,112 |
28.24% |
| Tom Calderon |
476,234 |
22.94% |
| Bill Winslow |
213,239 |
10.27% |
| Total votes |
2,075,731 |
100.00% |
Republican
California Insurance Commissioner Republican primary, 2002
| Candidate |
Votes |
Percentage |
| Gary Mendoza |
808,007 |
41.74% |
| Stefan "Watchdog" Stitch |
704,392 |
36.39% |
| Wes Bannister |
423,273 |
21.87% |
| Total votes |
1,935,672 |
100.00% |
Other Parties
California Attorney General primary, 2002 (Others)
| Party |
Candidate |
Votes |
% |
|
Green |
David I. Sheidlower |
34,784 |
100.00 |
|
American Independent |
Steve Klein |
27,113 |
100.00 |
|
Libertarian |
Dale F. Ogden |
19,213 |
100.00 |
|
Natural Law |
Raul Calderon, Jr. |
5,044 |
100.00 |
Results
California Insurance Commissioner election, 2002[1][2]
| Party |
Candidate |
Votes |
% |
|
Democratic |
John Garamendi |
3,346,937 |
46.48 |
|
Republican |
Gary Mendoza |
2,998,243 |
41.64 |
|
Green |
David I. Sheidlower |
277,667 |
3.86 |
|
Libertarian |
Dale F. Ogden |
236,688 |
3.29 |
|
Natural Law |
Raul Calderon, Jr. |
192,001 |
2.67 |
|
American Independent |
Steve Klein |
148,893 |
2.07 |
| Invalid or blank votes |
538,392 |
6.96 |
| Total votes |
7,200,429 |
100.00 |
| Voter turnout |
36.05% |
|
Democratic hold |
Results by county
Results from the Secretary of State of California:[1]
| County |
Garamendi |
Votes |
Mendoza |
Votes |
Sheidlower |
Votes |
Ogden |
Votes |
Calderon |
Votes |
Klein |
Votes |
| San Francisco |
70.15% |
137,602 |
15.26% |
29,931 |
7.78% |
15,261 |
3.23% |
6,342 |
2.16% |
4,231 |
1.42% |
2,777 |
| Alameda |
64.79% |
214,588 |
21.93% |
72,635 |
7.28% |
24,111 |
2.75% |
9,109 |
1.99% |
6,606 |
1.26% |
4,169 |
| Marin |
60.31% |
51,967 |
27.33% |
23,551 |
7.64% |
6,587 |
2.63% |
2,265 |
1.16% |
'996 |
0.93% |
'799 |
| San Mateo |
58.90% |
97,857 |
29.56% |
49,102 |
4.54% |
7,550 |
3.02% |
5,012 |
2.44% |
4,058 |
1.54% |
2,555 |
| Santa Cruz |
55.31% |
41,663 |
26.17% |
19,709 |
10.60% |
7,981 |
3.64% |
2,744 |
2.68% |
2,015 |
1.61% |
1,210 |
| Contra Costa |
55.05% |
141,101 |
34.45% |
88,318 |
3.64% |
9,318 |
3.03% |
7,771 |
2.00% |
5,133 |
1.83% |
4,689 |
| Sonoma |
54.01% |
76,818 |
30.16% |
42,896 |
8.75% |
12,450 |
3.30% |
4,699 |
2.09% |
2,966 |
1.69% |
2,400 |
| Los Angeles |
53.87% |
871,779 |
33.70% |
545,306 |
3.39% |
54,880 |
3.33% |
53,894 |
3.58% |
57,993 |
2.12% |
34,301 |
| Solano |
53.30% |
46,090 |
36.77% |
31,795 |
2.95% |
2,555 |
2.73% |
2,365 |
2.13% |
1,840 |
2.12% |
1,829 |
| Santa Clara |
52.64% |
179,291 |
35.02% |
119,261 |
4.20% |
14,308 |
3.85% |
13,125 |
2.56% |
8,731 |
1.72% |
5,874 |
| Napa |
51.96% |
18,738 |
35.94% |
12,959 |
5.34% |
1,924 |
2.78% |
1,001 |
2.27% |
'818 |
1.72% |
'619 |
| Monterey |
51.20% |
43,418 |
35.66% |
30,243 |
3.64% |
3,087 |
3.38% |
2,865 |
3.81% |
3,230 |
2.31% |
1,961 |
| Yolo |
49.52% |
22,585 |
36.87% |
16,817 |
7.23% |
3,297 |
2.15% |
'979 |
2.66% |
1,212 |
1.57% |
'718 |
| Lake |
49.11% |
7,734 |
39.78% |
6,265 |
4.92% |
'775 |
2.77% |
'436 |
1.57% |
'247 |
1.85% |
'292 |
| San Benito |
48.59% |
5,894 |
39.31% |
4,769 |
2.79% |
'338 |
3.02% |
'366 |
4.47% |
'542 |
1.83% |
'222 |
| Mendocino |
48.49% |
11,746 |
31.23% |
7,566 |
13.56% |
3,284 |
3.03% |
'735 |
1.77% |
'428 |
1.93% |
'467 |
| Alpine |
47.22% |
'255 |
37.41% |
'202 |
5.37% |
'29 |
3.70% |
'20 |
3.89% |
'21 |
2.41% |
'13 |
| Imperial |
47.15% |
10,085 |
39.33% |
8,412 |
1.48% |
'317 |
2.41% |
'515 |
7.48% |
1,600 |
2.15% |
'459 |
| San Joaquin |
46.46% |
57,005 |
44.94% |
55,139 |
2.04% |
2,505 |
2.10% |
2,583 |
2.51% |
3,080 |
1.95% |
2,396 |
| Humboldt |
44.86% |
18,484 |
35.14% |
14,479 |
13.18% |
5,432 |
4.04% |
1,666 |
1.90% |
'783 |
0.88% |
'364 |
| Merced |
43.52% |
17,284 |
47.00% |
18,666 |
1.80% |
'716 |
2.48% |
'983 |
3.39% |
1,346 |
1.81% |
'717 |
| Sacramento |
42.44% |
131,133 |
46.71% |
144,312 |
3.85% |
11,887 |
2.76% |
8,513 |
2.15% |
6,637 |
2.10% |
6,485 |
| Stanislaus |
42.30% |
40,205 |
49.67% |
47,214 |
2.02% |
1,924 |
1.96% |
1,866 |
2.27% |
2,157 |
1.77% |
1,684 |
| Del Norte |
42.10% |
2,787 |
45.50% |
3,012 |
3.87% |
'256 |
3.87% |
'256 |
2.05% |
'136 |
2.61% |
'173 |
| Tuolumne |
40.43% |
7,223 |
50.81% |
9,078 |
3.26% |
'582 |
2.40% |
'429 |
1.35% |
'242 |
1.74% |
'311 |
| Santa Barbara |
40.45% |
44,056 |
46.04% |
50,143 |
5.37% |
5,847 |
3.74% |
4,073 |
2.71% |
2,949 |
1.70% |
1,850 |
| Trinity |
40.42% |
1,908 |
44.46% |
2,099 |
5.57% |
'263 |
5.10% |
'241 |
2.03% |
'96 |
2.41% |
'114 |
| Ventura |
40.38% |
76,598 |
47.68% |
90,429 |
3.02% |
5,734 |
3.68% |
6,976 |
2.90% |
5,496 |
2.34% |
4,442 |
| Calaveras |
40.05% |
6,059 |
49.71% |
7,519 |
3.70% |
'560 |
3.06% |
'463 |
1.49% |
'226 |
1.98% |
'300 |
| Mono |
39.86% |
1,159 |
48.28% |
1,404 |
5.33% |
'155 |
2.92% |
'85 |
2.03% |
'59 |
1.58% |
'46 |
| San Bernardino |
39.56% |
107,649 |
48.60% |
132,269 |
2.34% |
6,366 |
3.49% |
9,508 |
3.27% |
8,891 |
2.74% |
7,452 |
| Amador |
39.13% |
5,054 |
51.12% |
6,603 |
2.87% |
'371 |
2.71% |
'350 |
1.83% |
'237 |
2.34% |
'302 |
| Riverside |
39.19% |
116,658 |
50.72% |
150,956 |
1.98% |
5,906 |
3.20% |
9,535 |
2.57% |
7,654 |
2.33% |
6,932 |
| Tehama |
38.07% |
5,774 |
51.43% |
7,800 |
2.12% |
'322 |
3.62% |
'549 |
1.72% |
'261 |
3.03% |
'459 |
| Kings |
37.57% |
7,891 |
53.31% |
11,195 |
1.59% |
'334 |
2.56% |
'537 |
3.04% |
'639 |
1.93% |
'405 |
| Siskiyou |
37.33% |
5,631 |
51.21% |
7,724 |
2.94% |
'443 |
4.73% |
'713 |
1.94% |
'293 |
1.86% |
'280 |
| San Luis Obispo |
36.32% |
28,697 |
50.42% |
39,837 |
5.31% |
4,192 |
3.95% |
3,125 |
1.99% |
1,575 |
2.01% |
1,591 |
| San Diego |
35.98% |
225,666 |
52.46% |
328,990 |
3.03% |
18,991 |
3.80% |
23,810 |
2.42% |
15,172 |
2.31% |
14,507 |
| Inyo |
35.70% |
2,191 |
53.09% |
3,258 |
3.18% |
'195 |
3.70% |
'227 |
1.76% |
'108 |
2.57% |
'158 |
| Kern |
35.41% |
47,632 |
54.35% |
73,106 |
1.56% |
2,104 |
2.97% |
3,996 |
2.52% |
3,393 |
3.19% |
4,287 |
| Shasta |
35.21% |
16,743 |
55.57% |
26,426 |
2.18% |
1,038 |
3.05% |
1,452 |
1.66% |
'789 |
2.33% |
1,110 |
| Butte |
35.23% |
21,119 |
50.79% |
30,445 |
6.86% |
4,113 |
2.81% |
1,685 |
1.82% |
1,089 |
2.49% |
1,492 |
| Plumas |
35.24% |
2,729 |
53.07% |
4,109 |
3.63% |
'281 |
3.65% |
'283 |
1.69% |
'131 |
2.71% |
'210 |
| Mariposa |
35.01% |
2,205 |
54.37% |
3,425 |
3.51% |
'221 |
3.08% |
'194 |
1.62% |
'102 |
2.41% |
'152 |
| Fresno |
34.97% |
52,946 |
55.03% |
83,308 |
2.16% |
3,263 |
3.23% |
4,896 |
2.56% |
3,874 |
2.05% |
3,099 |
| Lassen |
34.88% |
2,631 |
54.38% |
4,102 |
2.17% |
'164 |
4.02% |
'303 |
1.75% |
'132 |
2.80% |
'211 |
| Modoc |
34.61% |
1,136 |
55.48% |
1,821 |
1.98% |
'65 |
3.50% |
'115 |
1.52% |
'50 |
2.89% |
'95 |
| Colusa |
34.20% |
1,538 |
57.42% |
2,582 |
1.89% |
'85 |
2.00% |
'90 |
2.54% |
'114 |
1.96% |
'88 |
| Nevada |
34.11% |
13,106 |
52.23% |
20,071 |
7.18% |
2,758 |
2.96% |
1,139 |
1.69% |
'650 |
1.83% |
'702 |
| Orange |
33.33% |
208,490 |
55.51% |
347,198 |
2.45% |
15,308 |
3.86% |
24,149 |
2.42% |
15,141 |
2.43% |
15,195 |
| Sierra |
32.84% |
'465 |
53.11% |
'752 |
5.01% |
'71 |
4.80% |
'68 |
1.34% |
'19 |
2.90% |
'41 |
| Madera |
32.70% |
8,446 |
57.79% |
14,925 |
2.03% |
'525 |
2.87% |
'742 |
2.45% |
'634 |
2.14% |
'553 |
| Yuba |
32.57% |
3,727 |
56.23% |
6,434 |
2.84% |
'325 |
3.50% |
'401 |
2.05% |
'235 |
2.81% |
'321 |
| Glenn |
32.37% |
2,068 |
57.76% |
3,690 |
1.83% |
'117 |
2.85% |
'182 |
1.86% |
'119 |
3.33% |
'213 |
| El Dorado |
32.23% |
17,674 |
57.13% |
31,327 |
4.04% |
2,213 |
2.82% |
1,549 |
1.75% |
'958 |
2.04% |
1,118 |
| Sutter |
32.11% |
6,105 |
60.02% |
11,409 |
1.75% |
'333 |
2.07% |
'394 |
2.01% |
'383 |
2.03% |
'386 |
| Tulare |
32.08% |
19,648 |
57.23% |
35,057 |
1.68% |
1,032 |
2.94% |
1,801 |
3.31% |
2,029 |
2.76% |
1,688 |
| Placer |
31.93% |
30,206 |
59.40% |
56,193 |
2.77% |
2,618 |
2.66% |
2,518 |
1.54% |
1,455 |
1.70% |
1,610 |
See also
References
External links