Constituency election results in the United Kingdom general election, 1922
| 30th Parliament | (Dec. 1910) |
| 31st Parliament | (1918) |
| 32nd Parliament | (1922) |
| 33rd Parliament | (1923) |
| 34th Parliament | (1924) |
This is an in-complete alphabetical list of constituency election results to the 32nd Parliament of the United Kingdom at the 1922 general election, held on Wednesday 15 November 1922.
Notes
- Change in % vote and swing is calculated between the winner and second place and their respective performances at the 1918 election. A plus denotes a swing to the winner and a minus against the winner.
England
London Boroughs
| Party | Candidate | Votes | % | ± | |
|---|---|---|---|---|---|
| Unionist | Alfred Butt | 17,239 | 68.2 | +8.5 | |
| Liberal | Joseph William Molden | 8,044 | 31.8 | +24.4 | |
| Majority | 9,195 | 36.4 | -6.1 | ||
| Turnout | 61.1 | +9.4 | |||
| Unionist hold | Swing | -8.0 | |||
| Party | Candidate | Votes | % | ± | |
|---|---|---|---|---|---|
| Communist | Shapurji Dorabji Saklatvala | 11,311 | 50.5 | n/a | |
| National Liberal | Henry Cairn Hogbin | 9,290 | 41.6 | n/a | |
| Liberal | Vivian Claude Albu | 1,756 | 7.9 | n/a | |
| Majority | 2,021 | 9.5 | n/a | ||
| Turnout | |||||
| Communist gain from National Liberal | Swing | n/a | |||
| Party | Candidate | Votes | % | ± | |
|---|---|---|---|---|---|
| Unionist | Viscount Francis Curzon | 17,685 | 61.5 | -6.7 | |
| Labour | Albert Winfield | 11,050 | 38.5 | +23.8 | |
| Majority | 6,635 | 23.0 | -30.5 | ||
| Turnout | 65.5 | +12.1 | |||
| Unionist hold | Swing | -15.2 | |||
| Party | Candidate | Votes | % | ± | |
|---|---|---|---|---|---|
| Labour | Alfred Salter | 7,550 | 44.6 | +26.1 | |
| Liberal | Roderick Morris Kedward | 5,225 | 30.9 | -9.7 | |
| National Liberal | Charles Richard Scriven | 2,814 | 16.6 | -11.9 | |
| Independent Unionist | Charles Louis Nordon | 1,328 | 7.9 | n/a | |
| Majority | 2,325 | 13.7 | 25.8 | ||
| Turnout | 26,168 | 64.6 | +19.1 | ||
| Labour gain from Liberal | Swing | +17.9 | |||
| Party | Candidate | Votes | % | ± | |
|---|---|---|---|---|---|
| Liberal | Garnham Edmonds | 5,774 | 36.1 | -20.3 | |
| Communist | Walter Windsor | 5,659 | 35.3 | n/a | |
| Unionist | Eric Alfred Hoffgaard | 2,806 | 17.5 | n/a | |
| National Liberal | George Morgan Garro-Jones | 1,780 | 11.5 | n/a | |
| Majority | 115 | 0.8 | -26.3 | ||
| Turnout | 27,262 | 58.8 | +27.6 | ||
| Liberal hold | Swing | n/a | |||
| Party | Candidate | Votes | % | ± | |
|---|---|---|---|---|---|
| Liberal | Percy Alfred Harris | 5,152 | 40.7 | +12.3 | |
| Communist | Joseph James Vaughan | 4,034 | 31.9 | n/a | |
| Unionist | Sir Mathew Richard Henry Wilson | 3,474 | 27.4 | -24.9 | |
| Majority | 1,118 | 8.8 | 37.2 | ||
| Turnout | 21,129 | 59.9 | +18.3 | ||
| Liberal gain from Unionist | Swing | n/a | |||
| Party | Candidate | Votes | % | ± | |
|---|---|---|---|---|---|
| Labour | George Lansbury | 15,402 | 64.1 | +19.8 | |
| Unionist | Geoffrey Edgar Duveen | 8,626 | 35.9 | -13.8 | |
| Majority | 6,776 | 28.2 | 33.6 | ||
| Turnout | 34,383 | 69.9 | +21.0 | ||
| Labour hold | Swing | +16.8 | |||
| Party | Candidate | Votes | % | ± | |
|---|---|---|---|---|---|
| Unionist | Sir Davison Alexander Dalziel | 11,284 | 54.8 | -6.5 | |
| Liberal | Frederick Joseph Laverack | 9,316 | 45.2 | +29.1 | |
| Majority | 1,968 | 9.6 | -29.1 | ||
| Turnout | 52.8 | +10.0 | |||
| Unionist hold | Swing | -17.8 | |||
| Party | Candidate | Votes | % | ± | |
|---|---|---|---|---|---|
| Labour | Charles George Ammon | 8,320 | 50.8 | +29.8 | |
| Unionist | Dame Helen Charlotte Isabella Gwynne-Vaughan | 8,066 | 49.2 | -8.8 | |
| Majority | 254 | 1.6 | 38.6 | ||
| Turnout | 16,386 | 56.7 | +17.5 | ||
| Labour gain from Unionist | Swing | +19.3 | |||

Macnamara
| Party | Candidate | Votes | % | ± | |
|---|---|---|---|---|---|
| Liberal | Thomas James Macnamara | 6,843 | 34.8 | n/a | |
| Labour | Hyacinth Bernard Morgan | 6,763 | 34.4 | +3.5 | |
| Unionist | Edward Taswell Campbell | 6,045 | 30.8 | n/a | |
| Majority | 80 | 0.4 | -18.3 | ||
| Turnout | 61.9 | -1.9 | |||
| Liberal hold | Swing | n/a | |||
Hoare
| Party | Candidate | Votes | % | ± | |
|---|---|---|---|---|---|
| Unionist | Sir Samuel Hoare | 13,437 | 74.9 | -4.3 | |
| Labour | Bertrand Arthur William Russell | 4,513 | 25.1 | +25.1 | |
| Majority | 8,924 | 49.7 | +8.5 | ||
| Turnout | 28,453 | 63.1 | +16.4 | ||
| Unionist hold | Swing | -14.7 | |||
| Party | Candidate | Votes | % | ± | |
|---|---|---|---|---|---|
| Unionist | Sir Frederick George Banbury | Unopposed | n/a | n/a | |
| Unionist | Edward Charles Grenfell | Unopposed | n/a | n/a | |
| Unionist hold | Swing | n/a | |||

Leigh
| Party | Candidate | Votes | % | ± | |
|---|---|---|---|---|---|
| Unionist | Sir John Leigh | 13,285 | 58.7 | ||
| Labour | Leopold Spero | 4,919 | 21.7 | n/a | |
| Liberal | Ernest Amherst Villiers | 4,444 | 19.6 | ||
| Majority | 8,366 | 37.0 | |||
| Turnout | 22,648 | ||||
| Unionist hold | Swing | ||||
| Party | Candidate | Votes | % | ± | |
|---|---|---|---|---|---|
| Labour | Charles William Bowerman | 18,512 | |||
| Unionist | Marshall James Pike | 16,687 | |||
| Majority | |||||
| Turnout | |||||
| Labour hold | Swing | ||||
| Party | Candidate | Votes | % | ± | |
|---|---|---|---|---|---|
| Unionist | Sir Frederick Hall | 14,046 | |||
| Liberal | Charles Ralph Cooke-Taylor | 6,733 | |||
| Majority | 7,313 | ||||
| Turnout | |||||
| Unionist hold | Swing | ||||
| Party | Candidate | Votes | % | ± | |
|---|---|---|---|---|---|
| Unionist | Kenyon Pascoe Vaughan-Morgan | 13,282 | 61.5 | -7.9 | |
| Labour | John Palmer | 5,393 | 35.0 | +15.5 | |
| Liberal | Maurice Gordon Liverman | 2,907 | 13.5 | +2.4 | |
| Majority | 7,889 | 26.5 | -23.4 | ||
| Turnout | 58.0 | +17.2 | |||
| Unionist hold | Swing | -11.7 | |||
| Party | Candidate | Votes | % | ± | |
|---|---|---|---|---|---|
| Unionist | Sir Cyril Stephen Cobb | 14,875 | 64.4 | -0.5 | |
| Labour | Robert Mark Gentry | 8,210 | 35.6 | +11.9 | |
| Majority | 6,665 | 28.8 | -12.4 | ||
| Turnout | 23,085 | 58.4 | +11.5 | ||
| Unionist hold | Swing | -5.7 | |||

Hume
| Party | Candidate | Votes | % | ± | |
|---|---|---|---|---|---|
| Unionist | George Hopwood Hume | 16,933 | 61 | -8.3 | |
| Labour | Edward Timothy Palmer | 10,861 | 39.0 | +8.3 | |
| Majority | 6,072 | 21.8 | -16.7 | ||
| Turnout | 27,794 | 60.4 | |||
| Unionist hold | Swing | ||||
Lever
| Party | Candidate | Votes | % | ± | |
|---|---|---|---|---|---|
| National Liberal | Sir Arthur Levy Lever | 9,795 | 46.4 | n/a | |
| Liberal | Thomas McKinnon Wood | 6,825 | 32.3 | n/a | |
| Labour | Arthur Alfred Lynch | 4,507 | 21.3 | n/a | |
| Majority | 2,970 | 14.1 | n/a | ||
| Turnout | 21,127 | 60.3 | n/a | ||
| National Liberal gain from Liberal | Swing | n/a | |||
| Party | Candidate | Votes | % | ± | |
|---|---|---|---|---|---|
| Conservative | Sir Walter Raymond Greene | 13,002 | 60.8 | -9.8 | |
| Liberal | Philip Guedalla | 8,387 | 39.2 | +9.8 | |
| Majority | 4,615 | 21.6 | -19.6 | ||
| Turnout | 21,389 | 63.5 | +13.2 | ||
| Conservative hold | Swing | -9.8 | |||
| Party | Candidate | Votes | % | ± | |
|---|---|---|---|---|---|
| Unionist | Clifford Charles Alan Lawrence Erskine-Bolst | 14,017 | 51.4 | n/a | |
| Labour | George Wilfrid Holford Knight | 9,276 | 48.6 | n/a | |
| Majority | 4,741 | 17.4 | n/a | ||
| Turnout | |||||
| Unionist gain from Independent | Swing | n/a | |||
| Party | Candidate | Votes | % | ± | |
|---|---|---|---|---|---|
| Unionist | Sir Henry Foreman | 8,253 | 46.3 | -0.2 | |
| Labour | James Patrick Gardner | 5,350 | 29.8 | +13.4 | |
| Liberal | Frederick L Coysh | 4,278 | 23.9 | +3.5 | |
| Majority | 2,953 | 16.5 | -9.6 | ||
| Turnout | 60.0 | +13.3 | |||
| Unionist hold | Swing | ||||
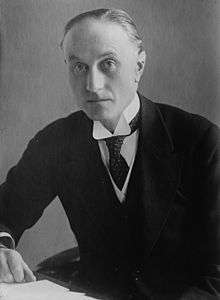
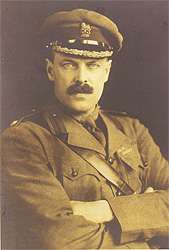
.jpg)
Bull
| Party | Candidate | Votes | % | ± | |
|---|---|---|---|---|---|
| Unionist | Sir William James Bull | 10,877 | 63.0 | -2.5 | |
| Labour | Wyndham James Albery | 6,397 | 37.0 | +22.1 | |
| Majority | 4,480 | 26.0 | -24.6 | ||
| Turnout | 56.4 | ||||
| Unionist hold | Swing | -12.3 | |||
| Party | Candidate | Votes | % | ± | |
|---|---|---|---|---|---|
| Unionist | George Balfour | 14,596 | 59.7 | -11.1 | |
| National Liberal | Albert Clavering | 5,582 | 22.9 | n/a | |
| Liberal | L S Fletcher | 4,282 | 17.5 | n/a | |
| Majority | 9,014 | 36.9 | -14.6 | ||
| Turnout | 24,460 | 63.1 | +5.0 | ||
| Unionist hold | Swing | n/a | |||
| Party | Candidate | Votes | % | ± | |
|---|---|---|---|---|---|
| Unionist | Sir James Farquharson Remnant | 8,996 | 70.5 | -15.8 | |
| Liberal | John Salter Stooke-Vaughan | 3,757 | 29.5 | n/a | |
| Majority | 5,239 | 41.0 | -31.6 | ||
| Turnout | 26,991 | 47.2 | +8.1 | ||
| Unionist hold | Swing | N/A | |||
Baring
| Party | Candidate | Votes | % | ± | |
|---|---|---|---|---|---|
| Unionist | Austin Uvedale Morgan Hudson | 11,954 | 46.1 | -2.7 | |
| Liberal | Sir Godfrey Baring | 8,107 | 31.2 | +0.1 | |
| Labour | Ethel Bentham | 5,900 | 22.7 | +6.4 | |
| Majority | 3,847 | 14.9 | -2.8 | ||
| Turnout | 59.4 | +7.7 | |||
| Unionist hold | Swing | -1.4 | |||
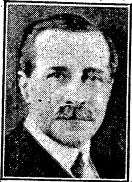
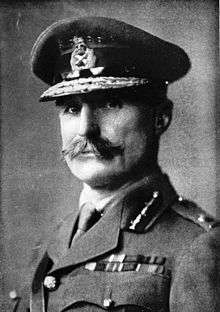
.jpeg)
Moore
| Party | Candidate | Votes | % | ± | |
|---|---|---|---|---|---|
| Unionist | Newton James Moore | 13,520 | 47.0 | -21.5 | |
| Labour | Edith Picton-Turbervill | 7,993 | 27.8 | n/a | |
| Liberal | Norman Thomas Carr Sargant | 7,256 | 25.2 | +13.0 | |
| Majority | 5,527 | 19.2 | -30.0 | ||
| Turnout | |||||
| Unionist hold | Swing | n/a | |||
| Party | Candidate | Votes | % | ± | |
|---|---|---|---|---|---|
| Unionist | Charles Samuel Garland | 7,877 | 36.1 | -17.8 | |
| Liberal | Thomas Wiles | 7,352 | 33.6 | -12.5 | |
| Labour | Frederick William Pethick-Lawrence | 6,634 | 30.3 | n/a | |
| Majority | 525 | 2.5 | -5.4 | ||
| Turnout | 64.2 | +20.1 | |||
| Unionist hold | Swing | -2.7 | |||
| Party | Candidate | Votes | % | ± | |
|---|---|---|---|---|---|
| Unionist | James Archibald St George Fitzwarenne-Despencer Robertson | 7,335 | 38.9 | -6.5 | |
| Liberal | Henry Mills | 6,643 | 35.3 | +11.6 | |
| Labour | W J Lewington | 4,856 | 25.8 | +4.9 | |
| Majority | 592 | 3.6 | -18.1 | ||
| Turnout | 57.5 | +15.4 | |||
| Unionist hold | Swing | -9.1 | |||

Gosling
| Party | Candidate | Votes | % | ± | |
|---|---|---|---|---|---|
| Unionist | Francis Capel Harrison | 10,081 | 47.3 | +15.1 | |
| Labour | Harry Gosling | 7,670 | 36.1 | +10.7 | |
| National Liberal | Henry George Purchase | 3,522 | 16.6 | -25.8 | |
| Majority | 2,411 | 11.2 | n/a | ||
| Turnout | 36,451 | 58.4 | +28.7 | ||
| Unionist gain from Coalition Liberal | Swing | n/a | |||
| Party | Candidate | Votes | % | ± | |
|---|---|---|---|---|---|
| Unionist | Percy George Gates | 12,328 | 53.1 | -25.2 | |
| Labour | William Joseph Jarrett | 6,225 | 26.8 | +5.1 | |
| Liberal | C.W. Hayward | 4,666 | 20.1 | N/A | |
| Majority | 6,103 | 26.3 | |||
| Turnout | 42,328 | 54.9 | +10.7 | ||
| Unionist hold | Swing | -15.2 | |||
| Party | Candidate | Votes | % | ± | |
|---|---|---|---|---|---|
| Unionist | Sir William Henry Davison | 15,760 | 76.0 | +9.2 | |
| Independent | Ferdinand William Cavendish-Bentinck | 4,964 | 24.0 | n/a | |
| Majority | 10,796 | 52.0 | +18.4 | ||
| Turnout | 35,684 | 58.1 | +6.3 | ||
| Unionist hold | Swing | n/a | |||
| Party | Candidate | Votes | % | ± | |
|---|---|---|---|---|---|
| Liberal | Frank Briant | 8,132 | 43.1 | -19.2 | |
| Unionist | Ernest Roy Bird | 7,362 | 39.1 | +1.4 | |
| Labour | Barbara Bodichon Ayrton-Gould | 3,353 | 17.8 | n/a | |
| Majority | 770 | 4.0 | -20.6 | ||
| Turnout | 62.2 | +21.3 | |||
| Liberal hold | Swing | -10.3 | |||
- Lewisham East
| Party | Candidate | Votes | % | ± | |
|---|---|---|---|---|---|
| Unionist | Sir Philip Dawson | 16,216 | 65.7 | n/a | |
| Liberal | Barrett Lennard Albemarle O'Malley | 8,469 | 34.3 | n/a | |
| Majority | 7,747 | 31.4 | n/a | ||
| Turnout | 58.1 | n/a | |||
| Unionist hold | Swing | n/a | |||
| Party | Candidate | Votes | % | ± | |
|---|---|---|---|---|---|
| Labour | Clement Richard Attlee | 9,688 | 55.4 | +30.2 | |
| National Liberal | Sir William Pearce | 7,789 | 44.6 | -15.3 | |
| Majority | 1,899 | 10.8 | 45.5 | ||
| Turnout | 57.8 | +23.1 | |||
| Labour gain from National Liberal | Swing | +22.7 | |||
| Party | Candidate | Votes | % | ± | |
|---|---|---|---|---|---|
| Unionist | Sir Walter Reuben Preston | 6,014 | 41.0 | -22.2 | |
| Labour | John Scurr | 5,219 | 35.5 | +10.4 | |
| Liberal | Robert Bernard Solomon | 3,457 | 23.5 | +11.8 | |
| Majority | 795 | 5.5 | -32.6 | ||
| Turnout | 63.8 | +20.7 | |||
| Unionist hold | Swing | -16.3 | |||
| Party | Candidate | Votes | % | ± | |
|---|---|---|---|---|---|
| Unionist | Walter Greaves-Lord | 16,121 | 60.8 | -5.0 | |
| Liberal | Richard Evan Williams Kirby | 6,253 | 23.5 | n/a | |
| Labour | William Archer Hodgson | 4,180 | 15.7 | n/a | |
| Majority | 9,868 | 37.3 | +5.7 | ||
| Turnout | 43,029 | 61.7 | +13.2 | ||
| Unionist hold | Swing | n/a | |||
| Party | Candidate | Votes | % | ± | |
|---|---|---|---|---|---|
| Unionist | William George Perring | 10,792 | 62.6 | +29.2 | |
| Independent Liberal |
|
6,444 | 37.4 | n/a | |
| Majority | 4,348 | 25.2 | +15.2 | ||
| Turnout | 17,236 | 45.6 | -0.9 | ||
| Unionist hold | Swing | n/a | |||
- adopted as official Liberal candidate, but party withdrew support during campaign following exposure of crooked past[5]
| Party | Candidate | Votes | % | ± | |
|---|---|---|---|---|---|
| Unionist | Henry Douglas King | 9,699 | 67.1 | n/a | |
| Independent Unionist | Ernest Edward Sawyer | 4,764 | 32.9 | n/a | |
| Majority | 4,935 | 34.2 | n/a | ||
| Turnout | 50.5 | n/a | |||
| Unionist hold | Swing | n/a | |||
| Party | Candidate | Votes | % | ± | |
|---|---|---|---|---|---|
| Unionist | Collingwood James Hughes | 11,218 | 44.4 | +15.7 | |
| National Liberal | Henry Lesser | 6,739 | 26.7 | n/a | |
| Labour | Walter Ashbridge Chambers | 5,964 | 23.6 | +7.5 | |
| Liberal | Gerald Spence Tetley | 1,329 | 5.3 | -49.9 | |
| Majority | 4,479 | 17.7 | 44.2 | ||
| Turnout | 25,250 | 66.1 | +23.1 | ||
| Unionist gain from National Liberal | Swing | n/a | |||
| Party | Candidate | Votes | % | ± | |
|---|---|---|---|---|---|
| Labour | Samuel March | 14,484 | 58.8 | +33.2 | |
| National Liberal | Sir Alfred William Yeo | 10,146 | 41.2 | -8.2 | |
| Majority | 4,338 | 17.6 | 41.4 | ||
| Turnout | 37,026 | 66.5 | +18.4 | ||
| Labour gain from Liberal | Swing | +20.7 | |||
| Party | Candidate | Votes | % | ± | |
|---|---|---|---|---|---|
| Unionist | Samuel Samuel | 9,739 | 47.2 | -16.4 | |
| Independent Unionist | Cyril Prescott-Decie | 5,556 | 27.0 | N/A | |
| Liberal | Henry Higgs | 5,317 | 25.8 | N/A | |
| Majority | 4,183 | 20.2 | -7.0 | ||
| Turnout | 20,612 | 61.8 | +18.4 | ||
| Unionist hold | Swing | -16.4 | |||
| Party | Candidate | Votes | % | ± | |
|---|---|---|---|---|---|
| Unionist | John Rolleston Lort-Williams | 6,749 | 36.5 | -13.5 | |
| Labour | Charles Diamond | 6,703 | 36.3 | +20.8 | |
| Liberal | Hubert William Culling Carr-Gomm | 5,034 | 27.2 | -7.3 | |
| Majority | 46 | 0.2 | -15.3 | ||
| Turnout | 63.4 | +18.3 | |||
| Unionist hold | Swing | -17.1 | |||
| Party | Candidate | Votes | % | ± | |
|---|---|---|---|---|---|
| Unionist | Sir Douglas McGarel Hogg | unopposed | n/a | n/a | |
| Unionist hold | Swing | n/a | |||
| Party | Candidate | Votes | % | ± | |
|---|---|---|---|---|---|
| Unionist | John William Lorden | 9,156 | 37.7 | -3.7 | |
| Labour | John Gilbert Dale | 8,165 | 33.6 | +7.0 | |
| Liberal | Sir Willoughby Hyett Dickinson | 6,979 | 28.7 | -3.3 | |
| Majority | 991 | 4.1 | -5.3 | ||
| Turnout | 66.0 | +14.1 | |||
| Unionist hold | Swing | -5.3 | |||
| Party | Candidate | Votes | % | ± | |
|---|---|---|---|---|---|
| Unionist | John Wells Wainwright Hopkins | 8,753 | 47.5 | +9.7 | |
| Labour | Herbert George Romeril | 5,609 | 30.5 | +13.6 | |
| Liberal | Leonard Benjamin Franklin | 4,053 | 22.0 | -5.8 | |
| Majority | 3,144 | 17.0 | +7.0 | ||
| Turnout | 60.1 | +12.9 | |||
| Unionist hold | Swing | -1.9 | |||
| Party | Candidate | Votes | % | ± | |
|---|---|---|---|---|---|
| Unionist | Richard Whieldon Barnett | 8,289 | 49.4 | -9.2 | |
| Liberal | Arthur Strettell Comyns Carr | 5,533 | 33.0 | -5.5 | |
| Labour | George Horne | 2,947 | 17.6 | n/a | |
| Majority | 2,756 | 16.4 | -3.7 | ||
| Turnout | 57.9 | +12.7 | |||
| Unionist hold | Swing | -1.9 | |||

Addison
| Party | Candidate | Votes | % | ± | |
|---|---|---|---|---|---|
| National Liberal | Ernest Griffith Price | 9,084 | 37.6 | n/a | |
| Labour | Ernest Thurtle | 8,834 | 36.5 | n/a | |
| Liberal | Christopher Addison | 6,273 | 25.9 | n/a | |
| Majority | 250 | 1.1 | -34.8 | ||
| Turnout | 47.4 | +10.1 | |||
| National Liberal hold | Swing | n/a | |||
| Party | Candidate | Votes | % | ± | |
|---|---|---|---|---|---|
| National Liberal | James Daniel Gilbert | 10,522 | 65.6 | -6.5 | |
| Labour | George Dobson Bell | 5,522 | 34.4 | +6.5 | |
| Majority | 5,000 | 31.2 | -13.0 | ||
| National Liberal hold | Swing | -6.5 | |||
| Party | Candidate | Votes | % | ± | |
|---|---|---|---|---|---|
| National Liberal | Edward Anthony Strauss | 7,435 | 54.0 | +6.9 | |
| Labour | Leslie Haden-Guest | 6,323 | 46.0 | +23.8 | |
| Majority | 1,112 | 8.0 | -14.9 | ||
| Turnout | 56.1 | +15.7 | |||
| National Liberal hold | Swing | -8.4 | |||
Alexander
| Party | Candidate | Votes | % | ± | |
|---|---|---|---|---|---|
| National Liberal | Maurice Alexander | 10,014 | 56.4 | -16.2 | |
| Labour | Thomas Ellis Naylor | 7,734 | 43.6 | +16.2 | |
| Majority | 2,280 | 12.8 | -32.4 | ||
| Turnout | 58.2 | ||||
| National Liberal hold | Swing | -16.2 | |||
| Party | Candidate | Votes | % | ± | |
|---|---|---|---|---|---|
| Unionist | George William Henry Jones | 9,753 | 63.0 | +8.9 | |
| Liberal | Percy Holt Heffer | 5,737 | 37.0 | +17.0 | |
| Majority | 4,016 | 26.0 | -2.2 | ||
| Turnout | 65.0 | +10.6 | |||
| Unionist hold | Swing | -4.0 | |||
- Streatham
Norton-Griffiths
| Party | Candidate | Votes | % | ± | |
|---|---|---|---|---|---|
| Unionist | Sir John Norton-Griffiths | 12,470 | 69.7 | +14.7 | |
| Labour | Lewis Silkin | 5,420 | 30.3 | +6.4 | |
| Majority | 7,050 | 39.4 | +8.3 | ||
| Turnout | 17,890 | 61.4 | +10.6 | ||
| Unionist hold | Swing | +0.03 | |||
| Party | Candidate | Votes | % | ± | |
|---|---|---|---|---|---|
| Unionist | John Sanctuary Nicholson | 13,620 | 75.6 | n/a | |
| Labour | Joseph Butler | 2,454 | 13.6 | n/a | |
| Independent | Sidney Robert Drury-Lowe | 1,950 | 10.8 | n/a | |
| Majority | 11,166 | 62.0 | n/a | ||
| Turnout | 36,763 | 49.0 | n/a | ||
| Unionist hold | Swing | n/a | |||
| Party | Candidate | Votes | % | ± | |
|---|---|---|---|---|---|
| Independent Conservative | James Malcolm Monteith Erskine | 11,252 | 55.9 | n/a | |
| Unionist | Leslie Orme Wilson | 7,559 | 37.6 | -52.6 | |
| Liberal | Mary Sophia Allen | 1,303 | 6.5 | -3.2 | |
| Majority | 3,693 | 18.3 | 62.1 | ||
| Turnout | 20,114 | 62.2 | +22.3 | ||
| Independent Conservative gain from Unionist | Swing | n/a | |||
| Party | Candidate | Votes | % | ± | |
|---|---|---|---|---|---|
| Labour | Charles James Mathew | 6,267 | 40.2 | +11.0 | |
| Liberal | James Daniel Kiley | 5,839 | 37.4 | +2.5 | |
| Unionist | Alfred Instone | 3,502 | 22.4 | -6.4 | |
| Majority | 428 | 2.8 | 8.5 | ||
| Turnout | 24,333 | 64.1 | +27.1 | ||
| Labour gain from Liberal | Swing | +4.2 | |||
| Party | Candidate | Votes | % | ± | |
|---|---|---|---|---|---|
| Labour | Harry Snell | 15,620 | 57.1 | n/a | |
| Unionist | Robert Gee | 11,714 | 42.9 | n/a | |
| Majority | 3,906 | 14.2 | n/a | ||
| Turnout | 33,993 | 80.4 | n/a | ||
| Labour hold | Swing | n/a | |||
- Woolwich West
English Boroughs

Buxton
| Party | Candidate | Votes | % | ± | |
|---|---|---|---|---|---|
| Labour | Charles Roden Buxton | 16,462 | 44.3 | +22.6 | |
| Unionist | Ernest Gray | 11,408 | 30.6 | -16.6 | |
| Liberal | Rt Hon. Harold Trevor Baker | 9,395 | 25.1 | -3.5 | |
| Majority | 5,054 | 13.7 | 32.3 | ||
| Turnout | 88.7 | +19.2 | |||
| Labour gain from Unionist | Swing | +19.6 | |||
English Counties
| Party | Candidate | Votes | % | ± | |
|---|---|---|---|---|---|
| Unionist | Sydney Richard Wells | 13,460 | 50.3 | n/a | |
| National Liberal | Rt Hon. Frederick George Kellaway | 5,714 | 21.4 | n/a | |
| Labour | Arthur Sells | 5,477 | 20.5 | n/a | |
| Liberal | Lady Lawson | 2,075 | 7.8 | n/a | |
| Majority | 7,746 | 28.9 | n/a | ||
| Turnout | 26,726 | 79.1 | n/a | ||
| Unionist gain from National Liberal | Swing | n/a | |||
| Party | Candidate | Votes | % | ± | |
|---|---|---|---|---|---|
| Unionist | Sir John Prescott Hewett | 13,301 | 43.5 | n/a | |
| Liberal | Harry Arnold | 10,137 | 33.2 | -36.2 | |
| Labour | Percy Alden | 7,107 | 23.3 | -7.3 | |
| Majority | 3,164 | 10.3 | 49.1 | ||
| Turnout | 81.0 | +18.5 | |||
| Unionist gain from Liberal | Swing | n/a | |||
| Party | Candidate | Votes | % | ± | |
|---|---|---|---|---|---|
| Liberal | Frederick Caesar Linfield | 11,874 | 56.5 | +11.7 | |
| Unionist | Maximilian Gowran Townley | 9,137 | 43.5 | -11.7 | |
| Majority | 2,737 | 13.0 | 23.4 | ||
| Turnout | 70.1 | +15.3 | |||
| Liberal gain from Unionist | Swing | +11.7 | |||
| Party | Candidate | Votes | % | ± | |
|---|---|---|---|---|---|
| Unionist | Arthur Thomas Loyd | 10,507 | 51.3 | n/a | |
| Liberal | Edward Albert Lessing | 9,967 | 48.7 | n/a | |
| Majority | 540 | 2.6 | n/a | ||
| Turnout | 77.1 | n/a | |||
| Unionist hold | Swing | n/a | |||
| Party | Candidate | Votes | % | ± | |
|---|---|---|---|---|---|
| Unionist | Howard Clifton Brown | 12,322 | 57.4 | n/a | |
| Liberal | Innes Harold Stranger | 9,144 | 42.6 | n/a | |
| Majority | 3,178 | 14.8 | n/a | ||
| Turnout | 21,466 | 69.7 | n/a | ||
| Unionist hold | Swing | n/a | |||
| Party | Candidate | Votes | % | ± | |
|---|---|---|---|---|---|
| Unionist | Annesley Ashworth Somerville | 17,504 | 71.2 | +1.8 | |
| Liberal | Charles B. Crisp | 7,087 | 28.8 | n/a | |
| Majority | 10,417 | 42.4 | +3.6 | ||
| Turnout | 24,591 | 65.7 | +22.2 | ||
| Unionist hold | Swing | n/a | |||
| Party | Candidate | Votes | % | ± | |
|---|---|---|---|---|---|
| Unionist | Viscount Wolmer | 10,952 | 67.4 | -5.0 | |
| Liberal | Harry Ainger | 5,296 | 32.6 | +5.0 | |
| Majority | 5,656 | 34.8 | -10.0 | ||
| Turnout | 64.8 | +16.8 | |||
| Unionist hold | Swing | -5.0 | |||
Scotland
| Party | Candidate | Votes | % | ± | |
|---|---|---|---|---|---|
| Labour | Frank Herbert Rose | 10,958 | 55.7 | ||
| National Liberal | William Mackenzie Cameron | 6,615 | 33.6 | n/a | |
| Liberal | J Johnstone | 2,113 | 10.7 | ||
| Majority | 4,343 | 22.1 | |||
| Turnout | 19,686 | ||||
| Labour hold | Swing | ||||
| Party | Candidate | Votes | % | ± | |
|---|---|---|---|---|---|
| Unionist | Frederick Charles Thomson | 13,208 | 58.0 | -4.4 | |
| Liberal | Sir Charles Edward Mallet | 9,573 | 42.0 | +21.2 | |
| Majority | 3,635 | 16.0 | -25.6 | ||
| Turnout | 57.5 | ||||
| Unionist hold | Swing | -12.8 | |||
| Party | Candidate | Votes | % | ± | |
|---|---|---|---|---|---|
| Liberal | Murdoch McKenzie Wood | 9,779 | 60.1 | +22.6 | |
| Unionist | Robert Workman Smith | 6,481 | 39.9 | +3.8 | |
| Majority | 3,298 | 20.2 | +18.8 | ||
| Turnout | 16,260 | 56.9 | +6.8 | ||
| Liberal hold | Swing | +9.4 | |||

Frederick Martin
| Party | Candidate | Votes | % | ± | |
|---|---|---|---|---|---|
| Liberal | Frederick Martin | 8,018 | 60.5 | n/a | |
| National Liberal | Sir William Henry Cowan | 5,227 | 39.5 | n/a | |
| Majority | 2,791 | 21.0 | 22.0 | ||
| Turnout | 13,245 | 45.5 | |||
| Liberal gain from National Liberal | Swing | n/a | |||
Arthur Murray
| Party | Candidate | Votes | % | ± | |
|---|---|---|---|---|---|
| Liberal | Hon. Arthur Cecil Murray | 6,224 | 62.3 | n/a | |
| National Liberal | William Mitchell | 3,767 | 37.7 | n/a | |
| Majority | 2,457 | 24.6 | n/a | ||
| Turnout | 44.6 | n/a | |||
| Liberal hold | Swing | n/a | |||
Sir W. Sutherland
| Party | Candidate | Votes | % | ± | |
|---|---|---|---|---|---|
| National Liberal | Rt Hon. Sir William Sutherland | 9,848 | 58.8 | n/a | |
| Liberal | Henry Anderson Watt | 6,897 | 41.2 | n/a | |
| Majority | 2,591 | 15.5 | -67.3 | ||
| Turnout | 16,745 | 51.8 | -0.2 | ||
| National Liberal hold | Swing | n/a | |||
| Party | Candidate | Votes | % | ± | |
|---|---|---|---|---|---|
| Unionist | Rt Hon. Sir John Lawrence Baird | 11,179 | 44.5 | -4.6 | |
| Liberal | Peter Wilson Raffan | 7,402 | 29.5 | +1.8 | |
| Labour | John McDiarmid Airlie | 6,533 | 26.0 | +2.8 | |
| Majority | 3,777 | 15.0 | -6.4 | ||
| Turnout | 71.1 | +8.9 | |||
| Unionist hold | Swing | -3.2 | |||
Hunter-Weston
| Party | Candidate | Votes | % | ± | |
|---|---|---|---|---|---|
| Unionist | Sir Aylmer Gould Hunter-Weston | 14,368 | 60.6 | ||
| Labour | John Paton | 9,323 | 39.4 | ||
| Majority | 5,045 | 21.2 | |||
| Turnout | 23,691 | ||||
| Unionist hold | Swing | ||||
| Party | Candidate | Votes | % | ± | |
|---|---|---|---|---|---|
| Labour | James Brown | 11,511 | 55.6 | +18.3 | |
| Unionist | Sir William Reid | 9,180 | 44.4 | +12.2 | |
| Majority | 2,331 | 11.2 | +6.1 | ||
| Turnout | 20,691 | ||||
| Labour hold | Swing | +3.0 | |||
Charles Barrie
| Party | Candidate | Votes | % | ± | |
|---|---|---|---|---|---|
| National Liberal | Sir Charles Coupar Barrie | unopposed | n/a | n/a | |
| National Liberal hold | Swing | n/a | |||
Walter Waring
| Party | Candidate | Votes | % | ± | |
|---|---|---|---|---|---|
| National Liberal | Walter Waring | 6,342 | 31.9 | n/a | |
| Labour | Robert Spence | 5,842 | 29.3 | ||
| Liberal | William Henderson Pringle | 4,422 | 22.2 | ||
| Independent Liberal | John Deans Hope | 3,300 | 16.6 | n/a | |
| Majority | 500 | 2.6 | |||
| Turnout | 19,906 | ||||
| National Liberal hold | Swing | n/a | |||
| Party | Candidate | Votes | % | ± | |
|---|---|---|---|---|---|
| Labour | John Robertson | 13,872 | 57.0 | ||
| Unionist | Peter Denniston Ridge-Beedle | 10,484 | 43.0 | ||
| Majority | 3,388 | 14.0 | |||
| Turnout | 78.2 | ||||
| Labour hold | Swing | ||||
| Party | Candidate | Votes | % | ± | |
|---|---|---|---|---|---|
| National Liberal | Sir Archibald Henry Macdonald Sinclair | 7,715 | 57.1 | ||
| Liberal | Sir Robert Leicester Harmsworth | 5,803 | 42.9 | ||
| Majority | 1,912 | 14.2 | |||
| Turnout | 60.1 | ||||
| National Liberal hold | Swing | ||||
| Party | Candidate | Votes | % | ± | |
|---|---|---|---|---|---|
| Labour | Lauchlin MacNeill Weir | 10,312 | 42.0 | ||
| Liberal | Craigie Mason Aitchison | 7,379 | 30.0 | ||
| Unionist | Ralph George Campbell Glyn | 6,888 | 28.0 | ||
| Majority | 2,933 | 12.0 | |||
| Turnout | 24,579 | ||||
| Labour gain from Unionist | Swing | ||||
| Party | Candidate | Votes | % | ± | |
|---|---|---|---|---|---|
| Labour | James C. Welsh | 12,038 | 49.0 | ||
| Unionist | Arthur Louis Hamilton Buchanan | 9,724 | 39.6 | ||
| Liberal | Daniel Patterson Blades | 2,802 | 11.4 | ||
| Majority | 2,314 | 9.4 | |||
| Turnout | 24,564 | ||||
| Labour gain from Unionist | Swing | ||||
| Party | Candidate | Votes | % | ± | |
|---|---|---|---|---|---|
| Labour | David Kirkwood | 16,397 | 64.5 | ||
| National Liberal | John Taylor | 9,017 | 35.5 | ||
| Majority | 7,380 | 29.0 | |||
| Turnout | 25,414 | ||||
| Labour hold | Swing | ||||
| Party | Candidate | Votes | % | ± | |
|---|---|---|---|---|---|
| Liberal | William Allan Chapple | 13,296 | 54.6 | ||
| Unionist | Henry Keswick | 11,055 | 45.4 | ||
| Majority | 2,241 | 9.2 | |||
| Turnout | 24,351 | ||||
| Liberal gain from Unionist | Swing | ||||
| Party | Candidate | Votes | % | ± | |
|---|---|---|---|---|---|
| Labour | William Graham | 12,876 | 57.9 | +6.6 | |
| National Liberal | Sir George McCrae | 9,371 | 42.1 | -6.6 | |
| Majority | 3,505 | 15.8 | +13.2 | ||
| Turnout | 71.8 | ||||
| Labour hold | Swing | +6.6 | |||
| Party | Candidate | Votes | % | ± | |
|---|---|---|---|---|---|
| Liberal | James Myles Hogge | 10,551 | 59.8 | -2.4 | |
| National Liberal | Sam McDonald | 7,088 | 40.2 | +2.4 | |
| Majority | 3,463 | 19.6 | -4.8 | ||
| Turnout | 17,639 | 66.0 | +13.5 | ||
| Liberal hold | Swing | -2.4 | |||
| Party | Candidate | Votes | % | ± | |
|---|---|---|---|---|---|
| Unionist | Patrick Johnstone Ford | 14,805 | 61.8 | -1.2 | |
| Liberal | P.H. Allan | 9,165 | 38.2 | +1.2 | |
| Majority | 5,640 | 23.6 | -2.4 | ||
| Turnout | 23,970 | ||||
| Unionist hold | Swing | -1.2 | |||
| Party | Candidate | Votes | % | ± | |
|---|---|---|---|---|---|
| Unionist | Sir Samuel Chapman | 14,843 | 67.7 | ||
| National Liberal | Catherine Buchanan Alderton | 7,408 | 33.3 | ||
| Majority | 7,435 | 35.4 | |||
| Turnout | 22,251 | ||||
| Unionist hold | Swing | ||||

Vivian Phillipps
| Party | Candidate | Votes | % | ± | |
|---|---|---|---|---|---|
| Liberal | Henry Vivian Phillipps | 12,355 | 51.4 | +16.9 | |
| Unionist | John Gordon Jameson | 11,689 | 48.6 | -2.2 | |
| Majority | 666 | 2.8 | 19.1 | ||
| Turnout | 68.9 | +15.6 | |||
| Liberal gain from Unionist | Swing | +9.6 | |||
Duncan Millar
| Party | Candidate | Votes | % | ± | |
|---|---|---|---|---|---|
| Liberal | James Duncan Millar | 12,697 | 56.0 | +13.8 | |
| Unionist | Alexander Sprot | 9,987 | 44.0 | -10.2 | |
| Majority | 2,710 | 12.0 | 24.0 | ||
| Turnout | 22,684 | 67.2 | +13.2 | ||
| Liberal gain from Unionist | Swing | +12.0 | |||
| Party | Candidate | Votes | % | ± | |
|---|---|---|---|---|---|
| Labour | Rt Hon. William Adamson | unopposed | n/a | n/a | |
| Labour hold | Swing | n/a | |||
| Party | Candidate | Votes | % | ± | |
|---|---|---|---|---|---|
| Liberal | James Falconer | 8,567 | 54.8 | +7.2 | |
| Unionist | William Thomas Shaw | 7,071 | 45.2 | -7.2 | |
| Majority | 1,396 | 9.6 | 14.4 | ||
| Turnout | 65.0 | +20.8 | |||
| Liberal gain from Unionist | Swing | +7.2 | |||
| Party | Candidate | Votes | % | ± | |
|---|---|---|---|---|---|
| Liberal | Cecil Randolph Dudgeon | 12,406 | 54.0 | N/A | |
| Unionist | Rt Hon. William Watson | 10,557 | 46.0 | N/A | |
| Majority | 1,849 | 8.0 | N/A | ||
| Turnout | 77.5 | N/A | |||
| Liberal hold | Swing | N/A | |||
| Party | Candidate | Votes | % | ± | |
|---|---|---|---|---|---|
| Labour | James Maxton | 17,890 | 63.7 | ||
| National Liberal | Alexander MacCallum Scott | 10,198 | 36.3 | ||
| Majority | 7,692 | 27.4 | |||
| Turnout | 28,088 | ||||
| Labour gain from National Liberal | Swing | ||||
| Party | Candidate | Votes | % | ± | |
|---|---|---|---|---|---|
| Labour | Campbell Stephen | 15,181 | 53.2 | ||
| Unionist | Halford John Mackinder | 11,439 | 40.1 | ||
| Liberal | W.C. Smith | 1,896 | 6.6 | ||
| Majority | 3,742 | 13.1 | |||
| Turnout | 28,516 | ||||
| Labour gain from Unionist | Swing | ||||
| Party | Candidate | Votes | % | ± | |
|---|---|---|---|---|---|
| Labour | John Primrose Hay | 9,137 | 34.0 | +12.4 | |
| National Liberal | Sir Andrew Rae Duncan | 9,104 | 33.8 | n/a | |
| Unionist | Robert MacDonald | 8,661 | 32.2 | n/a | |
| Majority | 33 | 0.2 | 57.0 | ||
| Turnout | 26,902 | ||||
| Labour gain from Liberal | Swing | n/a | |||
Bonar Law
| Party | Candidate | Votes | % | ± | |
|---|---|---|---|---|---|
| Unionist | Rt Hon. Andrew Bonar Law | 15,437 | 49.9 | -28.9 | |
| Labour | Edward Rosslyn Mitchell | 12,923 | 41.9 | +20.7 | |
| Liberal | Sir George Paish | 2,518 | 8.2 | n/a | |
| Majority | 2,514 | 8.0 | -49.6 | ||
| Turnout | 71.2 | +18.3 | |||
| Unionist hold | Swing | -24.8 | |||
| Party | Candidate | Votes | % | ± | |
|---|---|---|---|---|---|
| Labour | George Buchanan | 16,478 | 54.5 | ||
| National Liberal | J.E. Harper | 8,276 | 27.4 | n/a | |
| Independent Communist | John Maclean | 4,027 | 13.3 | ||
| Liberal | Francis John Robertson | 1,456 | 4.8 | n/a | |
| Majority | 8,202 | 27.1 | |||
| Turnout | 30,237 | ||||
| Labour gain from Coalition Labour | Swing | ||||
| Party | Candidate | Votes | % | ± | |
|---|---|---|---|---|---|
| Labour | Neil Maclean | 15,441 | 62.3 | +14.5 | |
| National Liberal | Helen Fraser | 9,336 | 37.7 | +29.3 | |
| Majority | 6,105 | 24.6 | +20.6 | ||
| Turnout | 24,777 | 78.3 | |||
| Labour hold | Swing | -7.4 | |||
| Party | Candidate | Votes | % | ± | |
|---|---|---|---|---|---|
| Unionist | Rt Hon. Sir Robert Stevenson Horne | 12,272 | 62.7 | -12.7 | |
| Liberal | Edwin James Donaldson | 7,313 | 37.3 | n/a | |
| Majority | 4,959 | 25.4 | -25.4 | ||
| Turnout | 75.5 | +12.1 | |||
| Unionist hold | Swing | n/a | |||
| Party | Candidate | Votes | % | ± | |
|---|---|---|---|---|---|
| Unionist | William Hutchison | 13,442 | 54.8 | -9.4 | |
| Liberal | R Roxburgh | 11,094 | 45.2 | +33.0 | |
| Majority | 2,348 | 9.6 | -31.0 | ||
| Turnout | 64.5 | +11.0 | |||
| Unionist hold | Swing | -15.5 | |||
| Party | Candidate | Votes | % | ± | |
|---|---|---|---|---|---|
| Labour | John William Muir | 13,058 | 47.3 | ||
| Unionist | Sir William Mitchell-Thomson | 10,951 | 39.6 | ||
| Liberal | Annie Shepherd Swan | 3,617 | 13.1 | ||
| Majority | 2,107 | 7.7 | 45.3 | ||
| Turnout | |||||
| Labour gain from Unionist | Swing | ||||

Sir John Collie
| Party | Candidate | Votes | % | ± | |
|---|---|---|---|---|---|
| National Liberal | Sir Robert John Collie | 11,754 | 65.2 | n/a | |
| Liberal | Sir Daniel Macaulay Stevenson | 6,282 | 34.8 | n/a | |
| Majority | 5,472 | 30.4 | |||
| Turnout | 18,036 | ||||
| National Liberal hold | Swing | n/a | |||
| Party | Candidate | Votes | % | ± | |
|---|---|---|---|---|---|
| Unionist | Rt Hon. Sir John Gilmour | 14,920 | 63.9 | n/a | |
| Labour | Alexander Burns Mackay | 5,759 | 24.7 | n/a | |
| Liberal | T R Anderson | 2,658 | 11.4 | n/a | |
| Majority | 9,161 | 39.2 | n/a | ||
| Turnout | 23,337 | n/a | |||
| Unionist hold | Swing | n/a | |||
| Party | Candidate | Votes | % | ± | |
|---|---|---|---|---|---|
| Labour | James Stewart | 16,114 | 56.6 | ||
| Unionist | James Brown Couper | 10,343 | 36.3 | ||
| Liberal | James Alexander Fleming | 2,025 | 7.1 | ||
| Majority | 5,771 | 20.3 | |||
| Turnout | 28,482 | ||||
| Labour gain from Unionist | Swing | ||||
| Party | Candidate | Votes | % | ± | |
|---|---|---|---|---|---|
| Labour | John Wheatley | 14,695 | 59.1 | ||
| National Liberal | Thomas Bridgehill Wilson Ramsay | 9,704 | 39.0 | ||
| Anti-Parliamentary Communist | Guy Alfred Aldred | 470 | 1.9 | ||
| Majority | 4,991 | 20.1 | |||
| Turnout | 24,869 | ||||
| Labour hold | Swing | ||||
| Party | Candidate | Votes | % | ± | |
|---|---|---|---|---|---|
| Labour | George Downie Blyth Crookston Hardie | 15,771 | 60.5 | +21.4 | |
| Unionist | Frederick Alexander Macquisten | 10,311 | 39.5 | −13.2 | |
| Majority | 5,460 | 21.0 | 34.6 | ||
| Turnout | 26,082 | 78.5 | +17.6 | ||
| Labour gain from Unionist | Swing | +17.3 | |||
| Party | Candidate | Votes | % | ± | |
|---|---|---|---|---|---|
| Labour | Thomas Henderson | 14,190 | 55.7 | ||
| Unionist | Vivian Leonard Henderson | 9,977 | 39.2 | ||
| Liberal | Charles de Bois Murray | 1,310 | 5.1 | ||
| Majority | 4,213 | 16.5 | |||
| Turnout | 25,477 | ||||
| Labour gain from Unionist | Swing | ||||
Sir G. Collins
| Party | Candidate | Votes | % | ± | |
|---|---|---|---|---|---|
| National Liberal | Sir Godfrey Pattison Collins | 10,520 | 36.6 | -11.4 | |
| Communist | Alexander Geddes | 9,776 | +22.9 | n/a | |
| Unionist | John Denholm | 8,404 | 29.3 | -2.5 | |
| Majority | 744 | 2.5 | -13.7 | ||
| Turnout | 84.8 | +18.2 | |||
| National Liberal hold | Swing | -17.1 | |||
| Party | Candidate | Votes | % | ± | |
|---|---|---|---|---|---|
| Labour | Duncan Macgregor Graham | 12,365 | 57.8 | +15.7 | |
| Unionist | Sir Henry Shanks Keith | 9,089 | 42.4 | +13.4 | |
| Majority | 3,276 | 15.2 | +2.3 | ||
| Turnout | 78.3 | ||||
| Labour hold | Swing | +1.1 | |||
| Party | Candidate | Votes | % | ± | |
|---|---|---|---|---|---|
| National Liberal | Sir Murdoch Macdonald | 9,796 | 52.7 | n/a | |
| Liberal | Alexander Mackenzie Livingstone | 8,785 | 47.3 | n/a | |
| Majority | 1,011 | 5.4 | n/a | ||
| Turnout | 18,581 | ||||
| National Liberal hold | Swing | n/a | |||
Alexander Shaw
| Party | Candidate | Votes | % | ± | |
|---|---|---|---|---|---|
| National Liberal | Hon. Alexander Shaw | 12,991 | 54.7 | -2.4 | |
| Labour | Robert Climie | 10,752 | 45.3 | +2.4 | |
| Majority | 2,239 | 9.4 | -4.8 | ||
| Turnout | 71.5 | +8.9 | |||
| National Liberal hold | Swing | -2.4 | |||
| Party | Candidate | Votes | % | ± | |
|---|---|---|---|---|---|
| National Liberal | James Gardiner | unopposed | n/a | n/a | |
| National Liberal hold | Swing | n/a | |||

Hutchison
| Party | Candidate | Votes | % | ± | |
|---|---|---|---|---|---|
| National Liberal | Sir Robert Hutchison | 12,762 | 51.4 | n/a | |
| Labour | Thomas Kennedy | 12,089 | 48.6 | n/a | |
| Majority | 673 | 2.8 | n/a | ||
| Turnout | 79.3 | n/a | |||
| National Liberal hold | Swing | n/a | |||
| Party | Candidate | Votes | % | ± | |
|---|---|---|---|---|---|
| Unionist | Walter Elliot | 12,005 | 55.0 | ||
| Labour | Thomas Scott Dickson | 9,812 | 45.0 | ||
| Majority | 2,193 | 10.0 | |||
| Turnout | 21,817 | ||||
| Unionist hold | Swing | ||||
| Party | Candidate | Votes | % | ± | |
|---|---|---|---|---|---|
| Labour | Joseph Sullivan | 10,349 | 47.3 | +13.2 | |
| Unionist | Robert McLaren | 7,957 | 36.4 | -6.7 | |
| Liberal | John Charles Carroll | 3,569 | 16.3 | -2.2 | |
| Majority | 2,392 | 10.9 | 19.9 | ||
| Turnout | 72.1 | +30.5 | |||
| Labour gain from Unionist | Swing | +10.0 | |||
Wedgwood Benn
| Party | Candidate | Votes | % | ± | |
|---|---|---|---|---|---|
| Liberal | William Wedgwood Benn | 13,971 | 50.1 | ||
| Unionist | Alexander Munro MacRobert | 7,372 | 26.4 | ||
| Labour | Robert Freeman Wilson | 6,567 | 23.5 | ||
| Majority | 6,599 | 23.7 | |||
| Turnout | 27,910 | ||||
| Liberal hold | Swing | ||||
Shinwell
| Party | Candidate | Votes | % | ± | |
|---|---|---|---|---|---|
| Labour | Emanuel Shinwell | 12,625 | 46.4 | ||
| Unionist | James Kidd | 8,993 | 33.0 | ||
| Liberal | John Fraser Orr | 5,605 | 20.6 | n/a | |
| Majority | 3,632 | 13.4 | |||
| Turnout | 27,223 | ||||
| Labour gain from Unionist | Swing | ||||
| Party | Candidate | Votes | % | ± | |
|---|---|---|---|---|---|
| Unionist | George Aitken Clark Hutchison | 7,416 | 40.9 | ||
| Labour | Andrew Bathgate Clarke | 6,942 | 38.3 | n/a | |
| Liberal | Edward R. McNab | 3,770 | 20.8 | n/a | |
| Majority | 474 | 2.6 | |||
| Turnout | 18,128 | ||||
| Unionist hold | Swing | ||||
| Party | Candidate | Votes | % | ± | |
|---|---|---|---|---|---|
| Labour | Joseph C. Westwood | 6,394 | 36.0 | -3.4 | |
| Unionist | Archibald Crawford | 5,992 | 33.7 | n/a | |
| Liberal | Rt Hon. Sir Donald Maclean | 5,337 | 30.3 | -30.3 | |
| Majority | 402 | 2.3 | 23.5 | ||
| Turnout | 75.7 | +23.1 | |||
| Labour gain from Liberal | Swing | n/a | |||
| Party | Candidate | Votes | % | ± | |
|---|---|---|---|---|---|
| National Liberal | John Leng Sturrock | 8,407 | 54.4 | -21.6 | |
| Labour | John Carnegie | 7,044 | 45.6 | +21.6 | |
| Majority | 1,363 | 8.8 | -43.2 | ||
| Turnout | 62.7 | +13.6 | |||
| National Liberal hold | Swing | -21.6 | |||
| Party | Candidate | Votes | % | ± | |
|---|---|---|---|---|---|
| National Liberal | Thomas Maule Guthrie | 6,263 | 51.8 | n/a | |
| Liberal | James Scott | 5,832 | 48.2 | n/a | |
| Majority | 431 | 3.6 | n/a | ||
| Turnout | 12,095 | 49.0 | n/a | ||
| National Liberal hold | Swing | n/a | |||
| Party | Candidate | Votes | % | ± | |
|---|---|---|---|---|---|
| Communist | John Turner Walton Newbold | 8,262 | 33.3 | +10.1 | |
| Independent Unionist | Hugh Ferguson | 7,214 | 29.1 | +18.3 | |
| Liberal | John Maxwell | 5,359 | 21.6 | -1.6 | |
| National Liberal | David John Colville | 3,966 | 16.0 | n/a | |
| Majority | 1,048 | 10.2 | 21.6 | ||
| Turnout | 81.5 | +17.3 | |||
| Communist gain from Unionist | Swing | n/a | |||
Hamilton
| Party | Candidate | Votes | % | ± | |
|---|---|---|---|---|---|
| Liberal | Sir Robert William Hamilton | 4,814 | 53.5 | n/a | |
| National Liberal | Sir Malcolm Smith | 4,189 | 46.5 | n/a | |
| Majority | 625 | 7.0 | n/a | ||
| Turnout | 9,003 | 37.4 | n/a | ||
| Liberal hold | Swing | n/a | |||
| Party | Candidate | Votes | % | ± | |
|---|---|---|---|---|---|
| Liberal | Rt Hon. Herbert Henry Asquith | 15,005 | 50.5 | +16.5 | |
| Labour | John McLaren Biggar | 14,689 | 49.5 | +16.0 | |
| Majority | 316 | 1.0 | +0.5 | ||
| Turnout | |||||
| Liberal hold | Swing | +0.5 | |||
| Party | Candidate | Votes | % | ± | |
|---|---|---|---|---|---|
| Unionist | Archibald Noel Skelton | 11,387 | 46.3 | n/a | |
| Liberal | William Henderson | 5,874 | 23.9 | n/a | |
| Labour | William Westwood | 4,651 | 18.9 | n/a | |
| National Liberal | William Robert Gourlay | 2,689 | 10.9 | n/a | |
| Majority | 5,513 | 22.4 | n/a | ||
| Turnout | 71.1 | n/a | |||
| Unionist gain from National Liberal | Swing | n/a | |||
| Party | Candidate | Votes | % | ± | |
|---|---|---|---|---|---|
| Labour | Robert Nichol | 9,708 | 42.4 | ||
| Unionist | Sir Frederick Lobnitz | 9,158 | 40.0 | ||
| Liberal | Joseph Johnstone | 4,013 | 17.5 | ||
| Majority | 550 | 2.4 | |||
| Turnout | 22,879 | ||||
| Labour gain from Liberal | Swing | ||||
| Party | Candidate | Votes | % | ± | |
|---|---|---|---|---|---|
| Labour | Robert Murray | 11,787 | 54.0 | ||
| National Liberal | Sir James William Greig | 10,051 | 46.0 | ||
| Majority | 1,736 | 8.0 | |||
| Turnout | 21,838 | ||||
| Labour gain from National Liberal | Swing | ||||
Ian MacPherson
| Party | Candidate | Votes | % | ± | |
|---|---|---|---|---|---|
| National Liberal | Rt Hon. James Ian Macpherson | 5,923 | 56.7 | n/a | |
| Liberal | John Macdonald | 4,521 | 43.3 | n/a | |
| Majority | 1,402 | 13.4 | -44.4 | ||
| Turnout | 42.4 | -8.8 | |||
| National Liberal hold | Swing | n/a | |||
| Party | Candidate | Votes | % | ± | |
|---|---|---|---|---|---|
| National Liberal | Sir Thomas Henderson | 10,356 | 51.7 | ||
| Liberal | Sir Alfred Hamilton Grant | 9,698 | 48.3 | n/a | |
| Majority | 658 | 3.4 | |||
| Turnout | 20,054 | 60.9 | |||
| National Liberal hold | Swing | n/a | |||
| Party | Candidate | Votes | % | ± | |
|---|---|---|---|---|---|
| Labour | William Wright | 14,029 | 55.1 | ||
| National Liberal | John T Train | 11,440 | 44.9 | ||
| Majority | 2,589 | 10.2 | |||
| Turnout | 25,469 | ||||
| Labour gain from Liberal | Swing | ||||
| Party | Candidate | Votes | % | ± | |
|---|---|---|---|---|---|
| Labour | Hugh Murnin | 11,073 | 53.3 | +17.6 | |
| National Liberal | Rt Hon. John Archibald Murray Macdonald | 9,717 | 46.7 | -17.6 | |
| Turnout | 71.7 | +22.3 | |||
| Majority | 1,356 | 6.6 | 35.2 | ||
| Labour gain from National Liberal | Swing | +17.6 | |||
| Party | Candidate | Votes | % | ± | |
|---|---|---|---|---|---|
| Labour | Lauchlin MacNeill Weir | 10,312 | 42.0 | ||
| Liberal | Craigie Mason Aitchison | 7,379 | 30.0 | ||
| Unionist | Ralph George Campbell Glyn | 6,888 | 28.0 | ||
| Majority | 2,933 | 12.0 | |||
| Turnout | 24,579 | ||||
| Labour gain from Unionist | Swing | ||||
| Party | Candidate | Votes | % | ± | |
|---|---|---|---|---|---|
| Labour | Thomas Johnston | 9,919 | 55.0 | ||
| Unionist | Sir Harry Hope | 8,104 | 45.0 | ||
| Majority | 1,815 | 10.0 | |||
| Turnout | 18,023 | ||||
| Labour gain from Unionist | Swing | ||||
| Party | Candidate | Votes | % | ± | |
|---|---|---|---|---|---|
| National Liberal | Sir William Dingwall Mitchell Cotts | 6,177 | 54.1 | +11.6 | |
| Liberal | Donald Murray | 5,238 | 45.9 | -1.4 | |
| Majority | 939 | 8.2 | +3.4 | ||
| Turnout | 11,415 | 54.1 | +10.5 | ||
| National Liberal gain from Liberal | Swing | 6.5 | |||
Wales
MacDonald
| Party | Candidate | Votes | % | ± | |
|---|---|---|---|---|---|
| Labour | James Ramsay MacDonald | 14,318 | 46.6 | +10.9 | |
| Unionist | Sidney Hutchinson Byass | 11,111 | 36.1 | n/a | |
| National Liberal | John Edwards | 5,238 | 17.3 | -45.5 | |
| Majority | 3,207 | 10.5 | -16.5 | ||
| Turnout | 88.6 | ||||
| Labour gain from Liberal | Swing | +28.2 | |||
| Party | Candidate | Votes | % | ± | |
|---|---|---|---|---|---|
| Labour | George Henry Hall | 20,704 | 57.2 | +35.8 | |
| National Liberal | Charles Butt Stanton | 15,487 | 42.8 | -35.8 | |
| Majority | 5,217 | 14.4 | 71.6 | ||
| Turnout | 36,191 | 79.9 | +10.1 | ||
| Labour gain from National Liberal | Swing | +35.8 | |||
| Party | Candidate | Votes | % | ± | |
|---|---|---|---|---|---|
| Labour | George Barker | unopposed | n/a | n/a | |
| Labour win | |||||
| Party | Candidate | Votes | % | ± | |
|---|---|---|---|---|---|
| Labour | Charles Edwards | 17,270 | 63.0 | ||
| Unionist | C.E. Bagram | 10,132 | 37.0 | n/a | |
| Majority | 7,138 | 26.0 | |||
| Turnout | 27,402 | ||||
| Labour hold | Swing | ||||
W.A. Jenkins
| Party | Candidate | Votes | % | ± | |
|---|---|---|---|---|---|
| National Liberal | William Albert Jenkins | 20,405 | 67.4 | ||
| Labour | Edward Thomas John | 9,850 | 32.6 | n/a | |
| Majority | 10,555 | 34.8 | |||
| Turnout | 77.9 | ||||
| National Liberal hold | Swing | ||||
| Party | Candidate | Votes | % | ± | |
|---|---|---|---|---|---|
| Labour | Morgan Jones | 13,759 | 57.2 | +2.4 | |
| Unionist | Alan McLean | 10,165 | 42.8 | n/a | |
| Majority | 4,025 | 14.4 | -4.3 | ||
| Turnout | 78.6 | +14.6 | |||
| Labour hold | Swing | n/a | |||
| Party | Candidate | Votes | % | ± | |
|---|---|---|---|---|---|
| Unionist | James Childs Gould | 13,885 | 50.0 | +8.9 | |
| Labour | James Ewart Edmunds | 8,169 | 29.4 | +7.0 | |
| Liberal | C.F. Sanders | 5,732 | 20.6 | +0.5 | |
| Majority | 5,716 | 20.6 | +1.9 | ||
| Turnout | 74.4 | ||||
| Unionist hold | Swing | ||||
| Party | Candidate | Votes | % | ± | |
|---|---|---|---|---|---|
| Unionist | Lewis Lougher | 8,804 | 36.8 | +6.1 | |
| Liberal | Sir Henry Webb | 7,622 | 31.8 | -9.0 | |
| Labour | Arthur James Williams | 7,506 | 31.4 | +2.9 | |
| Majority | 1,182 | 5.0 | 15.2 | ||
| Turnout | 81.0 | +16.4 | |||
| Unionist gain from Liberal | Swing | +7.6 | |||
| Party | Candidate | Votes | % | ± | |
|---|---|---|---|---|---|
| Unionist | Sir James Herbert Cory | 7,929 | 36.4 | -12.0 | |
| Liberal | Bernard Cyril Freyberg | 6,996 | 32.2 | +7.0 | |
| Labour | David Graham Pole | 6,831 | 31.9 | -5.6 | |
| Majority | 933 | 4.2 | -17.9 | ||
| Turnout | 21,756 | 74.9 | +17.1 | ||
| Unionist hold | Swing | -9.5 | |||

Ernest Evans
| Party | Candidate | Votes | % | ± | |
|---|---|---|---|---|---|
| National Liberal | Ernest Evans | 12,825 | 51.0 | n/a | |
| Liberal | Rhys Hopkin Morris | 12,310 | 49.0 | n/a | |
| Majority | 515 | 2.0 | n/a | ||
| Turnout | 76.9 | n/a | |||
| National Liberal hold | Swing | n/a | |||
| Party | Candidate | Votes | % | ± | |
|---|---|---|---|---|---|
| National Liberal | John Hinds | 12,530 | 41.8 | n/a | |
| Unionist | Hon. George William Reginald Victor Coventry | 8,805 | 29.4 | n/a | |
| National Farmers' Union | Daniel Johns | 4,775 | 15.9 | n/a | |
| Liberal | H. Llewelyn-Williams | 3,847 | 12.8 | n/a | |
| Majority | 3,725 | 12.4 | n/a | ||
| Turnout | 29,957 | 82.7 | n/a | ||
| National Liberal hold | Swing | n/a | |||

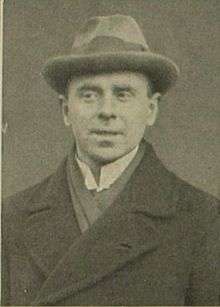
D. Lloyd George
| Party | Candidate | Votes | % | ± | |
|---|---|---|---|---|---|
| National Liberal | David Lloyd George | Unopposed | n/a | n/a | |
| National Liberal hold | Swing | n/a | |||
| Party | Candidate | Votes | % | ± | |
|---|---|---|---|---|---|
| Labour | Robert Thomas Jones | 14,016 | 53.0 | +18.4 | |
| National Liberal | Charles Edward Breese | 12,407 | 47.0 | +2.5 | |
| Majority | 1,609 | 6.0 | 15.9 | ||
| Turnout | 26,423 | 70.6 | |||
| Labour gain from National Liberal | Swing | +8.0 | |||
| Party | Candidate | Votes | % | ± | |
|---|---|---|---|---|---|
| National Liberal | John Cledwyn Davies | 12,975 | 53.9 | -29.4 | |
| Unionist | Hon. Mrs Lesley Venetia Elizabeth Brodrick | 9,138 | 37.9 | n/a | |
| Liberal | Llewellyn G Williams | 1,974 | 8.2 | n/a | |
| Majority | 3,837 | 16.0 | -50.6 | ||
| Turnout | 76.7 | +10.1 | |||
| National Liberal hold | Swing | n/a | |||
| Party | Candidate | Votes | % | ± | |
|---|---|---|---|---|---|
| Labour | Evan Davies | 16,947 | 65.4 | n/a | |
| Unionist | Morgan Morgan | 8,951 | 34.6 | n/a | |
| Majority | 7,996 | 30.8 | n/a | ||
| Turnout | 25,898 | 78.2 | n/a | ||
| Labour hold | Swing | n/a | |||
Thomas Parry
| Party | Candidate | Votes | % | ± | |
|---|---|---|---|---|---|
| National Liberal | Thomas Henry Parry | 16,854 | 44.2 | n/a | |
| Unionist | Austin Ellis Lloyd Jones | 15,080 | 39.6 | n/a | |
| Labour | David Gwynfryn Jones | 6,163 | 16.2 | n/a | |
| Majority | 1,774 | 4.6 | n/a | ||
| Turnout | 79.4 | n/a | |||
| National Liberal hold | Swing | ||||
| Party | Candidate | Votes | % | ± | |
|---|---|---|---|---|---|
| Labour | David Rhys Grenfell | 13,388 | 54.2 | -0.6 | |
| Liberal | Frederick William Davies | 11,302 | 45.8 | +0.6 | |
| Majority | 2,086 | 8.4 | -1.2 | ||
| Turnout | 74.6 | +12.4 | |||
| Labour hold | Swing | -0.6 | |||
| Party | Candidate | Votes | % | ± | |
|---|---|---|---|---|---|
| Unionist | William Cope | 13,129 | 44.1 | -17.9 | |
| Labour | James Alexander Lovat-Fraser | 9,031 | 30.4 | -0.4 | |
| Liberal | John Claxton Meggitt | 7,577 | 25.5 | n/a | |
| Majority | 4,098 | 13.7 | -17.5 | ||
| Turnout | 76.8 | +13.8 | |||
| Unionist hold | Swing | -8.7 | |||
| Party | Candidate | Votes | % | ± | |
|---|---|---|---|---|---|
| Labour | John Henry Williams | 23,213 | 59.3 | +12.4 | |
| National Liberal | G. Clarke Williams | 15,947 | 40.7 | -12.4 | |
| Majority | 7,266 | 18.6 | 24.8 | ||
| Turnout | 80.3 | +11.4 | |||
| Labour gain from National Liberal | Swing | +12.4 | |||
| Party | Candidate | Votes | % | ± | |
|---|---|---|---|---|---|
| Liberal | Henry Haydn Jones | 9,903 | 58.3 | n/a | |
| Labour | John Jones Roberts | 7,070 | 41.7 | n/a | |
| Majority | 2,833 | 16.6 | n/a | ||
| Turnout | 16,973 | n/a | |||
| Liberal hold | Swing | n/a | |||
| Party | Candidate | Votes | % | ± | |
|---|---|---|---|---|---|
| Labour | Richard Collingham Wallhead | 17,516 | 53.0 | +5.7 | |
| Independent | Sir Richard Mathias | 15,552 | 47.0 | n/a | |
| Majority | 1,964 | 6.0 | 11.4 | ||
| Turnout | 90.6 | + | |||
| Labour gain from Liberal | Swing | n/a | |||
| Party | Candidate | Votes | % | ± | |
|---|---|---|---|---|---|
| Unionist | Charles Leolin Forestier-Walker | unopposed | n/a | n/a | |
| Unionist hold | Swing | n/a | |||
| Party | Candidate | Votes | % | ± | |
|---|---|---|---|---|---|
| Liberal | David Davies | unopposed | n/a | n/a | |
| Liberal hold | Swing | n/a | |||
| Party | Candidate | Votes | % | ± | |
|---|---|---|---|---|---|
| Labour | William Jenkins | 19,566 | 59.5 | +24.3 | |
| National Liberal | John Hugh Edwards | 13,331 | 40.5 | -24.3 | |
| Majority | 6,235 | 19.0 | 48.6 | ||
| Turnout | 75.4 | +4.8 | |||
| Labour gain from National Liberal | Swing | +24.3 | |||
| Party | Candidate | Votes | % | ± | |
|---|---|---|---|---|---|
| Unionist | Reginald George Clarry | 19,019 | 54.3 | n/a | |
| Labour | John William Bowen | 16,000 | 45.7 | +4.7 | |
| Majority | 3,019 | 8.6 | +24.0 | ||
| Turnout | 82.1 | +19.9 | |||
| Unionist gain from Liberal | Swing | n/a | |||
| Party | Candidate | Votes | % | ± | |
|---|---|---|---|---|---|
| Labour | Rt Hon. Vernon Hartshorn | 17,321 | 55.8 | n/a | |
| National Liberal | John Walter Jones | 7,498 | 24.1 | n/a | |
| Unionist | Mrs Dorothy Caroline Edmondes | 6,577 | 20.1 | n/a | |
| Majority | 8,823 | 31.7 | n/a | ||
| Turnout | 78.3 | n/a | |||
| Labour hold | Swing | n/a | |||
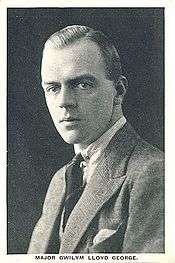
G. Lloyd George
| Party | Candidate | Votes | % | ± | |
|---|---|---|---|---|---|
| National Liberal | Gwilym Lloyd George | 21,569 | 69.0 | ||
| Labour | William James Jenkins | 9,703 | 31.0 | ||
| Majority | 11,866 | 38.0 | |||
| Turnout | 31,272 | ||||
| National Liberal hold | Swing | ||||
| Party | Candidate | Votes | % | ± | |
|---|---|---|---|---|---|
| Labour | Thomas Griffiths | 11,198 | 40.6 | +1.6 | |
| Unionist | Sir Thomas George Jones | 8,654 | 31.4 | -1.1 | |
| Liberal | Sir Robert Lowden Connell | 7,733 | 28.0 | -0.5 | |
| Majority | 2,544 | 9.2 | +2.7 | ||
| Turnout | 85.0 | +12.9 | |||
| Labour hold | Swing | -0.3 | |||
| Party | Candidate | Votes | % | ± | |
|---|---|---|---|---|---|
| Labour | Thomas Isaac Mardy Jones | 14,884 | 47.2 | +4.4 | |
| National Liberal | Sir Rhys Rhys-Williams | 8,667 | 27.5 | -28.6 | |
| Unionist | J. Griffith Jones | 7,994 | 25.4 | +24.3 | |
| Majority | 6,217 | 19.7 | +6.5 | ||
| Turnout | 31,545 | 76.8 | |||
| Labour hold | Swing | +2.9 | |||
Watts Morgan
| Party | Candidate | Votes | % | ± | |
|---|---|---|---|---|---|
| Labour | David Watts-Morgan | 17,146 | 55.0 | n/a | |
| National Liberal | Frederick William Heale | 14,025 | 45.0 | n/a | |
| Majority | 3,121 | 10.0 | n/a | ||
| Turnout | 80.9 | n/a | |||
| Labour hold | Swing | n/a | |||
| Party | Candidate | Votes | % | ± | |
|---|---|---|---|---|---|
| Labour | William John | 18,001 | 62.1 | n/a | |
| Unionist | Gwilym Rowlands | 10,990 | 37.9 | n/a | |
| Majority | 7,011 | 24.2 | n/a | ||
| Turnout | 28,991 | 83.7 | n/a | ||
| Labour hold | Swing | n/a | |||
| Party | Candidate | Votes | % | ± | |
|---|---|---|---|---|---|
| Labour | David Williams | 11,333 | 50.9 | +14.5 | |
| National Liberal | E. Harries | 10,926 | 49.1 | -14.5 | |
| Majority | 407 | 1.8 | 29.0 | ||
| Turnout | 81.7 | +17.6 | |||
| Labour gain from National Liberal | Swing | +14.5 | |||
Sir Alfred Mond
| Party | Candidate | Votes | % | ± | |
|---|---|---|---|---|---|
| National Liberal | Rt Hon. Sir Alfred Moritz Mond | 9,278 | 35.5 | -4.5 | |
| Unionist | William Albert Samuel Hewins | 8,476 | 32.4 | -2.0 | |
| Labour | Howel Walter Samuel | 8,401 | 32.1 | +6.5 | |
| Majority | 802 | 3.1 | -2.5 | ||
| Turnout | 83.9 | +16.5 | |||
| National Liberal hold | Swing | -1.25 | |||
| Party | Candidate | Votes | % | ± | |
|---|---|---|---|---|---|
| Labour | Robert Richards | 11,940 | 35.8 | +12.1 | |
| National Liberal | E R Davies | 10,842 | 32.6 | -43.7 | |
| Unionist | R C G Roberts | 10,508 | 31.6 | n/a | |
| Majority | 1,098 | 3.2 | 55.8 | ||
| Turnout | 84.4 | +14.7 | |||
| Labour gain from Liberal | Swing | +27.9 | |||
Northern Ireland
| Party | Candidate | Votes | % | ± | |
|---|---|---|---|---|---|
| UUP | Charles Curtis Craig | Unopposed | n/a | n/a | |
| UUP | Rt Hon. Robert William Hugh O'Neill | Unopposed | n/a | n/a | |
| UUP hold | Swing | n/a | |||
Universities
| Party | Candidate | Votes | % | ± | |
|---|---|---|---|---|---|
| Unionist | John Frederick Peel Rawlinson | 4,192 | 49.4 | +14.2 | |
| Independent Liberal | James Ramsay Montagu Butler | 3,453 | 39.9 | +39.9 | |
| Unionist | Prof. William Ritchie Sorley | 1,018 | 11.7 | +11.7 | |
| Quota | 2,888 | ||||
| Turnout | 8,663 | 63.7 | |||
| Independent Liberal gain from Unionist | Swing | ||||
References
- 1 2 3 4 5 6 7 8 9 10 11 12 13 14 15 16 17 18 19 20 21 22 23 24 25 26 27 28 29 30 31 32 33 34 35 36 37 38 39 40 41 42 43 44 45 46 47 48 49 50 51 52 53 54 British Parliamentary Election Results 1918–1949, FWS Craig
- ↑ The Liberal Year Book, 1930
- ↑ "The General Election. First Returns., Polls in the Boroughs., Heavy Voting". The Times. 16 November 1922. p. 7.
- ↑ "The General Election: First Returns, Polling In The Boroughs, Heavy Voting". The Times. 16 November 1922. p. 6.
- ↑ Getting Rich Quick, Frank Dilnot
- 1 2 3 4 5 6 7 8 9 10 11 12 13 14 15 16 17 18 19 20 21 22 23 24 25 26 27 28 29 The Times, 17 November 1922
- ↑ The Constitutional Year Book, 1930
- ↑ Liberal Yearbook, 1939
- ↑ The Times, 16 November 1922
- ↑ The Times, 16 November 1922
- ↑ The Times, 16 November 1922
- ↑ The Times, 20 November 1922
- ↑ Etholiadau'r ganrif 1885–1997, Beti Jones
- ↑ House of Commons Information Office Email Dated 18 December 2008
- ↑ Etholiadau'r ganrif 1885–1997, Beti Jones
This article is issued from Wikipedia - version of the 11/25/2016. The text is available under the Creative Commons Attribution/Share Alike but additional terms may apply for the media files.