Oil depletion
Oil depletion is the decline in oil production of a well, oil field, or geographic area.[1] The Hubbert peak theory makes predictions of production rates based on prior discovery rates and anticipated production rates. Hubbert curves predict that the production curves of non-renewing resources approximate a bell curve. Thus, according to this theory, when the peak of production is passed, production rates enter an irreversible decline.[2][3]
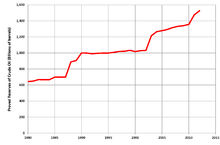
The United States Energy Information Administration predicted in 2006 that world consumption of oil will increase to 98.3 million barrels per day (15,630,000 m3/d) (mbd) in 2015 and 118 million barrels per day in 2030.[4] With 2009 world oil consumption at 84.4 mbd,[5] reaching the projected 2015 level of consumption would represent an average annual increase between 2009 and 2015 of 2.7% per year.
Resource availability
The World's natural oil supply is fixed because petroleum is naturally formed far too slowly to be replaced at the rate at which it is being extracted. Over many millions of years, plankton, bacteria, and other plant and animal matter became buried in sediments on the ocean floor. When conditions were right – a lack of oxygen for decomposition, and sufficient depth and temperature of burial – these organic remains were converted into petroleum compounds, while the sediment accompanying them was converted into sandstone, siltstone, and other porous sedimentary rock. When capped by impermeable rocks such as shale, salt, or igneous intrusions, they formed the petroleum reservoirs which are exploited today.[6][7]
Production decline models
For the short and medium-term, oil production decline occurs in a predictable manner based on geological circumstances, governmental policies, and engineering practices. The shape of the decline curve varies depending upon whether one considers a well, a field, or a set of fields. In the longer term, technological developments have defied some of the predictions.
Oil well production decline
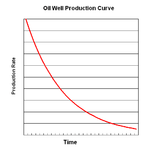
An individual oil well usually produces at its maximum rate at the start of its life; the production rate eventually declines to a point at which it no longer produces profitable amounts. The shape of the decline curve depends on the oil reservoir and the reservoir drive mechanism. Wells in water-drive and gas-cap drive reservoirs often produce at a near constant rate until the encroaching water or expanding gas cap reaches the well, causing a sudden decline in oil production. Wells in gas solution drive and oil expansion drive reservoirs have exponential or hyperbolic declines: rapid declines at first, then leveling off.[8]
The shape of production curve of an oil well can also be affected by a number of nongeologic factors:
- Well may be restricted by choice by lack of market demand or government regulation. This decreases the rate of decline, but will not change the well's total production significantly.
- Hydraulic fracturing (fracking) or acidizing may be used to cause a sharp spike in production, and may increase the recoverable reserves of a given well.
- The field may undergo a secondary or tertiary recovery project, discussed in the next section.
Oil field production decline
Individual oil wells are typically within multi-well oil fields. As with individual wells, the production curves for oil fields vary depending on geology and how they are developed and produced. Some fields have symmetric bell-shaped production profiles, but it is more common that the period of inclining production is briefer and steeper than the subsequent decline. More than half the production usually occurs after a field has reached a peak or plateau.[9] Production profiles of many fields show distinct peaks, but for giant oil fields, it is more common for production to reach and maintain a plateau before declining. Once a field declines, it usually follows an exponential decline.[10] As this decline levels off, production can continue at relatively low rates. A number of oil fields in the U.S. have been producing for over 100 years.[11][12]
Oil field production curves can be modified by a number of factors:
- Production may be restricted by market conditions or government regulation.
- A secondary recovery project, such as water or gas injection, can repressurize the field and increase the total recovery.
- the field may undergo an enhanced oil recovery project, such as drilling of wells for injection of solvents, carbon dioxide, or steam. This allows more oil to be coaxed out of the rock, increasing the ultimate production of the field.
Multi-field production decline

Most oil is found in a small number of very large oil fields. According to Hubbert peak theory, production starts off slowly, rises faster and faster, then slows down and flattens until it reaches a peak, after which production declines. In the late stage, production often enters a period of exponential decline in which the decline becomes less and less steep. Oil production may never actually reach zero, but eventually becomes very low. Factors which can modify this curve include:
- Inadequate demand for oil, which reduces steepness of the curve and pushes its peak into the future.
- Sharp price increases when the production peak is reached, as production fails to meet demand. If price increases cause a sharp drop in demand, a dip in the top of the curve may occur.
- Development of new drilling technology or marketing of unconventional oil can reduce the steepness of the decline as more oil is produced than initially anticipated.
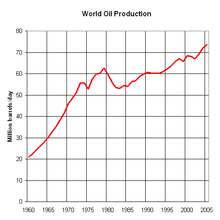
United States production
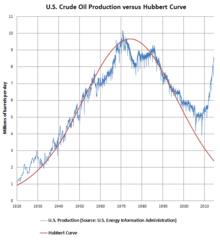
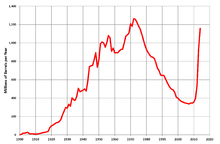
Oil production in the United States, provided one excludes Alaska, began by following the theoretical Hubbert curve for a few decades but is now deviating strongly from it. U.S. oil production reached a peak in 1970 and by the mid-2000s it had fallen to 1940s levels. In 1950, the United States produced over half the world's oil, but by 2005 that proportion had dropped to about 8%. In 2005, U.S. crude oil imports peaked at a rate twice as high as domestic production; since then, U.S. oil production has increased, and imports have fallen 41%.[13]
The production peak in 1970 was predicted by one of the two projections put forward in 1956 by Hubbert. By 1972 all import quotas and controls on U.S. domestic production had been removed. Despite this, and despite the quadrupling of prices during the 1973 oil crisis, the production decline was not reversed in the lower 48 states until 2009. Crude oil production has since risen sharply from 2009 through 2014, so that the rate of US oil production in October 2014 was 81% higher than the average rate in 2008.[14]
The actual U.S. production curve deviates from Hubbert's 1956 curve in significant ways:
- When oil surpluses created a glut on the market and low prices began causing demand and production curves to rise, regulatory agencies such as the Texas Railroad Commission stepped in to restrain production.[6]
- The curve peaked at a higher rate and sharper point than predicted.
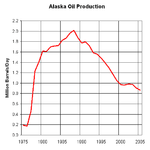
- Production fell after 1970, but started to recover and reached a lower secondary peak in 1988. This occurred because the supergiant Prudhoe Bay field in Alaska was only discovered in 1968, and the Trans-Alaska Pipeline System (TAPS) was not completed until 1977. After 1988, Alaska production peaked and total U.S. production began to decline again. By 2005, Prudhoe Bay had produced over 75% of its oil.
- Production increases in the 2010s
World oil production
The 1970 production peak in the U.S. caused many people to begin to question when the world production peak would occur. The peak of world production is known as Peak oil.
Implications of a world peak
A peak in oil production could result in a worldwide oil shortage, or it could not even be noticed as demand decreases in conjunction with increased prices. While past shortages stemmed from a temporary insufficiency of supply, crossing Hubbert's Peak would mean that the production of oil would continue to decline, and that demand for these products must be reduced to meet supply. The effects of such a shortage would depend on the rate of decline and the development and adoption of effective alternatives.
Catastrophe
The use of fossil fuels allows humans to participate in takedown, which is the consumption of energy at a greater rate than it is being replaced. The industrial economy is currently heavily dependent on oil as a fuel and chemical feedstock. For example, over 90% of transportation in the United States relies on oil.
Since the 1940s, agriculture has dramatically increased its productivity, due largely to the use of chemical pesticides, fertilizers, and increased mechanisation. This process has been called the Green Revolution. The increase in food production has allowed world population to grow dramatically over the last 50 years. Pesticides rely upon oil as a critical ingredient, and fertilizers require natural gas. Farm machinery also requires oil.
Most or all of the uses of fossil fuels in agriculture can be replaced with alternatives. For example, by far the biggest fossil fuel input to agriculture is the use of natural gas as a hydrogen source for the Haber-Bosch fertilizer-creation process.[15] Natural gas is used simply because it is the cheapest currently available source of hydrogen; were that to change, other sources, such as electrolysis powered by solar energy, could be used to provide the hydrogen for creating fertilizer without relying on fossil fuels.
Oil shortages may force a move to lower input "organic agriculture" methods, which may be more labor-intensive and require a population shift from urban to rural areas, reversing the trend towards urbanisation which has predominated in industrial societies; however, some organic farmers using modern organic-farming methods have reported yields as high as those available from conventional farming, but without the use of fossil-fuel-intensive artificial fertilizers or pesticides.[16][17][18][19]
Another possible effect would derive from modern transportation and housing infrastructure. A large proportion of the developed world's population live in suburbs, a type of low-density settlement designed with the automobile in mind. A movement to deal with this problem early, called "New Urbanism," seeks to develop the suburbs into higher density neighborhoods and use high density, mixed-use forms for new building projects.
Recession
A more modest scenario, assuming a slower rate of depletion or a smoother transition to alternative energy sources, could still cause substantial economic hardship such as a recession or depression due to higher energy prices. Inflation has also been linked to oil price spikes. However, economists disagree on the strength and causes of this association. See Energy crisis.
Rising food prices
Rising oil prices cause rising food prices in three ways. First, increased equipment fuel costs drive higher prices. Second, transportation costs increase retail prices. Third, higher oil prices are causing farmers to switch from producing food crops to producing biofuel crops. [20][21] The law of supply and demand predicts that if fewer farmers are producing food the price of food will rise.[22]
Replacement
An alternative considered likely by some is that oil will be replaced with renewable energy during the first half of the 21st century.[23] The replacement fuel would likely be hydrogen. A hydrogen economy would then replace the current oil-based economy. Another possible replacement fuel is biogas, which is composed of methane. Methane has boiling point of −161 °C, rather than hydrogen's -252.87 °C, making methane a much easier fuel to condense.
Other people consider that the whole idea of "the hydrogen economy" is flawed. Compressed hydrogen has an energy density of only 5.6 megajoules per liter. Robert Zubrin looks at the practical problems of using hydrogen as an energy storage medium in Energy Victory: Winning the War on Terror by Breaking Free of Oil.[24] He considers that hydrogen is a very poor form of storage, and that batteries, methanol or dimethyl ether would be better. This point is reiterated in Beyond Oil and Gas: The Methanol Economy[25] and in David MacKay's book described below.
Geothermal power is one source of sustainable energy that can produce hydrogen. Note that David MacKay has shown in his book Sustainable Energy: Without the Hot Air[26] that geothermal can only provide a tiny fraction of the world's needs sustainably. In some areas located over geological hotspots (such as Iceland), geothermal makes more sense.
Solar energy is a source of inexhaustible energy. There is more solar energy that reaches the surface of the Earth each hour than the amount of energy consumed by the world in a year.[27] The challenges of using the sun's energy – energy which can be obtained either from wind power or from solar power – is that the energy needs to either be (1) stored in physical form of fuel for when it can be used in the future, or (2) transported directly as electricity, through transmission lines. Neither is dispatchable, as there is no control over when the sun will shine or when the wind will blow. There are, however, concentrated solar power plants using thermal storage that can store energy efficiently for up to 24 hours.
See also
- Decline curve analysis
- Energy law
- Peak oil
- Oil megaprojects
- ACEGES, a model for energy policy
- Gas depletion
- Coal depletion
- Peak water
Further reading
- Kenneth S. Deffeyes. Hubbert's Peak : The Impending World Oil Shortage, Princeton University Press (August 11, 2003), ISBN 0-691-11625-3.
- Richard Heinberg. The Party's Over: Oil, War, and the Fate of Industrial Societies, New Society Press ISBN 0-86571-482-7
- Matthew R. Simmons. Twilight in the Desert: The Coming Saudi Oil Shock and the World Economy, Wiley (June 10, 2005), ISBN 0-471-73876-X
- David MacKay. Sustainable Energy - without the hot air, UIT Cambridge (May 2009), ISBN 9780954452933
References
- ↑ US Energy Information Administration, Accelerated depletion
- ↑ M. King Hubbert (June 1956). "Nuclear Energy and the Fossil Fuels 'Drilling and Production Practice'" (PDF). API. p. 36. Retrieved 2008-04-18.
- ↑ Hirsch, Robert L.; Bezdek, Roger; Wendling, Robert (February 2005). "Peaking Of World Oil Production: Impacts, Mitigation, & Risk Management" (PDF). Science Applications International Corporation/U.S.Department of Energy, National Energy Technology Laboratory. Retrieved 30 August 2012.
- ↑ "International Energy Outlook 2011 - Energy Information Administration" (PDF). Eia.doe.gov. Retrieved 2013-05-20.
- ↑ Total Consumption of Petroleum Products (Thousand Barrels Per Day)
- 1 2 Tim Appenzeller (June 2004). "The End of Cheap Oil". National Geographic.
- ↑ Abhijit Y. Dandekar. Petroleum reservoir rock and fluid properties. CRC Press, 2006. p. 1. ISBN 0-8493-3043-2
- ↑ Norman J. Hyne, Nontechnical Guide to Petroleum Geology (Tulsa: PennWell, 2012) 435-437.
- ↑ Richard Miller and others, Decline Rates and Depletion Rates, UK Energy Research Centre, Tech Report 4, of "Review of Evidence for Global Oil depletion".
- ↑ Mikael Hook, May 2009, Depletion and Decline Curve Analysis in Crude Oil Production, Licentiate Thesis, Department for Physics and Astronomy, Uppsala University, p.70.
- ↑ Pennenergy.com history for McClintock No. 1 oil well which began first producing oil in August 1861.
- ↑ Florence Field, near Canon City, Colorado, was discovered in 1876.
- ↑ US Energy Information Administration, US net imports of crude oil.
- ↑ US Energy Information Administration, US crude oil production.
- ↑ Archived June 24, 2006, at the Wayback Machine.
- ↑ "Realities of organic farming". Biotech-info.net. 2000-07-03. Retrieved 2013-05-20.
- ↑ Comparison of Organic and Conventional Corn, Soybean, Alfalfa, Oats, and Rye Crops at the Neely-Kinyon LTAR Site-2001
- ↑ Archived January 27, 2006, at the Wayback Machine.
- ↑ "Organic Farms Use Less Energy And Water". Terradaily.com. Retrieved 2013-05-20.
- ↑ Food versus fuel debate escalates
- ↑ How Food and Fuel Compete for Land by Lester Brown – The Globalist - Global Energy Archived January 12, 2010, at the Wayback Machine.
- ↑ "The Economist – The End Of Cheap Food". December 6, 2007.
- ↑ A Plan to Power 100 Percent of the Planet with Renewables
- ↑ ISBN 1-59102-591-5
- ↑ by George A Olah, Aiain Goeppert, G. K. Surya Prakash, ISBN 978-3-527-64463-6
- ↑ ISBN 978-0-9544529-3-3, chapter 16
- ↑ Solar Energy Facts
External links
Oil Education Television: Series of video interviews with leading international oil experts: http://oileducation.tv, https://www.youtube.com/oileducationtv
- http://www.oilposter.org – Free for teachers.
- Evolutionary psychology and peak oil: A Malthusian inspired "heads up" for humanity by Dr. Michael Mills
- Can The United States Drill Its Way to Energy Security? (from the December 2008 issue of the Journal of Energy Security)
- Peak Oil and Natural Gas Depletion: The world most serious question (Published June 12, 2003)
- Energy Export Databrowser - A visual review of production and consumption trends for individual nations; data from the British Petroleum Statistical Review.
| Core issues | 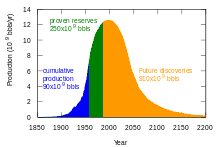 | |
|---|---|---|
| Results/responses | ||
| People | ||
| Books | ||
| Documentary films | ||
| Organizations | ||
| Other peaks | ||