Earthquake prediction
| Part of a series on |
| Earthquakes |
|---|
| Types |
|
|
| Causes |
| Characteristics |
|
|
| Measurement |
| Prediction |
|
|
| Other topics |
|
Earth Sciences Portal Category • Related topics |
Earthquake prediction is a branch of the science of seismology concerned with the specification of the time, location, and magnitude of future earthquakes within stated limits,[1] and particularly "the determination of parameters for the next strong earthquake to occur in a region.[2] Earthquake prediction is sometimes distinguished from earthquake forecasting, which can be defined as the probabilistic assessment of general earthquake hazard, including the frequency and magnitude of damaging earthquakes in a given area over years or decades.[3] Prediction can be further distinguished from earthquake warning systems, which upon detection of an earthquake, provide a real-time warning of seconds to neighboring regions that might be affected.
In the 1970s, scientists were optimistic that a practical method for predicting earthquakes would soon be found, but by the 1990s continuing failure led many to question whether it was even possible.[4] Demonstrably successful predictions of large earthquakes have not occurred and the few claims of success are controversial.[5] Extensive searches have reported many possible earthquake precursors, but, so far, such precursors have not been reliably identified across significant spatial and temporal scales.[6] While part of the scientific community hold that, taking into account non-seismic precursors and given enough resources to study them extensively, prediction might be possible, most scientists are pessimistic and some maintain that earthquake prediction is inherently impossible.[7]
Evaluating earthquake predictions
Predictions are deemed significant if they can be shown to be successful beyond random chance.[8] Therefore, methods of statistical hypothesis testing are used to determine the probability that an earthquake such as is predicted would happen anyway (the null hypothesis). The predictions are then evaluated by testing whether they correlate with actual earthquakes better than the null hypothesis.[9]
In many instances, however, the statistical nature of earthquake occurrence is not simply homogeneous. Clustering occurs in both space and time.[10] In southern California about 6% of M≥3.0 earthquakes are "followed by an earthquake of larger magnitude within 5 days and 10 km."[11] In central Italy 9.5% of M≥3.0 earthquakes are followed by a larger event within 30 km and 48 hours.[12] While such statistics are not satisfactory for purposes of prediction (giving ten to twenty false alarms for each successful prediction) they will skew the results of any analysis that assumes that earthquakes occur randomly in time, for example, as realized from a Poisson process. It has been shown that a "naive" method based solely on clustering can successfully predict about 5% of earthquakes;[13] slightly better than chance.
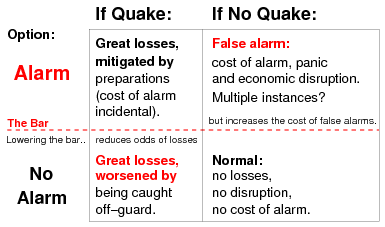
As the purpose of short-term prediction is to enable emergency measures to reduce death and destruction, failure to give warning of a major earthquake, that does occur, or at least an adequate evaluation of the hazard, can result in legal liability,[14] or even political purging.[15] But warning of an earthquake that does not occur also incurs a cost:[16] not only the cost of the emergency measures themselves, but of civil and economic disruption.[17] False alarms, including alarms that are cancelled, also undermine the credibility, and thereby the effectiveness, of future warnings.[18][19] The acceptable trade-off between missed quakes and false alarms depends on the societal valuation of these outcomes. The rate of occurrence of both must be considered when evaluating any prediction method.[20]
In a 1997 study of the cost-benefit ratio of earthquake prediction research in Greece, Stathis Stiros suggested that even a (hypothetical) excellent prediction method would be of questionable social utility, because "organized evacuation of urban centers is unlikely to be successfully accomplished", while "panic and other undesirable side-effects can also be anticipated." He found that earthquakes kill less than ten people per year in Greece (on average), and that most of those fatalities occurred in large buildings with identifiable structural issues. Therefore, Stiros stated that it would be much more cost-effective to focus efforts on identifying and upgrading unsafe buildings. Since the death toll on Greek highways is more than 2300 per year on average, he argued that more lives would also be saved if Greece's entire budget for earthquake prediction had been used for street and highway safety instead.[21]
Difficulty or impossibility
All predictions of the future can be to some extent successful by chance.
Earthquake prediction may be intrinsically impossible. It has been argued that the Earth is in a state of self-organized criticality "where any small earthquake has some probability of cascading into a large event".[22] It has also been argued on decision-theoretic grounds that prediction of major earthquakes is impossible.[23] However, these theories and their implication that earthquake prediction is intrinsically impossible have been disputed.[24]
Prediction methods
Earthquake prediction is an immature science—it has not yet led to a successful prediction of an earthquake from first physical principles. Research into methods of prediction therefore focus on empirical analysis, with two general approaches: either identifying distinctive precursors to earthquakes, or identifying some kind of geophysical trend or pattern in seismicity that might precede a large earthquake.[25] Precursor methods are pursued largely because of their potential utility for short-term earthquake prediction or forecasting, while 'trend' methods are generally thought to be useful for forecasting, long term prediction (10 to 100 years time scale) or intermediate term prediction (1 to 10 years time scale).[26][27]
Precursors
An earthquake precursor is an anomalous phenomenon that might give effective warning of an impending earthquake.[28] Reports of these – though generally recognized as such only after the event – number in the thousands,[29] some dating back to antiquity.[30] There have been around 400 reports of possible precursors in scientific literature, of roughly twenty different types,[31] running the gamut from aeronomy to zoology.[32] None have been found to be reliable for the purposes of earthquake prediction.[33]
In the early 1990, the IASPEI solicited nominations for a Preliminary List of Significant Precursors. Forty nominations were made, of which five were selected as possible significant precursors, with two of those based on a single observation each.[34]
After a critical review of the scientific literature the International Commission on Earthquake Forecasting for Civil Protection (ICEF) concluded in 2011 there was "considerable room for methodological improvements in this type of research."[35] In particular, many cases of reported precursors are contradictory, lack a measure of amplitude, or are generally unsuitable for a rigorous statistical evaluation. Published results are biased towards positive results, and so the rate of false negatives (earthquake but no precursory signal) is unclear.[36] Seiya Uyeda has suggested that a significant problem is that the vast majority of seismic data gathering stations are sensitive only to seismic and geodetic data, and are not configured to detect geo-electromagnetic signals or other precursors. Therefore, the required data for comprehensive and definitive studies does not exist.[37]
Animal behavior
For centuries there have been anecdotal accounts of anomalous animal behavior preceding and associated with earthquakes. In cases where animals display unusual behavior some tens of seconds prior to a quake, it has been suggested they are responding to the P-wave.[38] These travel through the ground about twice as fast as the S-waves that cause most severe shaking.[39] They predict not the earthquake itself — that has already happened — but only the imminent arrival of the more destructive S-waves.
It has also been suggested that unusual behavior hours or even days beforehand could be triggered by foreshock activity at magnitudes that most people do not notice.[40] Another confounding factor of accounts of unusual phenomena is skewing due to "flashbulb memories": otherwise unremarkable details become more memorable and more significant when associated with an emotionally powerful event such as an earthquake.[41] A study that attempted to control for these kinds of factors found an increase in unusual animal behavior (possibly triggered by foreshocks) in one case, but not in four other cases of seemingly similar earthquakes.[42]
Changes in Vp/Vs
Vp is the symbol for the velocity of a seismic "P" (primary or pressure) wave passing through rock, while Vs is the symbol for the velocity of the "S" (secondary or shear) wave. Small-scale laboratory experiments have shown that the ratio of these two velocities – represented as Vp/Vs – changes when rock is near the point of fracturing. In the 1970s it was considered a likely breakthrough when Russian seismologists reported observing such changes in the region of a subsequent earthquake.[43] This effect, as well as other possible precursors, has been attributed to dilatancy, where rock stressed to near its breaking point expands (dilates) slightly.[44]
Study of this phenomena near Blue Mountain Lake in New York State led to a successful prediction in 1973.[45] However, additional successes have not followed, and it has been suggested that the prediction was a fluke.[46] A Vp/Vs anomaly was the basis of a 1976 prediction of a M 5.5 to 6.5 earthquake near Los Angeles, which failed to occur.[47] Other studies relying on quarry blasts (more precise, and repeatable) found no such variations;[48] and an alternative explanation has been reported for such variations as have been observed.[49] Geller (1997) noted that reports of significant velocity changes have ceased since about 1980.
Radon emissions
Most rock contains small amounts of gases that can be isotopically distinguished from the normal atmospheric gases. There are reports of spikes in the concentrations of such gases prior to a major earthquake; this has been attributed to release due to pre-seismic stress or fracturing of the rock. One of these gases is radon, produced by radioactive decay of the trace amounts of uranium present in most rock.[50]
Radon is useful as a potential earthquake predictor because it is radioactive and thus easily detected,[51] and its short half-life (3.8 days) makes radon levels sensitive to short-term fluctuations. A 2009 review[52] found 125 reports of changes in radon emissions prior to 86 earthquakes since 1966. But as the ICEF found in its review, the earthquakes with which these changes are supposedly linked were up to a thousand kilometers away, months later, and at all magnitudes. In some cases the anomalies were observed at a distant site, but not at closer sites. The ICEF found "no significant correlation".[53] Another review concluded that in some cases changes in radon levels preceded an earthquake, but a correlation is not yet firmly established.[54]
Electromagnetic variations
Various attempts have been made to identify possible pre-seismic indications in electrical, electric-resistive, or magnetic phenomena.[55]
VAN method
The VAN method is named after the authors, P. Varotsos, K. Alexopoulos and K. Nomicos of the National and Capodistrian University of Athens. In a 1981 paper[56] they claimed that by measuring ultra low frequency geoelectric voltages – what they called "seismic electric signals" (SES) – they could predict earthquakes. In 1980s the VAN team published more on their research[57] and in 1990s they claimed they were able to predict earthquakes larger than magnitude 5, within 100 km of the epicentral location, within 0.7 units of magnitude up to several weeks beforehand, and published a series of predictions.[58]
Objections have been raised that the physics of the VAN method is not possible and the analysis of the propagation properties of SES in the Earth’s crust claimed that it would have been impossible for signals with the amplitude reported by VAN to have been transmitted over the several hundred kilometers distances from the epicenter to the monitoring station.[59][60] It was also claimed that VAN’s publications do not account for (i.e. identify and eliminate) possible sources of electromagnetic interference (EMI).[61]
Taken as a whole, the VAN method has been criticized as lacking consistency in the statistical testing of the validity of their hypotheses.[62] In particular, there has been some contention regarding the catalog of actual seismic events to use in vetting predictions, and of the predicted magnitudes.[63] A critical study found that, because of such ambiguities, a set of 22 claims of successful prediction by VAN were actually 74% false, 9% correlated at random and for 14% the correlation was uncertain.[64] Two major reviews of VAN appeared in 1996.[65][66][67]
Since 2001, the VAN group has introduced a concept they call "natural time", applied to the analysis of their precursors. Initially it is applied on SES to distinguish them from noise and relate them to a possible impending earthquake. In case of verification (classification as "SES activity"), natural time analysis is additionally applied to the general subsequent seismicity of the area associated with the SES activity, in order to improve the time parameter of the prediction. The method treats earthquake onset as a critical phenomenon.[68][69][70]
Background magnetic field noise disturbances
After the 1989 Loma Prieta earthquake occurred, a group led by Antony C. Fraser-Smith of Stanford University reported that the event was preceded by disturbances in background magnetic field noise as measured by a sensor placed in Corralitos, California, about 4.5 miles (7 km) from the epicenter.[71] From 5 October, they reported a substantial increase in noise in the frequency range 0.01–10 Hz. The measurement instrument was a single-axis search-coil magnetometer that was being used for low frequency research. Precursory increases of noise apparently started a few days before the earthquake, with noise in the range .01–.5 Hz rising to exceptionally high levels about three hours before the earthquake. Though this pattern gave scientists new ideas for research into potential precursors to earthquakes, and the Fraser-Smith et al. report remains one of the most frequently cited examples of a specific earthquake precursor, more recent studies have cast doubt on the connection, attributing the Corralitos signals to either unrelated magnetic disturbance[72] or, even more simply, to sensor-system malfunction.[73]
Trends
Instead of watching for anomalous phenomena that might be precursory signs of an impending earthquake, other approaches to predicting earthquakes look for trends or patterns that lead to an earthquake. As these trends may be complex and involve many variables, advanced statistical techniques are often needed to understand them, therefore these are sometimes called statistical methods. These approaches also tend to be more probabilistic, and to have larger time periods, and so merge into earthquake forecasting.
Elastic rebound
Even the stiffest of rock is not perfectly rigid. Given a large force (such as between two immense tectonic plates moving past each other) the earth's crust will bend or deform. According to the elastic rebound theory of Reid (1910), eventually the deformation (strain) becomes great enough that something breaks, usually at an existing fault. Slippage along the break (an earthquake) allows the rock on each side to rebound to a less deformed state. In the process energy is released in various forms, including seismic waves.[74] The cycle of tectonic force being accumulated in elastic deformation and released in a sudden rebound is then repeated. As the displacement from a single earthquake ranges from less than a meter to around 10 meters (for an M 8 quake),[75] the demonstrated existence of large strike-slip displacements of hundreds of miles shows the existence of a long running earthquake cycle.[76]
Characteristic earthquakes
The most studied earthquake faults (such as the Nankai megathrust, the Wasatch fault, and the San Andreas fault) appear to have distinct segments. The characteristic earthquake model postulates that earthquakes are generally constrained within these segments.[77] As the lengths and other properties[78] of the segments are fixed, earthquakes that rupture the entire fault should have similar characteristics. These include the maximum magnitude (which is limited by the length of the rupture), and the amount of accumulated strain needed to rupture the fault segment. Since continuous plate motions cause the strain to accumulate steadily, seismic activity on a given segment should be dominated by earthquakes of similar characteristics that recur at somewhat regular intervals.[79] For a given fault segment, identifying these characteristic earthquakes and timing their recurrence rate (or conversely return period) should therefore inform us about the next rupture; this is the approach generally used in forecasting seismic hazard. UCERF3 is a notable example of such a forecast, prepared for the state of California.[80] Return periods are also used for forecasting other rare events, such as cyclones and floods, and assume that future frequency will be similar to observed frequency to date.
The idea of characteristic earthquakes was the basis of the Parkfield prediction: fairly similar earthquakes in 1857, 1881, 1901, 1922, 1934, and 1966 suggested a pattern of breaks every 21.9 years, with a standard deviation of ±3.1 years.[81] Extrapolation from the 1966 event led to a prediction of an earthquake around 1988, or before 1993 at the latest (at the 95% confidence interval).[82] The appeal of such a method is that the prediction is derived entirely from the trend, which supposedly accounts for the unknown and possibly unknowable earthquake physics and fault parameters. However, in the Parkfield case the predicted earthquake did not occur until 2004, a decade late. This seriously undercuts the claim that earthquakes at Parkfield are quasi-periodic, and suggests the individual events differ sufficiently in other respects to question whether they have distinct characteristics in common.[83]
Further research into the Parkfield seismic data revealed that several 4.0 earthquakes had reduced the stresses on the northwest portion of the Parkfield segment, causing it to skip generating the predicted 6.0 earthquake.[84]
The failure of the Parkfield prediction has raised doubt as to the validity of the characteristic earthquake model itself.[85] Some studies have questioned the various assumptions, including the key one that earthquakes are constrained within segments, and suggested that the "characteristic earthquakes" may be an artifact of selection bias and the shortness of seismological records (relative to earthquake cycles).[86] Other studies have considered whether other factors need to be considered, such as the age of the fault.[87] Whether earthquake ruptures are more generally constrained within a segment (as is often seen), or break past segment boundaries (also seen), has a direct bearing on the degree of earthquake hazard: earthquakes are larger where multiple segments break, but in relieving more strain they will happen less often.[88]
Seismic gaps
At the contact where two tectonic plates slip past each other every section must eventually slip, as (in the long-term) none get left behind. But they do not all slip at the same time; different sections will be at different stages in the cycle of strain (deformation) accumulation and sudden rebound. In the seismic gap model the "next big quake" should be expected not in the segments where recent seismicity has relieved the strain, but in the intervening gaps where the unrelieved strain is the greatest.[89] This model has an intuitive appeal; it is used in long-term forecasting, and was the basis of a series of circum-Pacific (Pacific Rim) forecasts in 1979 and 1989–1991.[90]
However, some underlying assumptions about seismic gaps are now known to be incorrect. A close examination suggests that "there may be no information in seismic gaps about the time of occurrence or the magnitude of the next large event in the region";[91] statistical tests of the circum-Pacific forecasts shows that the seismic gap model "did not forecast large earthquakes well".[92] Another study concluded that a long quiet period did not increase earthquake potential.[93]
Seismicity patterns
Various heuristically derived algorithms have been developed for predicting earthquakes. Probably the most widely known is the M8 family of algorithms (including the RTP method) developed under the leadership of Vladimir Keilis-Borok. M8 issues a "Time of Increased Probability" (TIP) alarm for a large earthquake of a specified magnitude upon observing certain patterns of smaller earthquakes. TIPs generally cover large areas (up to a thousand kilometers across) for up to five years.[94] Such large parameters have made M8 controversial, as it is hard to determine whether any hits that happened were skillfully predicted, or only the result of chance.
M8 gained considerable attention when the 2003 San Simeon and Hokkaido earthquakes occurred within a TIP.[95] In 1999, Keilis-Borok's group published a claim to have achieved statistically significant intermediate-term results using their M8 and MSc models, as far as world-wide large earthquakes are regarded.[96] However, Geller et al.[97] are skeptical of prediction claims over any period shorter than 30 years. A widely publicized TIP for an M 6.4 quake in Southern California in 2004 was not fulfilled, nor two other lesser known TIPs.[98] A deep study of the RTP method in 2008 found that out of some twenty alarms only two could be considered hits (and one of those had a 60% chance of happening anyway).[99] It concluded that "RTP is not significantly different from a naïve method of guessing based on the historical rates [of] seismicity."[100]
Accelerating moment release (AMR, "moment" being a measurement of seismic energy), also known as time-to-failure analysis, or accelerating seismic moment release (ASMR), is based on observations that foreshock activity prior to a major earthquake not only increased, but increased at an exponential rate.[101] In other words, a plot of the cumulative number of foreshocks gets steeper just before the main shock.
Following formulation by Bowman et al. (1998) into a testable hypothesis,[102] and a number of positive reports, AMR seemed promising[103] despite several problems. Known issues included not being detected for all locations and events, and the difficulty of projecting an accurate occurrence time when the tail end of the curve gets steep.[104] But rigorous testing has shown that apparent AMR trends likely result from how data fitting is done,[105] and failing to account for spatiotemporal clustering of earthquakes.[106] The AMR trends are therefore statistically insignificant. Interest in AMR (as judged by the number of peer-reviewed papers) has fallen off since 2004.[107]
The occurrence of foreshocks has long been thought to be the most promising avenue in predicting earthquakes. A foreshock is a smaller earthquake that can strike minutes or days before a larger one. Because the rupture process for the earthquakes is still not completely clear, foreshock occurrence may give clues into an earthquake-triggering process. In the Non-Critical Precursory Accelerating Seismicity Theory (N-C PAST), foreshocks happen because of the constant buildup of pressure along the fault lines.[108] This theory is given weight due to seismic measurements. This had led to the conclusion for some scientists that foreshocks are a precursor to a larger event, and should be further studied and considered in earthquake prediction.
Notable predictions
These are predictions, or claims of predictions, that are notable either scientifically or because of public notoriety, and claim a scientific or quasi-scientific basis. As many predictions are held confidentially, or published in obscure locations, and become notable only when they are claimed, there may be a selection bias in that hits get more attention than misses. The predictions listed here are discussed in Hough's book[109] and Geller's paper.[110]
1975: Haicheng, China
The M 7.3 1975 Haicheng earthquake is the most widely cited "success" of earthquake prediction.[111] Study of seismic activity in the region led the Chinese authorities to issue a medium-term prediction in June 1974. The political authorities therefore ordered various measures taken, including enforced evacuation of homes, construction of "simple outdoor structures", and showing of movies out-of-doors. The quake, striking at 19:36, was powerful enough to destroy or badly damage about half of the homes. However, the "effective preventative measures taken" were said to have kept the death toll under 300 in an area with population of about 1.6 million, where otherwise tens of thousands of fatalities might have been expected.[112]
However, although a major earthquake occurred, there has been some skepticism about the narrative of measures taken on the basis of a timely prediction. This event occurred during the Cultural Revolution, when "belief in earthquake prediction was made an element of ideological orthodoxy that distinguished the true party liners from right wing deviationists".[113] Recordkeeping was disordered, making it difficult to verify details, including whether there was any ordered evacuation. The method used for either the medium-term or short-term predictions (other than "Chairman Mao's revolutionary line"[114]) has not been specified.[115] The evacuation may have been spontaneous, following the strong (M 4.7) foreshock that occurred the day before.[116]
A 2006 study that had access to an extensive range of records found that the predictions were flawed. "In particular, there was no official short-term prediction, although such a prediction was made by individual scientists."[117] Also: "it was the foreshocks alone that triggered the final decisions of warning and evacuation". They estimated that 2,041 lives were lost. That more did not die was attributed to a number of fortuitous circumstances, including earthquake education in the previous months (prompted by elevated seismic activity), local initiative, timing (occurring when people were neither working nor asleep), and local style of construction. The authors conclude that, while unsatisfactory as a prediction, "it was an attempt to predict a major earthquake that for the first time did not end up with practical failure."
1985–1993: Parkfield, U.S. (Bakun-Lindh)
The "Parkfield earthquake prediction experiment" was the most heralded scientific earthquake prediction ever.[118] It was based on an observation that the Parkfield segment of the San Andreas Fault[119] breaks regularly with a moderate earthquake of about M 6 every several decades: 1857, 1881, 1901, 1922, 1934, and 1966.[120] More particularly, Bakun & Lindh (1985) pointed out that, if the 1934 quake is excluded, these occur every 22 years, ±4.3 years. Counting from 1966, they predicted a 95% chance that the next earthquake would hit around 1988, or 1993 at the latest. The National Earthquake Prediction Evaluation Council (NEPEC) evaluated this, and concurred.[121] The U.S. Geological Survey and the State of California therefore established one of the "most sophisticated and densest nets of monitoring instruments in the world",[122] in part to identify any precursors when the quake came. Confidence was high enough that detailed plans were made for alerting emergency authorities if there were signs an earthquake was imminent.[123] In the words of the Economist: "never has an ambush been more carefully laid for such an event."[124]
1993 came, and passed, without fulfillment. Eventually there was an M 6.0 earthquake on the Parkfield segment of the fault, on 28 September 2004, but without forewarning or obvious precursors.[125] While the experiment in catching an earthquake is considered by many scientists to have been successful,[126] the prediction was unsuccessful in that the eventual event was a decade late.[127]
1983–1995: Greece (VAN)
In 1981, the "VAN" group, headed by Panayiotis Varotsos, said that they found a relationship between earthquakes and 'seismic electric signals' (SES). In 1984 they claimed there was a "one-to-one correspondence" between SES and earthquakes",[128] – that is, that "every sizable EQ is preceded by an SES and inversely every SES is always followed by an EQ the magnitude and the epicenter of which can be reliably predicted"[129] – the SES appearing between six and 115 hours before the earthquake.[130] (see electromagnetic variations, above). As validation they presented a table of 23 earthquakes from 19 January 1983 to 19 September 1983, of which they claimed to have successfully predicted 18 earthquakes.[131] Their report was "saluted by some as a major breakthrough", but was greeted by a "wave of generalized skepticism" among seismologists.[132]
Other lists followed, such as their 1991 claim of predicting six out of seven earthquakes with Ms ≥ 5.5 in the period of 1 April 1987 through 10 August 1989, or five out of seven earthquakes with Ms ≥ 5.3 in the overlapping period of 15 May 1988 to 10 August 1989,[133] In 1996 they published a "Summary of all Predictions issued from January 1st, 1987 to June 15, 1995",[134] amounting to 94 predictions.[135] Matching this against a list of "All earthquakes with MS(ATH)"[136] and within geographical bounds including most of Greece[137] they come up with a list of 14 earthquakes they should have predicted. Here they claim ten successes, for a success rate of 70%, but also a false alarm rate of 89%.[138]
The VAN predictions have been criticized on various grounds, including being geophysically implausible,[139] "vague and ambiguous",[140] failing to satisfy prediction criteria,[141] and retroactive adjustment of parameters.[142] A critical review of 14 cases where VAN claimed 10 successes showed only one case where an earthquake occurred within the prediction parameters.[143] The VAN predictions not only fail to do better than chance, but show "a much better association with the events which occurred before them", according to Mulargia and Gasperini.[144] Other early reviews found that the VAN results, when evaluated by definite parameters, were statistically significant.[145][146] Both positive and negative views on VAN predictions from this period were summarized in the 1996 book "A Critical Review of VAN" edited by Sir James Lighthill[147] and in a debate issue presented by the journal Geophysical Research Letters that was focused on the statistical significance of the VAN method.[148][149] VAN had the opportunity to reply to their critics in those review publications.[150] In 2011, the ICEF reviewed the 1996 debate, and concluded that the optimistic SES prediction capability claimed by VAN could not be validated.[151]
A crucial issue is the large and often indeterminate parameters of the predictions,[152] such that some critics say these are not predictions, and should not be recognized as such.[153] Much of the controversy with VAN arises from this failure to adequately specify these parameters. Some of their telegrams include predictions of two distinct earthquake events, such as (typically) one earthquake predicted at 300 km "N.W" of Athens, and another at 240 km "W", "with magnitutes [sic] 5,3 and 5,8", with no time limit.[154][155]
VAN has disputed the 'pessimistic' conclusions of their critics, but the critics have not relented.[156] It was suggested that VAN failed to account for clustering of earthquakes,[157] or that they interpreted their data differently during periods of greater seismic activity.[158]
VAN has been criticized on several occasions for causing public panic and widespread unrest.[159] This has been exacerbated by the broadness of their predictions, which cover large areas of Greece (up to 240 kilometers across, and often pairs of areas),[160] much larger than the areas actually affected by earthquakes of the magnitudes predicted (usually several tens of kilometers across).[161] Magnitudes are similarly broad: a predicted magnitude of "6.0" represents a range from a benign magnitude 5.3 to a broadly destructive 6.7.[162] Coupled with indeterminate time windows of a month or more,[163] such predictions "cannot be practically utilized"[164] to determine an appropriate level of preparedness, whether to curtail usual societal functioning, or even to issue public warnings.[165]
2008: Greece (VAN)
After 2006, VAN claim that all alarms related to SES activity have been made public by posting at arxiv.org. Such SES activity is evaluated using a new method they call 'natural time'. One such report was posted on Feb. 1, 2008, two weeks before the strongest earthquake in Greece during the period 1983-2011. This earthquake occurred on February 14, 2008, with magnitude (Mw) 6.9. VAN's report was also described in an article in the newspaper Ethnos on Feb. 10, 2008.[166][167][168][169] However, Gerassimos Papadopolous complained that the VAN reports were confusing and ambiguous, and that "none of the claims for successful VAN predictions is justified."[170]
1989: Loma Prieta, U.S.
The 1989 Loma Prieta earthquake (epicenter in the Santa Cruz Mountains northwest of San Juan Bautista, California) caused significant damage in the San Francisco Bay Area of California.[171] The U.S. Geological Survey (USGS) reportedly claimed, twelve hours after the event, that it had "forecast" this earthquake in a report the previous year.[172] USGS staff subsequently claimed this quake had been "anticipated";[173] various other claims of prediction have also been made.[174]
Harris (1998) reviewed 18 papers (with 26 forecasts) dating from 1910 "that variously offer or relate to scientific forecasts of the 1989 Loma Prieta earthquake." (In this case no distinction is made between a forecast, which is limited to a probabilistic estimate of an earthquake happening over some time period, and a more specific prediction.[175]) None of these forecasts can be rigorously tested due to lack of specificity,[176] and where a forecast does bracket the correct time and location, the window was so broad (e.g., covering the greater part of California for five years) as to lose any value as a prediction. Predictions that came close (but given a probability of only 30%) had ten- or twenty-year windows.[177]
One debated prediction came from the M8 algorithm used by Keilis-Borok and associates in four forecasts.[178] The first of these forecasts missed both magnitude (M 7.5) and time (a five-year window from 1 January 1984, to 31 December 1988). They did get the location, by including most of California and half of Nevada.[179] A subsequent revision, presented to the NEPEC, extended the time window to 1 July 1992, and reduced the location to only central California; the magnitude remained the same. A figure they presented had two more revisions, for M ≥ 7.0 quakes in central California. The five-year time window for one ended in July 1989, and so missed the Loma Prieta event; the second revision extended to 1990, and so included Loma Prieta.[180]
When discussing success or failure of prediction for the Loma Prieta earthquake, some scientists argue that it did not occur on the San Andreas fault (the focus of most of the forecasts), and involved dip-slip (vertical) movement rather than strike-slip (horizontal) movement, and so was not predicted.[181] Other scientists argue that it did occur in the San Andreas fault zone, and released much of the strain accumulated since the 1906 San Francisco earthquake; therefore several of the forecasts were correct.[182] Hough states that "most seismologists" do not believe this quake was predicted "per se".[183] In a strict sense there were no predictions, only forecasts, which were only partially successful.
Iben Browning claimed to have predicted the Loma Prieta event, but (as will be seen in the next section) this claim has been rejected.
1990: New Madrid, U.S. (Browning)
Dr. Iben Browning (a scientist with a Ph.D. degree in zoology and training as a biophysicist, but no experience in geology, geophysics, or seismology) was an "independent business consultant" who forecast long-term climate trends for businesses.[184] He supported the idea (scientifically unproven) that volcanoes and earthquakes are more likely to be triggered when the tidal force of the sun and the moon coincide to exert maximum stress on the earth's crust (syzygy).[185] Having calculated when these tidal forces maximize, Browning then "projected"[186] what areas were most at risk for a large earthquake. An area he mentioned frequently was the New Madrid Seismic Zone at the southeast corner of the state of Missouri, the site of three very large earthquakes in 1811–12, which he coupled with the date of 3 December 1990.
Browning's reputation and perceived credibility were boosted when he claimed in various promotional flyers and advertisements to have predicted (among various other events[187]) the Loma Prieta earthquake of 17 October 1989.[188] The National Earthquake Prediction Evaluation Council (NEPEC) formed an Ad Hoc Working Group (AHWG) to evaluate Browning's prediction. Its report (issued 18 October 1990) specifically rejected the claim of a successful prediction of the Loma Prieta earthquake.[189] A transcript of his talk in San Francisco on 10 October showed he had said: "there will probably be several earthquakes around the world, Richter 6+, and there may be a volcano or two" – which, on a global scale, is about average for a week – with no mention of any earthquake in California.[190]
Though the AHWG report disproved both Browning's claims of prior success and the basis of his "projection", it made little impact after a year of continued claims of a successful prediction. Browning's prediction received the support of geophysicist David Stewart,[191] and the tacit endorsement of many public authorities in their preparations for a major disaster, all of which was amplified by massive exposure in the news media.[192] Nothing happened on 3 December,[193] and Browning died of a heart attack seven months later.[194]
2004 & 2005: Southern California, U.S. (Keilis-Borok)
The M8 algorithm (developed under the leadership of Dr. Vladimir Keilis-Borok at UCLA) gained respect by the apparently successful predictions of the 2003 San Simeon and Hokkaido earthquakes.[195] Great interest was therefore generated by the prediction in early 2004 of a M ≥ 6.4 earthquake to occur somewhere within an area of southern California of approximately 12,000 sq. miles, on or before 5 September 2004.[95] In evaluating this prediction the California Earthquake Prediction Evaluation Council (CEPEC) noted that this method had not yet made enough predictions for statistical validation, and was sensitive to input assumptions. It therefore concluded that no "special public policy actions" were warranted, though it reminded all Californians "of the significant seismic hazards throughout the state."[196] The predicted earthquake did not occur.
A very similar prediction was made for an earthquake on or before 14 August 2005, in approximately the same area of southern California. The CEPEC's evaluation and recommendation were essentially the same, this time noting that the previous prediction and two others had not been fulfilled.[197] This prediction also failed.
2009: L'Aquila, Italy (Giuliani)
At 03:32 on 6 April 2009, the Abruzzo region of central Italy was rocked by a magnitude M 6.3 earthquake.[198] In the city of L'Aquila and surrounding area around 60,000 buildings collapsed or were seriously damaged, resulting in 308 deaths and 67,500 people left homeless.[199] Around the same time, it was reported that Giampaolo Giuliani had predicted the earthquake, had tried to warn the public, but had been muzzled by the Italian government.[200]
Giampaolo Giuliani was a laboratory technician at the Laboratori Nazionali del Gran Sasso. As a hobby he had for some years been monitoring radon using instruments he had designed and built. Prior to the L'Aquila earthquake he was unknown to the scientific community, and had not published any scientific work.[201] He had been interviewed on 24 March by an Italian-language blog, Donne Democratiche, about a swarm of low-level earthquakes in the Abruzzo region that had started the previous December. He said that this swarm was normal and would diminish by the end of March. On 30 March, L'Aquila was struck by a magnitude 4.0 temblor, the largest to date.[202]
On 27 March Giuliani warned the mayor of L'Aquila there could be an earthquake within 24 hours, and an earthquake M~2.3 occurred.[203] On 29 March he made a second prediction.[204] He telephoned the mayor of the town of Sulmona, about 55 kilometers southeast of L'Aquila, to expect a "damaging" – or even "catastrophic" – earthquake within 6 to 24 hours. Loudspeaker vans were used to warn the inhabitants of Sulmona to evacuate, with consequential panic. No quake ensued and Giuliano was cited for inciting public alarm and enjoined from making future public predictions.[205]
After the L'Aquila event Giuliani claimed that he had found alarming rises in radon levels just hours before.[206] He said he had warned relatives, friends and colleagues on the evening before the earthquake hit.[207] He was subsequently interviewed by the International Commission on Earthquake Forecasting for Civil Protection, which found that Giuliani had not transmitted a valid prediction of the mainshock to the civil authorities before its occurrence.[208]
See also
- 2008 California earthquake study
- Binary classification
- California earthquake forecast
- Classification rule
- Coordinating Committee for Earthquake Prediction, Japan
- Earthquake engineering
- Earthquake weather
- Forecasting
- National Earthquake Prediction Evaluation Council
- Ring of Fire
- Seismo-electromagnetics
- Supermoon
- Type I and type II errors
Notes
- ↑ Geller et al. 1997, p. 1616, following Allen (1976, p. 2070), who in turn followed Wood & Gutenberg (1935). Kagan (1997b, §2.1) says: "This definition has several defects which contribute to confusion and difficulty in prediction research." In addition to specification of time, location, and magnitude, Allen suggested three other requirements: 4) indication of the author's confidence in the prediction, 5) the chance of an earthquake occurring anyway as a random event, and 6) publication in a form that gives failures the same visibility as successes. Kagan & Knopoff (1987, p. 1563) define prediction (in part) "to be a formal rule where by the available space-time-seismic moment manifold of earthquake occurrence is significantly contracted ...."
- ↑ Kagan 1997b, p. 507.
- ↑ Kanamori 2003, p. 1205. See also ICEF 2011, (p. 327), which distinguishes between predictions (as deterministic) and forecasts (as probabilistic). Not all scientists distinguish "prediction" and "forecast", but it is useful, and will be observed in this article.
- ↑ Geller et al. 1997, p. 1617; Geller 1997, §2.3, p. 427; Console 2001, p. 261.
- ↑ E.g., the most famous claim of a successful prediction is that alleged for the 1975 Haicheng earthquake (ICEF 2011, p. 328), and is now listed as such in textbooks (Jackson2004, p. 344). A later study concluded there was no valid short-term prediction (Wang et al. 2006), as described in more detail below.
- ↑ Geller 1997, Summary.
- ↑ Kagan 1997b; Geller 1997. See also Nature Debates; Uyeda, Nagao & Kamogawa 2009. "...at the present stage, the general view on short-term prediction is overly pessimistic. There are reasons for this pessimism because mere conventional seismological approach is not efficient for this aim. Overturning this situation is possible only through multi-disciplinary science. Despite fairly abundant circumstantial evidence, pre-seismic EM signals have not yet been adequately accepted as real physical quantities."
- ↑ Mulargia & Gasperini 1992, p. 32; Luen & Stark 2008, p. 302.
- ↑ Luen & Stark 2008; Console 2001.
- ↑ Jackson 1996a, p. 3775.
- ↑ Jones 1985, p. 1669.
- ↑ Console 2001, p. 1261.
- ↑ Luen & Stark 2008. This was based on data from Southern California.
- ↑ The manslaughter convictions against the seven scientists and technicians in Italy are not for failing to predict the L'Aquila earthquake (where some 300 people died) as for giving undue assurance to the populace – one victim called it "anaesthetizing" – that there would not be a serious earthquake, and therefore no need to take precautions. Hall 2011; Cartlidge 2011. Additional details in Cartlidge 2012.
- ↑ It has been reported that members of the Chinese Academy of Sciences were purged for "having ignored scientific predictions of the disastrous Tangshan earthquake of summer 1976." Wade 1977.
- ↑ In January 1999 there was a report (Saegusa 1999) that China was introducing "tough regulations intended to stamp out ‘false’ earthquake warnings, in order to prevent panic and mass evacuation of cities triggered by forecasts of major tremors." This was prompted by "more than 30 unofficial earthquake warnings ... in the past three years, none of which has been accurate."
- ↑ Geller 1997, §5.2, p. 437.
- ↑ Atwood & Major 1998.
- ↑ However, Mileti and Sorensen have argued that the extent of panic related to public disaster forecasts, and the 'cry wolf' problem with respect to repeated false alarms, have both been overestimated, and can be mitigated through appropriate communications from the authorities. Mileti & Sorensen 1990.
- ↑ Mason 2003, p. 48 and through out.
- ↑ Stiros 1997, p. 483.
- ↑ Geller et al. 1997, p. 1616; Kagan 1997b, p. 517. See also Kagan 1997b, p. 520, Vidale 1996 and especially Geller 1997, §9.1, "Chaos, SOC, and predictability".
- ↑ Matthews 1997.
- ↑ E.g., Sykes, Shaw & Scholz 1999 and Evison 1999.
- ↑ PEP 1976, p. 9.
- ↑ Uyeda, Nagao & Kamogawa 2009
- ↑ Hayakawa 2015
- ↑ The IASPEI Sub-Commission for Earthquake Prediction defined a precursor as "a quantitatively measurable change in an environmental parameter that occurs before mainshocks, and that is thought to be linked to the preparation process for this mainshock." Geller 1997, §3.1
- ↑ Geller 1997, p. 429, §3.
- ↑ E.g., Claudius Aelianus, in De natura animalium, book 11, commenting on the destruction of Helike in 373 BC, but writing five centuries later.
- ↑ Rikitake 1979, p. 294. Cicerone, Ebel & Britton 2009 has a more recent compilation
- ↑ Jackson2004, p. 335.
- ↑ Geller (1997, p. 425). See also: Jackson2004 (, p. 348): "The search for precursors has a checkered history, with no convincing successes." Zechar & Jordan (2008, p. 723): "The consistent failure to find reliable earthquake precursors...". ICEF (2009): "... no convincing evidence of diagnostic precursors."
- ↑ Wyss & Booth 1997, p. 424.
- ↑ ICEF 2011, p. 338.
- ↑ ICEF 2011, p. 361.
- ↑ Uyeda, Nagao & Kamogawa 2009
- ↑ ICEF 2011, p. 336; Lott, Hart & Howell 1981, p. 1204.
- ↑ Bolt 1993, pp. 30–32.
- ↑ Lott, Hart & Howell 1981.
- ↑ Brown & Kulik 1977.
- ↑ Lott, Hart & Howell 1981. In an earlier study similar behavior was seen before storms. Lott et al. 1979, p. 687.
- ↑ Hammond 1973. Additional references in Geller 1997, §2.4.
- ↑ Scholz, Sykes & Aggarwal 1973.
- ↑ Aggarwal et al. 1975.
- ↑ Hough 2010b, p. 110.
- ↑ Allen 1983, p. 79; Whitcomb 1977.
- ↑ McEvilly & Johnson 1974.
- ↑ Lindh, Lockner & Lee 1978.
- ↑ ICEF 2011, p. 333. For a fuller account of radon as an earthquake precursor see Immè & Morelli 2012.
- ↑ Giampaolo Giuiliani's claimed prediction of the L'Aquila earthquake was based on monitoring of radon levels.
- ↑ Cicerone, Ebel & Britton 2009, p. 382.
- ↑ ICEF 2011, p. 334. See also Hough 2010b, pp. 93–95.
- ↑ Immè & Morelli 2012, p. 158.
- ↑ Park 1996.
- ↑ Varotsos, Alexopoulos & Nomicos 1981, described by Mulargia & Gasperini 1992, p. 32, and Kagan 1997b, §3.3.1, p. 512.
- ↑ Varotsos & Alexopoulos 1984a; Varotsos et al. 1986.
- ↑ Varotsos & Lazaridou 1991; Varotsos, Alexopoulos & Lazaridou 1993.
- ↑ Bernard 1992; Bernard & LeMouel 1996.
- ↑ However, the VAN group claims that SES signals mainly travel through fault zones whose conductivity exceeds significantly, i.e., by a factor 102 to 103, the conductivity of the surrounding medium.Varotsos et al. 1998; Sarlis et al. 1999.
- ↑ However, VAN also claim to have derived and published criteria that can clearly distinguish SES from other electric signals of no precursory nature.Varotsos & Lazaridou 1991; Varotsos, Alexopoulos & Lazaridou 1993
- ↑ Mulargia & Gasperini 1992; Mulargia & Gasperini 1996a; Wyss 1996; Kagan 1997b.
- ↑ Mulargia & Gasperini 1992; Mulargia & Gasperini 1996a; Wyss 1996; Wyss & Allmann 1996; Kagan 1997b.
- ↑ Wyss & Allmann 1996.
- ↑ Lighthill 1996.
- ↑ See the table of contents.
- ↑ Varotsos & Lazaridou 1996b; Varotsos, Eftaxias & Lazaridou 1996.
- ↑ Varotsos, Sarlis & Skordas 2002; Varotsos 2006.
- ↑ Rundle et al. 2012.
- ↑ Huang 2015.
- ↑ Fraser-Smith et al. 1990
- ↑ Campbell 2009
- ↑ Thomas et al. 2009
- ↑ Reid 1910, p. 22; ICEF 2011, p. 329.
- ↑ Wells & Coppersmith 1994, Fig. 11, p. 993.
- ↑ Zoback 2006 provides a clear explanation. Evans 1997, §2.2 also provides a description of the "self-organized criticality" (SOC) paradigm that is displacing the elastic rebound model.
- ↑ Castellaro 2003
- ↑ These include the type of rock and fault geometry.
- ↑ Schwartz & Coppersmith 1984; Tiampo & Shcherbakov 2012, p. 93, §2.2.
- ↑ UCERF 2008.
- ↑ Bakun & Lindh 1985, p. 619. Of course these were not the only earthquakes in this period. The attentive reader will recall that, in seismically active areas, earthquakes of some magnitude happen fairly constantly. The "Parkfield earthquakes" are either the ones noted in the historical record, or were selected from the instrumental record on the basis of location and magnitude. Jackson & Kagan (2006, p. S399) and Kagan (1997, pp. 211–212, 213) argue that the selection parameters can bias the statistics, and that sequences of four or six quakes, with different recurrence intervals, are also plausible.
- ↑ Bakun & Lindh 1985, p. 621.
- ↑ Jackson & Kagan 2006, p. S408 say the claim of quasi-periodicity is "baseless".
- ↑ Brown E. (May 11, 2012). "Quake study offers new clues on a California fault's mystery". Los Angelel Times. Retrieved 30 March 2015.
- ↑ Jackson & Kagan 2006.
- ↑ Kagan & Jackson 1991, pp. 21,420; Stein, Friedrich & Newman 2005; Jackson & Kagan 2006; Tiampo & Shcherbakov 2012, §2.2, and references there; Kagan, Jackson & Geller 2012. See also the Nature debates.
- ↑ Young faults are expected to have complex, irregular surfaces, which impede slippage. In time these rough spots are ground off, changing the mechanical characteristics of the fault. Cowan, Nicol & Tonkin 1996; Stein & Newman 2004, p. 185.
- ↑ Stein & Newman 2004
- ↑ Scholz 2002, p. 284, §5.3.3; Kagan & Jackson 1991, pp. 21,419; Jackson & Kagan 2006, p. S404.
- ↑ Kagan & Jackson 1991, pp. 21,419; McCann et al. 1979; Rong, Jackson & Kagan 2003.
- ↑ Lomnitz & Nava 1983.
- ↑ Rong, Jackson & Kagan 2003, p. 23.
- ↑ Kagan & Jackson 1991, Summary.
- ↑ See details in Tiampo & Shcherbakov 2012, §2.4.
- 1 2 CEPEC 2004a.
- ↑ Kossobokov, V.G.; Romashkova, L.L.; Keilis-Borok, V. I.; Healy, J.H. (1999-01-01). "Testing earthquake prediction algorithms: Statistically significant advance prediction of the largest earthquakes in the Circum-Pacific, 1992-1997". Physics of the Earth and Planetary Interiors. 111 (3-4). doi:10.1016/S0031-9201(98)00159-9.
- ↑ Geller et al. 1997
- ↑ Hough 2010b, pp. 142–149.
- ↑ Zechar 2008; Hough 2010b, pp. 145.
- ↑ Zechar 2008, p. 7. See also p. 26.
- ↑ Tiampo & Shcherbakov 2012, §2.1. Hough 2010b, chapter 12, provides a good description.
- ↑ Hardebeck, Felzer & Michael 2008, par. 6
- ↑ Hough 2010b, pp. 154–155.
- ↑ Tiampo & Shcherbakov 2012, §2.1, p. 93.
- ↑ Hardebeck, Felzer & Michael (2008, §4) show how suitable selection of parameters shows "DMR": Decelerating Moment Release.
- ↑ Hardebeck, Felzer & Michael 2008, par. 1, 73.
- ↑ Mignan 2011, Abstract.
- ↑ Mignan 2013
- ↑ Hough 2010b
- ↑ Geller 1997, §4.
- ↑ E.g.: Davies 1975; Whitham et al. 1976, p. 265; Hammond 1976; Ward 1978; Kerr 1979, p. 543; Allen 1982, p. S332; Rikitake 1982; Zoback 1983; Ludwin 2001; Jackson2004, pp. 335, 344; ICEF 2011, p. 328.
- ↑ Whitham et al. 1976, p. 266 provide a brief report. The report of the Haicheng Earthquake Study Delegation (Anonymous 1977) has a fuller account. Wang et al. (2006, p. 779), after careful examination of the records, set the death toll at 2,041.
- ↑ Raleigh et al. (1977), quoted in Geller 1997, p 434. Geller has a whole section (§4.1) of discussion and many sources. See also Kanamori 2003, pp. 1210-11.
- ↑ Quoted in Geller 1997, p. 434. Lomnitz (1994, Ch. 2) describes some of circumstances attending to the practice of seismology at that time; Turner 1993, pp. 456–458 has additional observations.
- ↑ Measurement of an uplift has been claimed, but that was 185 km away, and likely surveyed by inexperienced amateurs. Jackson2004, p. 345.
- ↑ Kanamori 2003, p. 1211. According to Wang et al. 2006 foreshocks were widely understood to precede a large earthquake, "which may explain why various [local authorities] made their own evacuation decisions" (p. 762).
- ↑ Wang et al. 2006, p. 785.
- ↑ Geller (1997, §6) describes some of the coverage. The most anticipated prediction ever is likely Iben Browning's 1990 New Madrid prediction (discussed below), but it lacked any scientific basis.
- ↑ Near the small town of Parkfield, California, roughly halfway between San Francisco and Los Angeles.
- ↑ Bakun & McEvilly 1979; Bakun & Lindh 1985; Kerr 1984.
- ↑ Bakun et al. 1987.
- ↑ Kerr 1984, "How to Catch an Earthquake". See also Roeloffs & Langbein 1994.
- ↑ Roeloffs & Langbein 1994, p. 316.
- ↑ Quoted by Geller 1997, p. 440.
- ↑ Kerr 2004; Bakun et al. 2005, Harris & Arrowsmith 2006, p. S5.
- ↑ Hough 2010b, p. 52.
- ↑ It has also been argued that the actual quake differed from the kind expected (Jackson & Kagan 2006), and that the prediction was no more significant than a simpler null hypothesis (Kagan 1997).
- ↑ Varotsos & Alexopoulos 1984b, p. 100.
- ↑ Varotsos & Alexopoulos 1984b, p. 120.
- ↑ Varotsos, Alexopoulos & Nomicos 1981 and Varotsos & Alexopoulos 1984b, p. 100,120, described by Kagan 1997b, §3.3.1, p. 512, and Mulargia & Gasperini 1992, p. 32.
- ↑ Varotsos & Alexopoulos 1984b, p. 117, Table 3.
- ↑ Mulargia & Gasperini 1992, p. 32.
- ↑ Varotsos & Lazaridou 1991, Table 3, p. 341. Table 2 (p. 340) includes nine predictions (unnumbered) from 27 April 1987 to 28 April 1988, with a tenth prediction issued on 26 February 1987 mentioned in a footnote. Two of these earthquakes were excluded from table 3 on the grounds of having occurred in neighboring Albania. Table 1 (p. 333) includes 17 predictions (numbered) issued from 15 May 1988 to 23 July 1989. A footnote mentions a missed (unpredicted) earthquake on 19 March 1989; all 17 entries show associated earthquakes, and presumably are thereby deemed to have been successful predictions. Table 4 (p. 345) is a continuation of Table 1 (p. 346) out to 30 November 1989, adding five additional predictions with associated earthquakes.
- ↑ Table 1 in Varotsos et al. 1996a.
- ↑ Jackson & Kagan 1998.
- ↑ Varotsos et al. 1996a, Table 3, p. 55. "MS(ATH)" is the MS magnitude reported by the National Observatory of Athens (SI-NOA), or VAN's estimate of what that magnitude would be (p. 49). These differ from the MS magnitudes reported by the USGS.
- ↑ Specifically, between 36° to 41° North latitude and 19° to 25° East longitude. (p. 49).
- ↑ Varotsos et al. 1996a, p. 56. They have suggested the success rate should be higher, as one of the missed quakes would have been predicted but for attendance at a conference, and in another case a "clear SES" was recognized but a magnitude could not be determined for lack of operating stations.
- ↑ Jackson 1996b, p. 1365; Mulargia & Gasperini 1996, p. 1324.
- ↑ Geller 1997, §4.5, p. 436: "VAN’s ‘predictions’ never specify the windows, and never state an unambiguous expiration date. Thus VAN are not making earthquake predictions in the first place."
- ↑ Jackson 1996b, p. 1363. Also: Rhoades & Evison (1996), p. 1373: No one "can confidently state, except in the most general terms, what the VAN hypothesis is, because the authors of it have nowhere presented a thorough formulation of it."
- ↑ Kagan & Jackson 1996,grl p. 1434.
- ↑ Geller 1997, Table 1, p. 436.
- ↑ Mulargia & Gasperini 1992, p. 37.
- ↑ Hamada 1993 10 successful predictions out of 12 issued (defining success as those that occurred within 22 days of the prediction, within 100 km of the predicted epicenter and with a magnitude difference (predicted minus true) rot greater than 0.7.
- ↑ Shnirman, Schreider & Dmitrieva 1993, Nishizawa et al. 1993, and Uyeda 1991 [in Japanese])
- ↑ Lighthill 1996.
- ↑ See the table of contents.
- ↑ Aceves et al 1996.
- ↑ Varotsos & Lazaridou 1996b; Varotsos, Eftaxias & Lazaridou 1996.
- ↑ ICEF 2011, p. 335-336.
- ↑ Mulargia & Gasperini 1992, p. 32; Geller 1996a, p. 184 (ranges not given, or vague); Mulargia & Gasperini 1992, p. 32 ("large indetermination in the parameters"); Rhoades & Evison 1996, p. 1372 ("falls short"); Jackson 1996b, p. 1364 ("have never been fully specified"); Jackson & Kagan 1998, p. 573 ("much too vague"); Wyss & Allmann 1996, p. 1307 ("parameters not defined"). Stavrakakis & Drakopoulos (1996) discuss some specific cases in detail.
- ↑ Geller 1997, p. 436. Geller (1996a) discusses this at length in §6 (pp. 183-189).
- ↑ Telegram 39, issued 1 September 1988, in Varotsos & Lazaridou 1991, Fig. 21, p. 337. See figure 26 (p. 344) for a similar telegram. See also telegrams 32 and 41 (figures 15 and 16, pages 115-116) in Varotsos & Alexopoulos 1984b. This same pair of predictions is apparently presented as Telegram 10 in Table 1, p. 50, of Varotsos et al. 1996a. Text from several telegrams is presented in Table 2 (p. 54), and faxes of a similar character.
- ↑ This pair of predictions was issued on 9/1/1988, and a similar pair of predictions was re-iterated on 9/30/1988, except that the predicted amplitudes were reduced to M(l)=5.0 and 5.3, respectively. In fact, an earthquake did occur approximately 240 km west of Athens, on 10/16/1988, with magnitude Ms(ATH)=6.0, which would correspond to a local magnitude M(l) of 5.5.Varotsos et al. 1996a, Table 3, p. 55.
- ↑ Varotsos et al. (1996a) they also cite Hamada's claim of a 99.8% confidence level. Geller (1996a, p. 214) finds that this "was based on the premise that 6 out of 12 telegrams" were in fact successful predictions, which is questioned. Kagan (1996, p. 1315) finds that in Shnirman et al. "several variables ... have been modified to achieve the result." Geller et al. (1998, p. 98) mention other "flaws such as overly generous crediting of successes, using strawman null hypotheses and failing to account for properly for a posteriori "tuning" of parameters."
- ↑ Kagan & Jackson 1996, p. 1434.
- ↑ Kagan 1996, p. 1318.
- ↑ "From its very appearance in the early 1990s until today, the VAN group is the subject of sharp criticism from Greek seismologists" (GR Reporter, 2011). Chouliaras & Stavrakakis (1999): "panic overtook the general population" (Prigos, 1993). Ohshansky & Geller (2003, p. 318): "causing widespread unrest and a sharp increase in tranquilizer drugs" (Athens, 1999). Papadopoulos (2010): "great social uneasiness" (Patras, 2008). Anagnostopoulos (1998, p. 96): "often caused widespread rumors, confusion and anxiety in Greece". ICEF (2011, p. 352): issuance over the years of "hundreds" of statements "causing considerable concern among the Greek population."
- ↑ While some analyses have been done on the basis of a 100 km range (e.g., Hamada 1993, p. 205), Varotsos & Lazaridou (1991, p. 339) claim credit for earthquakes within a radius of 120 km.
- ↑ Stiros 1997, p. 482. Geller (1996a, 6.4.2) notes that while Kobe was severely damaged by the 1995 Mw 6.9 earthquake, damage in Osaka, only 30 km away, was relatively light.
- ↑ VAN predictions generally do not specify the magnitude scale or precision, but they have generally claimed a precision of ±0.7.
- ↑ Varotsos et al. 1996a, pp. 36, 60, 72.
- ↑ Anagnostopoulos 1998.
- ↑ As an instance of the quandary public officials face: in 1995 Professor Varotsos reportedly filed a complaint with the public prosecutor accusing government officials of negligence in not responding to his supposed prediction of an earthquake. A government official was quoted as saying "VAN's prediction was not of any use" in that it covered two-thirds of the area of Greece.Geller 1996a, p. 223.
- ↑ Uyeda & Kamogawa 2008
- ↑ Uyeda 2010
- ↑ Apostolidis 2008.
- ↑ Chouliaras 2009
- ↑ Papadopoulos 2010
- ↑ Harris 1998, p. B18.
- ↑ Garwin 1989.
- ↑ USGS staff 1990, p. 247.
- ↑ Kerr 1989; Harris 1998.
- ↑ E.g., ICEF 2011, p. 327.
- ↑ Harris 1998, p. B22.
- ↑ Harris 1990, Table 1, p. B5.
- ↑ Harris 1998, pp. B10–B11.
- ↑ Harris 1990, p. B10, and figure 4, p. B12.
- ↑ Harris 1990, p. B11, figure 5.
- ↑ Geller (1997, §4.4) cites several authors to say "it seems unreasonable to cite the 1989 Loma Prieta earthquake as having fulfilled forecasts of a right-lateral strike-slip earthquake on the San Andreas Fault."
- ↑ Harris 1990, pp. B21–B22.
- ↑ Hough 2010b, p. 143.
- ↑ Spence et al. 1993 (USGS Circular 1083) is the most comprehensive, and most thorough, study of the Browning prediction, and appears to be the main source of most other reports. In the following notes, where an item is found in this document the pdf pagination is shown in brackets.
- ↑ A report on Browning's prediction cited over a dozen studies of possible tidal triggering of earthquakes, but concluded that "conclusive evidence of such a correlation has not been found". AHWG 1990, p. 10 [62]. It also found that Browning's identification of a particular high tide as triggering a particular earthquake "difficult to justify".
- ↑ According to a note in Spence, et al. (p. 4): "Browning preferred the term projection, which he defined as determining the time of a future event based on calculation. He considered 'prediction' to be akin to tea-leaf reading or other forms of psychic foretelling." See also Browning's own comment on p. 36 [44].
- ↑ Including "a 50/50 probability that the federal government of the U.S. will fall in 1992." Spence et al. 1993, p. 39 [47].
- ↑ Spence et al. 1993, pp. 9–11 [17–19 (pdf)], and see various documents in Appendix A, including The Browning Newsletter for 21 November 1989 (p. 26 [34]).
- ↑ AHWG 1990, p. iii [55]. Included in Spence et al. 1993 as part of Appendix B, pp. 45–66 [53–75].
- ↑ AHWG 1990, p. 30 [72].
- ↑ Previously involved in a psychic prediction of an earthquake for North Carolina in 1975 (Spence et al. 1993, p. 13 [21]), Stewart sent a 13 page memo to a number of colleagues extolling Browning's supposed accomplishments, including predicting Loma Prieta. Spence et al. 1993, p. 29 [37]
- ↑ See Spence et al. 1993 throughout.
- ↑ Tierney 1993, p. 11.
- ↑ Spence et al. 1993, p. 40 [48] (p. 4 [12]).
- ↑ CEPEC 2004a; Hough 2010b, pp. 145–146.
- ↑ CEPEC 2004a.
- ↑ CEPEC 2004b.
- ↑ ICEF 2011, p. 320.
- ↑ Alexander 2010, p. 326.
- ↑ The Telegraph, 6 April 2009. See also McIntyre 2009.
- ↑ Hall 2011, p. 267.
- ↑ Kerr 2009.
- ↑ The Guardian, 5 April 2010.
- ↑ The ICEF (2011, p. 323) alludes to predictions made on 17 February and 10 March.
- ↑ Kerr 2009; Hall 2011, p. 267; Alexander 2010, p. 330.
- ↑ Kerr 2009; The Telegraph, 6 April 2009.
- ↑ The Guardian, 5 April 2010; Kerr 2009.
- ↑ ICEF 2011, p. 323, and see also p. 335.
Sources
- Aceves, Richard L.; Park, Stephen K.; Strauss, David J. (27 May 1996), "Statistical evaluation of the VAN Method using the historic earthquake catalog in Greece", Geophysical Research Letters, 23 (11): 1425–1428, doi:10.1029/96GL01478, ISSN 1944-8007.
- The Ad Hoc Working Group on the December 2—3, 1990, Earthquake Prediction [AHWG] (18 October 1990), Evaluation of the December 2-3, 1990, New Madrid Seismic Zone Prediction. Included in App. B of Spence et al. 1993.
- Aggarwal, Yash P.; Sykes, Lynn R.; Simpson, David W.; Richards, Paul G. (10 February 1975), "Spatial and Temporal Variations in ts/tp and in P Wave Residuals at Blue Mountain Lake, New York: Application to Earthquake Prediction", Journal of Geophysical Research, 80 (5): 718–732, Bibcode:1975JGR....80..718A, doi:10.1029/JB080i005p00718.
- Alexander, David E. (2010), "The L'Aquila Earthquake of 6 April 2009 and Italian Government Policy on Disaster Response", Journal of Natural Resources Policy Research, 2 (4): 325–342, doi:10.1080/19390459.2010.511450.
- Allen, Clarence R. (December 1976), "Responsibilities in earthquake prediction", Bulletin of the Seismological Society of America, 66 (6): 2069–2074.
- Allen, Clarence R. (December 1982), "Earthquake Prediction – 1982 Overview", Bulletin of the Seismological Society of America, 72 (6B): S331–S335.
- Allen, Clarence R. (1983), "The Southern California Earthquake Prediction of 1976 : A Prediction Unfulfilled" (PDF), Proceedings of the Seminar on Earthquake Prediction Case Histories, Geneva, 12–15 October 1982: UNDRO, pp. 77–82.
- Anagnostopoulos, Stavros A. (June 1998), "Letter" (PDF), Physics Today: 96.
- Anonymous [Haicheng Earthquake Study Delegation] (May 1977), "Prediction of the Haicheng Earthquake", Eos, Transactions, American Geophysical Union, 58 (5): 236–272, Bibcode:1977EOSTr..58..236., doi:10.1029/EO058i005p00236. (Sometimes cited as Raleigh, et al., 1977.)
- Apostolidis, C. (2008-02-10), "Problepsi gia seismo 6 rixter", Ethnos (in Greek), Pegasus Publishing, archived from the original on 2016-07-15, retrieved 2016-07-16.
- Atwood, L. Erwin; Major, Ann Marie (November 1998), "Exploring the "Cry Wolf" Hypothesis", International Journal of Mass Emergencies and Disasters, 16 (3): 279–302.
- Bakun, W. H.; Aagaard, B.; Dost, B.; Ellsworth, W. L.; Hardebeck, J. L.; Harris, R. A.; Ji, C.; Johnston, M. J. S.; Langbein, J.; Lienkaemper, J. J.; Michael, A. J.; Murray, J. R.; Nadeau, R. M.; Reasenberg, P. A.; Reichle, M. S.; Roeloffs, E. A.; Shakal, A.; Simpson, R. W.; Simpson, R. W.; and Waldhauser, F. (13 October 2005), "Implications for prediction and hazard assessment from the 2004 Parkfield earthquake", Nature, 437 (7061): 969–974, Bibcode:2005Natur.437..969B, doi:10.1038/nature04067, PMID 16222291.
- Bakun, W.H.; Breckenridge, K.S.; Bredehoeft, J.; Burford, R.O.; Ellsworth, W.L.; Johnston, M.J.S.; Jones, L.; Lindh, A.G.; Mortensen, C.; Mueller, R. J.; Poley, C. M.; Roeloffs, E.; Schulz, S.; Segall, P.; Thatcher, W. (1 May 1987), "Parkfield, California, Earthquake Prediction Scenarios and Response Plans" (PDF), U.S. Geological Survey, Open-File Report 87-192.
- Bakun, W. H.; Lindh, A. G. (16 August 1985), "The Parkfield, California, Earthquake Prediction Experiment" (PDF), Science, 229 (4714): 619–624, Bibcode:1985Sci...229..619B, doi:10.1126/science.229.4714.619, PMID 17739363.
- Bakun, W. H.; McEvilly, T. V. (28 September 1979), "Earthquakes near Parkfield, California: Comparing the 1934 and 1966 Sequences" (PDF), Science, 205 (4413): 1375–1377, Bibcode:1979Sci...205.1375B, doi:10.1126/science.205.4413.1375, PMID 17732330.
- Bernard, P. (10 November 1992), "Plausibility of long distance electrotelluric precursors to earthquakes", Journal of Geophysical Research, 97: 17531–17546, Bibcode:1992JGR....9717531B, doi:10.1029/92JB01215.
- Bernard, P.; LeMouel, J. L. (1996), "On electrotelluric signals", A critical review of VAN, London: Lighthill, S. J. World Scientific, pp. 118–154.
- Bolt, Bruce A. (1993), Earthquakes and geological discovery, Scientific American Library, ISBN 0-7167-5040-6.
- Bowman, D. D.; Quillon, G.; Sammis, C. G.; Sornette, A.; Sornette, D. (10 October 1998), "An observational test of the critical earthquake concept" (PDF), Journal of Geophysical Research, 103 (10): 24,359–24,372, arXiv:cond-mat/9803204
 , Bibcode:1998JGR...10324359B, doi:10.1029/98jb00792.
- Brown, Roger; Kulik, James (1977), "Flashbulb memories", Cognition, 5 (1): 73–99, doi:10.1016/0010-0277(77)90018-X.
- California Earthquake Prediction Evaluation Council (2 March 2004a), Report to the Director, Governor's Office of Emergency Services (PDF).
- California Earthquake Prediction Evaluation Council (9 December 2004b), Report to the Director, Governor's Office of Emergency Services.
- Campbell, W. H. (2009), "Natural magnetic disturbance fields, not precursors, preceding the Loma Prieta earthquake", Journal of Geophysical Research, 114 (A5): A05307, Bibcode:2009JGRA..114.5307C, doi:10.1029/2008JA013932.
- Cartlidge, Edwin (3 June 2011), "Quake Experts to Be Tried For Manslaughter", Science, 332 (6034): 1135–1136, doi:10.1126/science.332.6034.1135, PMID 21636750.
- Cartlidge, Edwin (12 October 2012), "Aftershocks in the Courtroom", Science, 338 (6104): 184–188, doi:10.1126/science.338.6104.184, PMID 23066054.
- Castellaro, S. (2003), "§2.4.3. The classical earthquake model", in Mulargia, Francesco; Geller, Robert J., Earthquake science and seismic risk reduction, Dordrecht: Kluwer Academic Publishers, pp. 56–57, ISBN 9781402017780.
- Chouliaras, G.; Stavrakakis, G. (1999), "Support for VAN's earthquake predictions is based on false statements." (PDF), Eos Trans. AGU, 80 (19): 216..
- Chouliaras, G (2009), "Seismicity anomalies prior to 8 June 2008 earthquake in Western Greece" (PDF), Nat. Hazards Earth Syst. Sci., 9: 327–335, doi:10.5194/nhess-9-327-2009, retrieved July 31, 2016.
- Cicerone, Robert D.; Ebel, John E.; Britton, James (25 October 2009), "A systematic compilation of earthquake precursors" (PDF), Tectonophysics, 476 (3–4): 371–396, Bibcode:2009Tectp.476..371C, doi:10.1016/j.tecto.2009.06.008.
- Cannavò, Flavio; Arena, Alessandra; Monaco, Carmelo (2015), "Local geodetic and seismic energy balance for shallow earthquake prediction", Journal of Seismology, 19 (1): 1–8, Bibcode:2015JSeis..19....1C, doi:10.1007/s10950-014-9446-z.
- Console, R. (30 August 2001), "Testing earthquake forecast hypotheses", Tectonophysics, 338 (3–4): 261–268, Bibcode:2001Tectp.338..261C, doi:10.1016/S0040-1951(01)00081-6.
- Cowan, Hugh; Nicol, Andrew; Tonkin, Philip (10 March 1996), "A comparison of historical and paleoseismicity in a newly formed fault zone and a mature fault zone, North Canterbury, New Zealand", Journal of Geophysical Research, 101 (B3): 6021–6036, Bibcode:1996JGR...101.6021C, doi:10.1029/95JB01588.
- Davies, D. (27 November 1975), "Earthquake prediction in China", Nature, 258 (5533): 286–287, Bibcode:1975Natur.258..286D, doi:10.1038/258286a0.
- Drakopoulos, J.; Stavrakakis, G.N.; Latoussakis, J. (30 August 1993), "Evaluation and interpretation of thirteen official van—telegrams for the period September 10, 1986 to April 28, 1988.", Tectonophysics, 224 (1-3): 223–236, doi:10.1016/0040-1951(93)90075-U.
- Dollar, John (5 April 2010), "The man who predicted an earthquake", The Guardian.
- Evans, R. (December 1997), "Assessment of schemes for earthquake prediction: Editor's introduction", Geophysical Journal International, 131 (3): 413–420, Bibcode:1997GeoJI.131..413E, doi:10.1111/j.1365-246X.1997.tb06585.x.
- Evison, Frank (October 1999), "On the existence of earthquake precursors" (PDF), Annali di Geofisica, 42 (5): 763–770.
- Fraser-Smith, A. C.; Bernardi, A.; McGill, P. R.; Ladd, M. E.; Helliwell, R. A.; Villard, Jr., O. G. (1990), "Low-Frequency Magnetic Field Measurements Near the Epicenter of the Ms 7.1 Loma Prieta Earthquake", Geophysical Research Letters, 17 (9): 1465–1468, Bibcode:1990GeoRL..17.1465F, doi:10.1029/GL017i009p01465.
- Garwin, Laura (26 October 1989), "A successful prediction?", Nature, 341 (6244): 677, Bibcode:1989Natur.341..677G, doi:10.1038/341677a0.
- Geller, Robert J. (17 October 1991), "Unpredictable earthquakes [response to Hamada]", Nature, 353 (6345): 612, Bibcode:1991Natur.353..612G, doi:10.1038/353612a0.
- Geller, R. J. (1996a), "Short-term earthquake prediction in Greece by seismic electric signals", in Lighthill, J., A Critical Review of VAN, World Scientific, pp. 155–238
- Geller, R. J. (27 May 1996b), "Debate on evaluation of the VAN method: Editor's introduction", Geophysical Research Letters, 23 (11): 1291–1293, Bibcode:1996GeoRL..23.1291G, doi:10.1029/96GL00742.
- Geller, Robert J. (December 1997), "Earthquake prediction: a critical review." (PDF), Geophysical Journal International, 131 (3): 425–450, Bibcode:1997GeoJI.131..425G, doi:10.1111/j.1365-246X.1997.tb06588.x
- Geller, Robert J.; Jackson, David D.; Kagan, Yan Y.; Mulargia, Francesco (14 March 1997), "Earthquakes Cannot Be Predicted" (PDF), Science, 275 (5306): 1616, doi:10.1126/science.275.5306.1616.
- Geller, Robert J.; Jackson, David D.; Kagan, Yan Y.; Mulargia, Francesco; Stiros, Stathis (June 1998), "Letter" (PDF), Physics Today: 95–96.
- Gersony, Robert, ed. (1982b), "Selected Available Documentation: The Brady Earthquake Predictions" (PDF), The Lima Disaster Preparedness Report, XIII-B.
- Giesecke, Albert A. (1983), "Case history of the Peru prediction for 1980-1981" (PDF), Proceedings of the Seminar on Earthquake Prediction Case Histories, Geneva, 12–15 October 1982: UNDPRO, pp. 51–74.
- Hall, Stephen S. (15 September 2011), "At Fault?" (PDF), Nature, 477 (7364): 264–269, Bibcode:2011Natur.477..264H, doi:10.1038/477264a, PMID 21921895.
- Hamada, K. (17 October 1991), "Unpredictable earthquakes", Nature, 353 (6345): 611–612, Bibcode:1991Natur.353..611H, doi:10.1038/353611c0.
- Hamada, Kazuo (30 August 1993), "Statistical evaluation of the SES predictions issued in Greece: alarm and success rates", Tectonophysics, 224 (1-3): 203–210, doi:10.1016/0040-1951(93)90073-S.
- Hamada, Kazuo (1996), "Re-examination of statistical evaluation of the SES prediction in Greece", in Sir James Lighthill, A Critical Review of VAN - Earthquake Prediction from Seismic Electrical Signals, London, UK: World Scientific Publishing Co Pte Ltd, pp. 286–291, ISBN 978-9810226701.
- Hamilton, Robert M. (1976), "The Status of Earthquake Prediction", U.S. Geological Survey, Circular 729: 6–9.
- Hammond, Allen L. (23 May 1973), "Earthquake predictions: Breakthrough in theoretical insight?" (PDF), Science, 180 (4088): 851–853, Bibcode:1973Sci...180..851H, doi:10.1126/science.180.4088.851, PMID 17789254.
- Hammond, Allen L. (3 May 1974), "Dilatancy: Growing Acceptance as an Earthquake Mechanism" (PDF), Science, 184 (4136): 551–552, Bibcode:1974Sci...184..551H, doi:10.1126/science.184.4136.551, PMID 17755025.
- Hammond, Allen L. (7 February 1975), "Earthquake Prediction: Progress in California, Hesitation in Washington" (PDF), Science, 187 (4175): 419–420, Bibcode:1975Sci...187..419H, doi:10.1126/science.187.4175.419, PMID 17835300.
- Hammond, Allen L. (7 May 1976), "Earthquakes: An evacuation in China, a warning in California", Science, 192 (4239): 538–539, Bibcode:1976Sci...192..538H, doi:10.1126/science.192.4239.538, PMID 17745640.
- Hardebeck, Jeanne L.; Felzer, Karen R.; Michael, Andrew J. (August 2008), "Improved tests reveal that the accelerating moment release hypothesis is statistically insignificant" (PDF), Journal of Geophysical Research, 113 (B08130): 8310, Bibcode:2008JGRB..113.8310H, doi:10.1029/2007JB005410.
- Harris, Ruth A. (1998), The Loma Prieta, California, Earthquake of October 17, 1989—Forecasts (PDF), Open-File Report 1550-B, U.S. Geological Survey.
- Harris, Ruth A.; Arrowsmith, J Ramon (September 2006), "Introduction to the Special Issue on the 2004 Parkfield Earthquake and the Parkfield Earthquake Prediction Experiment" (PDF), Bulletin of the Seismological Society of America, 96 (4B): S1–S5, Bibcode:2006BuSSA..96S...1H, doi:10.1785/0120050831.
- Hayakawa, Masashi (2015), Fundamentals of earthquake prediction, Singapore: John Wiley & Sons, ISBN 9781118770375.
- Hough, Susan Elizabeth; Langer, James S. (2007), "Richter's Scale: Measure of an Earthquake, Measure of a Man", Physics Today, Princeton University Press, 61: 60–62, Bibcode:2008PhT....61a..60H, doi:10.1063/1.2835157, ISBN 978-0-691-12807-8.
- Hough, Susan Elizabeth (Jan–Feb 2010), "A seismological retrospective of the Brady-Spence prediction" (PDF), Seismological Research Letters, 81 (1): 113–117, doi:10.1785/gssrl.81.1.113.
- Hough, Susan (2010b), Predicting the Unpredictable: The Tumultuous Science of Earthquake Prediction, Princeton University Press, ISBN 978-0-691-13816-9.
- Huang, Qinghua (2015-01-27), "Forecasting the epicenter of a future major earthquake", Proceedings of the National Academy of Sciences, 112 (4): 944–945, Bibcode:2015PNAS..112..944H, doi:10.1073/pnas.1423684112, ISSN 0027-8424, PMC 4313830, PMID 25583499.
- Immè, Giuseppina; Morelli, Daniela (2012), "Radon as Earthquake Precursor" (PDF), in D'Amico, Earthquake Research and Analysis.
- International Commission on Earthquake Forecasting for Civil Protection (2 October 2009), Operational Earthquake Forecasting: State of Knowledge and Guidelines for Utilization – Executive Summary (PDF).
- International Commission on Earthquake Forecasting for Civil Protection (30 May 2011), "Operational Earthquake Forecasting: State of Knowledge and Guidelines for Utilization", Annals of Geophysics, 54 (4): 315–391, doi:10.4401/ag-5350.
- Jackson, David D. (April 1996a), "Hypothesis testing and earthquake prediction" (PDF), Proc. Natl. Acad. Sci. U.S.A., 93 (9): 3772–3775, Bibcode:1996PNAS...93.3772J, doi:10.1073/pnas.93.9.3772, PMC 39435, PMID 11607663.
- Jackson, David D. (27 May 1996b), "Earthquake prediction evaluation standards applied to the VAN method", Geophysical Review Letters, 23 (11): 1363–1366, Bibcode:1996GeoRL..23.1363J, doi:10.1029/96gl01439.
- Jackson, David D. (2004), "Earthquake Prediction and Forecasting", in Sparks, R. S. J.; Hawkesworth, C. J., The State of the Planet: Frontiers and Challenges in Geophysics (PDF), Geophysical Monograph Series, 150, pp. 335–348, Bibcode:2004GMS...150..335J, doi:10.1029/150GM26, ISBN 0-87590-415-7.
- Jackson, David D.; Kagan, Yan Y. (24 November 1998), "VAN method lacks validity" (PDF), Eos, 79 (47): 573–579, doi:10.1029/98EO00418.
- Jackson, David D.; Kagan, Yan Y. (September 2006), "The 2004 Parkfield earthquake, the 1985 prediction, and characteristic earthquakes: Lessons for the future" (PDF), Bulletin of the Seismological Society of America, 96 (4B): S397–S409, Bibcode:2006BuSSA..96S.397J, doi:10.1785/0120050821.
- Jolliffe, Ian T.; Stephenson, David B., eds. (2003), Forecast Verification: A Practitioner’s Guide in Atmospheric Science (1st ed.), John Wiley & Sons, Ltd., ISBN 0-471-49759-2.
- Jones, Lucille M. (December 1985), "Foreshocks and time-dependent earthquake hazard assessment in southern California", Bulletin of the Seismological Society of America, 75 (6): 1669–1679.
- Jordan, Thomas H.; Jones, Lucile M. (July–August 2010), "Operational Earthquake Forecasting: Some thoughts on why and how" (PDF), Seismological Research Letters, 81 (4): 571–574, doi:10.1785/gssrl.81.4.571.
- Kagan, Y. Y. (May 27, 1996), "VAN earthquake predictions — an attempt at statistical evaluation" (PDF), Geophysical Research Letters, 23 (11): 1315–1318, doi:10.1029/95gl03417
- Kagan, Yan Y. (15 March 1997), "Statistical aspects of Parkfield earthquake sequence and Parkfield prediction experiment" (PDF), Tectonophysics, 270 (3–4): 207–219, Bibcode:1997Tectp.270..207K, doi:10.1016/S0040-1951(96)00210-7.
- Kagan, Yan Y. (December 1997b), "Are earthquakes predictable?" (PDF), Geophysical Journal International, 131 (3): 505–525, Bibcode:1997GeoJI.131..505K, doi:10.1111/j.1365-246X.1997.tb06595.x.
- Kagan, Yan Y. (August 1999), "Is Earthquake Seismology a Hard, Quantitative Science?" (PDF), Pure and Applied Geophysics, 155 (2–4): 233–258, Bibcode:1999PApGe.155..233K, doi:10.1007/s000240050264.
- Kagan, Yan Y.; Jackson, David D. (10 December 1991), "Seismic Gap Hypothesis: Ten Years After" (PDF), Journal of Geophysical Research, 96 (B13): 21,419–21,431, Bibcode:1991JGR....9621419K, doi:10.1029/91jb02210.
- Kagan, Yan Y.; Jackson, David D. (27 May 1996), "Statistical tests of VAN earthquake predictions: comments and reflections" (PDF), Geophysical Research Letters, 23 (11): 1433–1436, Bibcode:1996GeoRL..23.1433K, doi:10.1029/95GL03786.
- Kagan, Yan Y.; Jackson, David d.; Geller, Robert J. (November–December 2012), "Characteristic earthquake model, 1884 – 2011, R.I.P", Seismological Research Letters, 83 (6): 951–953, arXiv:1207.4836, Bibcode:2012arXiv1207.4836K, doi:10.1785/0220120107.
- Kagan, Yan Y.; Knopoff, Leon (19 June 1987), "Statistical Short-Term Earthquake Prediction" (PDF), Science, 236 (4808): 1563–1567, Bibcode:1987Sci...236.1563K, doi:10.1126/science.236.4808.1563, PMID 17835741.
- Kanamori, Hiroo (2003), "Earthquake Prediction: An Overview", International Handbook of Earthquake and Engineering Seismology, International Geophysics, 616: 1205–1216, doi:10.1016/s0074-6142(03)80186-9, ISBN 0-12-440658-0.
- Kerr, Richard A. (28 April 1978), "Earthquakes: Prediction Proving Elusive" (PDF), Science, 200 (4340): 419–421, Bibcode:1978Sci...200..419K, doi:10.1126/science.200.4340.419, PMID 17757294.
- Kerr, Richard A. (2 November 1979), "Prospects for Earthquake Prediction Wane" (PDF), Science, 206 (4418): 542–544, Bibcode:1979Sci...206..542K, doi:10.1126/science.206.4418.542.
- Kerr, Richard A. (20 February 1981), "Prediction of huge Peruvian quakes quashed" (PDF), Science, 211 (4484): 808–809, Bibcode:1981Sci...211..808K, doi:10.1126/science.211.4484.808, PMID 17740381.
- Kerr, Richard A. (18 December 1981c), "Palmdale Bulge Doubts Now Taken Seriously" (PDF), Science, 214 (4527): 1331–33, Bibcode:1981Sci...214.1331K, doi:10.1126/science.214.4527.1331.
- Kerr, Richard A. (6 January 1984), "Stalking the Next Parkfield Earthquake" (PDF), Science, 223 (4631): 36–38, Bibcode:1984Sci...223...36K, doi:10.1126/science.223.4631.36, PMID 17752978.
- Kerr, Richard A. (27 October 1989), "Reading the Future in Loma Prieta" (PDF), Science, 246 (4929): 436–439, Bibcode:1989Sci...246..436K, doi:10.1126/science.246.4929.436, PMID 17788681.
- Kerr, Richard A. (8 October 2004), "Parkfield Keeps Secrets After A Long-Awaited Quake" (PDF), Science, 306 (5694): 206–7, doi:10.1126/science.306.5694.206, PMID 15472043.
- Kerr, Richard A. (17 April 2009), "After the Quake, in Search of the Science—or Even a Good Prediction" (PDF), Science, 324 (5925): 322, Bibcode:2009Sci...324..322K, doi:10.1126/science.324.5925.322.
- Lighthill, Sir James, ed. (1996), A Critical Review of VAN – Earthquake Prediction from Seismic Electrical Signals, London: World Scientific Publishing Co Pte Ltd, ISBN 978-981-02-2670-1.
- Lighton, John R.B.; Duncan, Frances D. (15 August 2005), "Shaken, not stirred: a serendipitous study of ants and earthquakes" (PDF), Journal of Experimental Biology, 208 (16): 3103–3107, doi:10.1242/jeb.01735.
- Lindberg, Robert G.; Skiles, Durward; Hayden, Page (1981), "Can animals predict earthquakes? A search for correlations between changes in activity patterns of two fossorial rodents and subsequent seismic events" (PDF), U.S. Geological Survey, Open-File Report 81-385.
- Lindh, A.G.; Lockner, D.A.; Lee, W.H.K. (June 1978), "Velocity anomalies: An alternative explanation" (PDF), Bulletin of the Seismological Society of America, 68 (3): 721–734.
- Lomnitz, Cinna (1994), Fundamentals of earthquake prediction, New York: John Wiley & Sons, ISBN 0-471-57419-8, OCLC 647404423.
- Lomnitz, Cinna; Nava, F. Alejandro (December 1983), "The predictive value of seismic gaps.", Bulletin of the Seismological Society of America, 73 (6A): 1815–1824.
- Lott, Dale F.; Hart, Benjamin L.; Verosub, Kenneth L.; Howell, Mary W. (September 1979), "Is Unusual Animal Behavior Observed Before Earthquakes? Yes and No", Geophysical Research Letters, 6 (9): 685–687, Bibcode:1979GeoRL...6..685L, doi:10.1029/GL006i009p00685.
- Lott, Dale F.; Hart, Benjamin L.; Howell, Mary W. (December 1981), "Retrospective Studies of Unusual Animal Behavior as an Earthquake Predictor", Geophysical Research Letters, 8 (12): 1203–1206, Bibcode:1981GeoRL...8.1203L, doi:10.1029/GL008i012p01203.
- Ludwin, Ruth (May 2001), "Earthquake Prediction" (PDF), Washington Geology, 28 (3): 27–28.
- Luen, Brad; Stark, Philip B. (2008), "Testing earthquake predictions", Institute of Mathematical Statistics collections: Probability and Statistics: Essays in Honor of David A. Freedman, 2, pp. 302–315, arXiv:0805.3032, Bibcode:2008pseh.book..302L, ISBN 978-0-94060074-4.
- Mabey, Matthew A. (May 2001), "The Charlatan Game" (PDF), Washington Geology, 28 (3): 27–28. Also at USGS.
- Mason, Ian (2003), Binary Events. Chap. 3 in Jolliffe & Stephenson 2003.
- Matthews, Robert A. J. (December 1997), "Decision-theoretic limits on earthquake prediction", Geophysical Journal International, 131 (3): 526–529, Bibcode:1997GeoJI.131..526M, doi:10.1111/j.1365-246X.1997.tb06596.x.
- McCann, W. R.; Nishenko, S. P.; Sykes, L. R.; Krause, J. (1979), "Seismic gaps and plate tectonics: Seismic potential for major boundaries", Pure and Applied Geophysics, 117 (6): 1082–1147, Bibcode:1979PApGe.117.1082M, doi:10.1007/BF00876211.
- McEvilly, T.V.; Johnson, L.R. (April 1974), "Stability of P an S velocities from Central California quarry blasts", Bulletin of the Seismological Society of America, 64 (2): 343–353.
- McIntyre, Jamie (April–May 2009), "When Outrage Trumps Science: Italian quake prediction produces tabloid tremors", American Journalism Review.
- McNally, Karen (November–December 1979), "Trapping an Earthquake" (PDF), Engineering & Science, pp. 7–12.
- Mignan, Arnaud (June 2011), "Retrospective on the Accelerating Seismic Release (ASR) hypothesis: controversy and new horizons", Tectonophysics, 505 (1–4): 1–16, Bibcode:2011Tectp.505....1M, doi:10.1016/j.tecto.2011.03.010.
- Mignan, Arnaud (14 February 2013), "The debate on the prognostic value of earthquake foreshocks: A meta-analysis", Scientific Reports, 4: 4099, Bibcode:2014NatSR...4E4099M, doi:10.1038/srep04099, PMC 3924212, PMID 24526224.
- Mileti, Dennis; Sorensen, John (1990), Communication of Emergency Public Warnings, National Technical Information Service, retrieved September 20, 2016.
- Miller, Sunlen; Patrick, Maggy; Capatides, Christina (24 August 2011), Sixth Sense? Zoo Animals Sensed Quake Early, ABC News.
- Mulargia, Francesco; Gasperini, Paolo (1992), "Evaluating the statistical validity beyond chance of 'VAN' earthquake precursors" (PDF), Geophysical Journal International, 111: 32–44, Bibcode:1992GeoJI.111...32M, doi:10.1111/j.1365-246X.1992.tb00552.x.
- Mulargia, Francesco; Gasperini, Paolo (27 May 1996a), "Precursor candidacy and validation: The VAN case so far" (PDF), Geophysical Research Letters, 23 (11): 1323–1326, Bibcode:1996GeoRL..23.1323M, doi:10.1029/95GL03456.
- Mulargia, Francesco; Gasperini, Paolo (27 May 1996b), "VAN: Candidacy and validation with the latest laws of the game" (PDF), Geophysical Research Letters, 23 (11): 1327–1330, doi:10.1029/95gl03455.
- Ohshansky, R.B.; Geller, R.J> (2003), "Earthquake prediction and public policy", in Mulargia, Francesgo; Geller, Robert J., Earthquake Science and Seismic Risk Reduction., NATO Science Series, IV Earth and Environmental Sciences, 32, Kluwer, pp. 284–329, doi:10.1007/978-94-010-0041-3_8, ISBN 978-94-010-0041-3.
- Otis, Leon; Kautz, William (1979), "Biological premonitions of earthquakes: a validation study", U.S. Geological Survey, Open-File Report 80-453: 225–226.
- Panel on Earthquake Prediction of the Committee on Seismology [C.R Allen, chairman] (July 1976), Predicting Earthquakes: A Scientific and Technical Evaluation – with Implications for Society, Washington, D.C.: National Academy Sciences.
- Papadopoulos, Gerassimos A. (4 May 2010), "Comment on "The Prediction of Two Large Earthquakes in Greece"" (PDF), Eos, 91 (18): 162, doi:10.1029/2010EO180003.
- Papadopoulos, Gerassimos A. (2015), "Communicating to the General Public Earthquake Prediction Information: Lessons Learned in Greece, Chap. 19", in Wyss, Max; Peppoloni, Silvia, Geoethics: Ethical Challenges and Case Studies in Earth Sciences (PDF), pp. 223–242, ISBN 978-0-12-799935-7
- Park, S. (July 1996), "Precursors to earthquakes: seismoelectromagnetic signals" (PDF), Surveys in Geophysics, 17 (4): 493–516, Bibcode:1996SGeo...17..493P, doi:10.1007/BF01901642.
- Reid, Harry Fielding (1910), "The Mechanics of the Earthquake.", The California Earthquake of April 18, 1906: Report of the State Earthquake Investigation Commission, Vol. 2.
- Rhoades, D.A.; Evison, F.F. (27 May 1996), "The VAN earthquake predictions", Geophysical Research Letters, 23 (11): 1371–1373, Bibcode:1996GeoRL..23.1371R, doi:10.1029/95GL02792.
- Rikitake, Tsuneji (1 May 1979), "Classification of earthquake precursors", Tectonophysics, 54 (3–4): 293–309, Bibcode:1979Tectp..54..293R, doi:10.1016/0040-1951(79)90372-X.
- Rikitake, Tsuneji (1982), Earthquake Forecasting and Warning, Tokyo: Center for Academic Publications.
- Roberts, J.L. (1983), "Notes on procedure for conveying earthquake forecasts with special reference to the Peru predictions for 1980-1981" (PDF), Proceedings of the Seminar on Earthquake Prediction Case Histories, Geneva, 12–15 October 1982: UNDPRO.
- Roeloffs, Evelyn; Langbein, John (August 1994), "The earthquake prediction experiment at Parkfield California", Review of Geophysics, 32 (3): 315–336, Bibcode:1994RvGeo..32..315R, doi:10.1029/94RG01114.
- Rong, Yufang; Jackson, David D.; Kagan, Yan Y. (October 2003), "Seismic gaps and earthquakes" (PDF), Journal of Geophysical Research, 108 (B10): 1–14, Bibcode:2003JGRB..108.2471R, doi:10.1029/2002JB002334.
- Rundle, John B.; Holliday, James R.; Graves, William R.; Turcotte, Donald L.; Tiampo, Kristy F.; Klein, William (2012), "Probabilities for large events in driven threshold systems", Physical Review E, 86 (2): 021106, doi:10.1103/PhysRevE.86.021106.
- Saegusa, A. (28 January 1999), "China clamps down on inaccurate warnings", Nature, 397 (6717): 284, Bibcode:1999Natur.397..284W, doi:10.1038/16756.
- Sarlis, N.; Lazaridou, M.; Kapiris, P.; Varotsos, P. (1999-11-01). "Numerical model of the selectivity effect and the ΔV/L criterion". Geophysical Research Letters. 26 (21): 3245–3248. Bibcode:1999GeoRL..26.3245S. doi:10.1029/1998GL005265. ISSN 1944-8007..
- Schaal, Rand B. (February 1988), "An evaluation of the animal-behavior theory for earthquake predictions" (PDF), California Geology, 41 (2): 41–45.
- Scholz, Christopher H. (2002), The Mechanics of earthquakes and faulting, (2nd ed.), Cambridge Univ. Press, ISBN 0-521-65223-5.
- Scholz, Christopher H.; Sykes, Lynn R.; Aggarwal, Yah P. (31 August 1973), "Earthquake Prediction: A Physical Basis" (PDF), Science, 181 (4102): 803–810, Bibcode:1973Sci...181..803S, doi:10.1126/science.181.4102.803, PMID 17816227.
- Schwartz, David P.; Coppersmith, Kevin J. (10 July 1984), "Fault Behavior and Characteristic Earthquakes: Examples From the Wasatch and San Andreas Fault Zones", Journal of Geophysical Research, 89 (B7): 5681–5698, Bibcode:1984JGR....89.5681S, doi:10.1029/JB089iB07p05681.
- Shnirman, M.; Schreider, S.; Dmitrieva, O. (1993), "Statistical evaluation of the VAN predictions issued during the period 1987-1989." (PDF), Tectonophysics, 224 (1-3): 211–221, doi:10.1016/0040-1951(93)90074-t.
- Spence, William; Herrmann, Robert B.; Johnston, Arch C.; Reagor, Glen (1993), "Responses to Iben Browning's Prediction of a 1990 New Madrid, Missouri, Earthquake" (PDF), U.S. Geological Survey, Circular 1083.
- Squires, Nick; Rayne, Gordon (6 April 2009), "Italian earthquake: expert's warnings were dismissed as scaremongering", The Telegraph.
- Stark, Philip B. (1997), "Earthquake prediction: the null hypothesis", Geophysical Journal International, 131 (3): 495–499, Bibcode:1997GeoJI.131..495S, doi:10.1111/j.1365-246X.1997.tb06593.x.
- Stavrakakis, George N.; Drakopoulos, John (May 27, 1996), "The VAN method: Contradictory and misleading results since 1981", Geophysical Review Letters, 23 (11): 1347–1350, doi:10.1029/95gl03546.
- Stein, Seth; Friedrich, Anke; Newman, Andrew (July–August 2005), "Dependence of possible characteristic earthquakes on spatial sampling: illustration for the Wasatch seismic zone, Utah" (PDF), Seismological Research Letters, 76 (4): 432–436, doi:10.1785/gssrl.76.4.432.
- Stein, Seth; Newman, Andrew (March–April 2004), "Characteristic and uncharacteristic earthquakes as possible artifacts: application to the New Madrid and Wabash seismic zones" (PDF), Seismological Research Letters, 75 (2): 173–187, doi:10.1785/gssrl.75.2.173.
- Stiros, Stathis C. (December 1997), "Costs and benefits of earthquake prediction studies in Greece" (PDF), Geophysical Journal International, 131: 478–484, doi:10.1111/j.1365-246x.1997.tb06591.x.
- Sykes, Lynn R.; Shaw, Bruce E.; Scholz, Christopher H. (1999), "Rethinking Earthquake Prediction" (PDF), Pure and Applied Geophysics, 155 (2–4): 207–232, Bibcode:1999PApGe.155..207S, doi:10.1007/s000240050263.
- Thomas, J. N.; Love, J. J.; Johnston, M. J. S. (2009), "On the reported magnetic precursor of the 1989 Loma Prieta earthquake", Physics of the Earth and Planetary Interiors, 173 (3–4): 207–215, Bibcode:2009PEPI..173..207T, doi:10.1016/j.pepi.2008.11.014.
- Thomas, Lee M. (1983), "Economic impacts of earthquake prediction" (PDF), Proceedings of the Seminar on Earthquake Prediction Case Histories, Geneva, 12–15 October 1982: UNDPRO, pp. 179–185.
- Tiampo, Kristy F.; Shcherbakov, Robert (2012), "Seismicity-based earthquake forecasting techniques: Ten years of progress" (PDF), Tectonophysics, 522—523: 89–121, Bibcode:2012Tectp.522...89T, doi:10.1016/j.tecto.2011.08.019.
- Tierney, Kathleen J. (1993), "Making sense of collective preoccupations: lessons from research on the Iben Browning earthquake prediction." (PDF), in Platt, Gerald M.; Gordon, Chad, Self, Collective Behavior, and Society: Essays Honoring the Contributions of Ralph H. Turner, JAI Press, ISBN 978-155938755-2.
- Turner, Ralph H. (November 1993), "Reflections on the Past and Future of Social Research on Earthquake Warnings", International Journal of Mass Emergecnies and Disasters, 11 (3): :454–468.
- U.S. Geological Survey (1976), "Earth Prediction — Opportunity to Avert Disaster; A conference on earthquake warning and response held in San Francisco, California, on November 7, 1975." (PDF), U.S. Geological Survey, Circular 729: 6–9. (Sometimes attributed to McKelvey, who wrote the Forward.)
- U.S. Geological Survey Staff (19 January 1990), "The Loma Prieta, California, earthquake: an anticipated event" (PDF), Science, 247 (4940): 286–293, Bibcode:1990Sci...247..286G, doi:10.1126/science.247.4940.286, PMID 17735847.
- Uyeda, Seiya; Nagao, Toshiyasu; Kamogawa, Masashi (2009-05-29), "Short-term earthquake prediction: Current status of seismo-electromagnetics", Tectonophysics, 470 (3–4): 205–213, doi:10.1016/j.tecto.2008.07.019.
- Uyeda, Seiya (2010), "Reply to Comment on "The Prediction of Two Large Earthquakes in Greece"", Eos, John Wiley & Sons, 91 (18): 163, doi:10.1029/2010EO180004, retrieved 2016-07-16.
- Uyeda, Seiya; Kamogawa, Masashi (2008-09-23), "The Prediction of Two Large Earthquakes in Greece", Eos, Transactions American Geophysical Union, 89 (39): 363–363, doi:10.1029/2008EO390002, ISSN 2324-9250.
- Uyeda, S. (1996), "Introduction to the VAN method of earthquake prediction", in Sir James Lighthill, A Critical Review of VAN – Earthquake Prediction from Seismic Electrical Signals, London, UK: World Scientific Publishing Co Pte Ltd, ISBN 978-981-02-2670-1.
- Uyeda, Seiya (November 24, 1998), "VAN Method of Short-term Earthquake Prediction Shows Promise", Eos, 79 (47): 573, 580, doi:10.1029/98EO00417.
- Uyeda, Seiya (4 January 2000), "In Defense of VAN's Earthquake Predictions" (PDF), Forum, Eos, 81 (1): 3, 6, doi:10.1029/00EO00005.
- Varotsos, P.; Alexopoulos, K.; Nomicos, K. (1981), "Seven-hour precursors to earthquakes determined from telluric currents", Praktika of the Academy of Athens, 56: 417–433.
- Varotsos, P.; Alexopoulos, K. (December 1984a), "Physical properties of the variations of the electric field of the earth preceding earthquakes, I", Tectonophysics, 110 (1): 73–98, Bibcode:1984Tectp.110...73V, doi:10.1016/0040-1951(84)90059-3.
- Varotsos, P.; Alexopoulos, K. (December 1984b), "Physical properties of the variations of the electric field of the earth preceding earthquakes. II. determination of epicenter and magnitude", Tectonophysics, 110 (1): 99–125, Bibcode:1984Tectp.110...99V, doi:10.1016/0040-1951(84)90060-X.
- Varotsos, P.; Alexopoulos, K.; Lazaridou, M. (August 1993), "Latest aspects of earthquake prediction in Greece based on seismic electric signals, II", Tectonophysics, 224 (1): 1–37, Bibcode:1993Tectp.224....1V, doi:10.1016/0040-1951(93)90055-O.
- Varotsos, P.; Eftaxias, K.; Lazaridou, M. (27 May 1996), "Reply I to "VAN: Candidacy and validation with the latest laws of the game" and "Precursor candidacy and validation: The VAN Case so far"", Geophysical Research Letters, 23 (11): 1331–1334, Bibcode:1996GeoRL..23.1331V, doi:10.1029/96GL01436, ISSN 1944-8007.
- Varotsos, P.; Lazaridou, M. (1991), "Latest aspects of earthquake prediction in Greece based on seismic electric signals", Tectonophysics, 188 (3–4): 321–347, Bibcode:1991Tectp.188..321V, doi:10.1016/0040-1951(91)90462-2.
- Varotsos, P.; Lazaridou, M.; Eftaxias, K.; Antonopoulos, G.; Makris, J.; Kopanas, J. (1996a), "Short-term earthquake prediction in Greece by seismic electric signals", in Lighthill, J., A Critical Review of VAN, World Scientific, pp. 29–76.
- Varotsos, P.; Lazaridou, M. (27 May 1996b), "Reply to "The VAN earthquake predictions," by D. A. Rhoades and F. F. Evison", Geophysical Research Letters, 23 (11): 1375–1378, Bibcode:1996GeoRL..23.1375V, doi:10.1029/96GL00910, ISSN 1944-8007.
- Varotsos, P.; Lazaridou, M.; Hadjicontis, V. (1996-05-27), "Reply to "Earthquake prediction evaluation standards applied to the VAN Method"", Geophysical Research Letters, 23 (11): 1367–1370, Bibcode:1996GeoRL..23.1367V, doi:10.1029/96GL00916, ISSN 1944-8007.
- Varotsos, P.; Alexopoulos, K.; Nomicos, K.; Lazaridou, M. (1986), "Earthquake prediction and electric signals", Nature, 322 (6075): 120, Bibcode:1986Natur.322..120V, doi:10.1038/322120a0.
- Varotsos, P.; Alexopoulos, K.; Nomicos, K.; Lazaridou, M. (20 September 1988), "Official earthquake prediction procedure in Greece", Tectonophysics, 152 (3-4): 93–196.
- Varotsos, P.; Sarlis, N.; Lazaridou, M.; Kapiris, P. (1998), "Transmission of stress induced electric signals", Journal of Applied Physics, 83: 60–70, Bibcode:1998JAP....83...60V, doi:10.1063/1.366702.
- Varotsos, P.; Sarlis, N.; Skordas, E. (2011), Natural time analysis : the new view of time ; Precursory seismic electric signals, earthquakes and other complex time series, Springer Praxis, ISBN 364216448-X.
- Sarlis, N. V.; Skordas, E. S.; Christopoulos, S.-R. G.; Varotsos, P. A. (January 2016), "Statistical Significance of Minimum of the Order Parameter Fluctuations of Seismicity Before Major Earthquakes in Japan", Pure and Applied Geophysics, 173 (1): 165–172, Bibcode:2016PApGe.173..165S, doi:10.1007/s00024-014-0930-8, ISSN 0033-4553.
- Vidale, John E. (16 February 1996), "Do Big and Little Earthquakes Start Differently?" (PDF), Science, 271 (5251): 953–954, Bibcode:1996Sci...271..953V, doi:10.1126/science.271.5251.953.
- Wade, Nicholas (14 October 1977), "Briefing: More Flowers, less Cabbage" (PDF), Science, 198 (4313): 176–177, Bibcode:1977Sci...198..176W, doi:10.1126/science.198.4313.176-a, PMID 17755352.
- Wang, Kelin; Chen, Qi-Fu; Sun, Shihong; Wang, Andong (June 2006), "Predicting the 1975 Haicheng Earthquake" (PDF), Bulletin of the Seismological Society of America, 96 (3): 757–795, Bibcode:2006BuSSA..96..757W, doi:10.1785/0120050191.
- Ward, Peter L. (1978), "Ch. 3: Earthquake prediction", Geophysical predictions (PDF), National Academy of Sciences.
- Wells, D. L.; Coppersmith, K. J. (August 1994), "New empirical relationships among magnitude, rupture length, rupture width, rupture area, and surface displacement." (PDF), Bulletin of the Seismological Society of America, 84 (4): 974–1002.
- Whitcomb, J. H. (1977), "An update of time-dependent vp/vs and ^Vp in an area of the Transverse Range of southern California [abstract]" (PDF), Eos, Transactions, American Geophysical Union, 58 (5): 305.
- Whitham, K.; Berry, M.J.; Heidebrecht, A.C.; Kanasewich, E.R.; Milne, W.G (1976), "Earthquake Prediction in China", Geoscience Canada, 3 (4): 96, 263–268.
- Wood, H. O.; Gutenberg, B. (6 September 1935), "Earthquake prediction" (PDF), Science, 82 (2123): 219–320, Bibcode:1935Sci....82..219W, doi:10.1126/science.82.2123.219.
- Working Group [on the southern San Andreas fault] (1991), "Short-Term Earthquake Hazard Assessment for the San Andreas Fault in Southern California" (PDF), U.S. Geological Survey, Open-File Report 91-32.
- Working Group on California Earthquake Probabilities; Dawson; Felzer; Frankel; Gupta; Jordan; Parsons; Petersen; Stein; Weldon; Wills (2008), "The Uniform California Earthquake Rupture Forecast, Version 2 (UCERF2)" (PDF), U.S. Geological Survey, Open-File Report 2007-1437 (4): 2053–2107, Bibcode:2009BuSSA..99.2053F, doi:10.1785/0120080049. Also published as California Geological Survey Special Report 203.
- Wyss, M. (1991a), "Introduction", Tectonophysics, 193 (4): 253–254, Bibcode:1991Tectp.193..253W, doi:10.1016/0040-1951(91)90334-o.
- Wyss, M. (1996), "Brief summary of some reasons why the VAN hypothesis for predicting earthquakes has to be rejected", A critical review of VAN, London: Lighthill, S. J. World Scientific, pp. 250–266.
- Wyss, M.; Allmann, L. (1996), "Probability of chance correlations of earthquakes with prediction in areas of heterogeneous seismicity rate: the VAN case", Geophysical Research Letters, 22 (11): 1307–1310, Bibcode:1996GeoRL..23.1307W, doi:10.1029/95GL03548.
- Wyss, Max; Booth, David C. (1997), "The IASPEI procedure for the evaluation of earthquake precursors", Geophysical Journal International, 131 (3): 423–424, Bibcode:1997GeoJI.131..423W, doi:10.1111/j.1365-246X.1997.tb06587.x.
- Yoshii, Hiroaki (30 August 1993), "Social impacts of earthquake prediction in Greece", Tectonophysics, 224 (1-3): 251–255, doi:10.1016/0040-1951(93)90077-W
- Zechar, J. Douglas (August 2008), Methods for Evaluating Earthquake Prediction [dissertation] (PDF), Univ. of Southern California.
- Zechar, J. Douglas; Jordan, Thomas H. (2008), "Testing alarm-based earthquake predictions" (PDF), Geophysical Journal International, 172 (2): 715–724, Bibcode:2008GeoJI.172..715Z, doi:10.1111/j.1365-246X.2007.03676.x.
- Zechar, J. Douglas; Schorlemmer, Danijel; Liukis, Maria; Yu, John; Euchner, Fabian; Maechling, Philip J.; Jordan, Thomas H. (2010), "The Collaboratory for the Study of Earthquake Predictability perspective on computational earthquake science" (PDF), Concurrency and Computation: Practice and Experience, 22 (12): 1836–1847, doi:10.1002/cpe.1519.
- Zoback, Mark D. (21 October 1983), "Seismology [book review of Rikitake, Earthquake Forecasting and Warning]" (PDF), Science, 222 (4621): 319, Bibcode:1983Sci...222..319R, doi:10.1126/science.222.4621.319.
- Zoback, Mary Lou (April–May 2006), "The 1906 earthquake and a century of progress in understanding earthquakes and their hazards" (PDF), GSA Today, 16 (r/5): 4–11, doi:10.1130/GSAT01604.1.
External links
- U.S. Geological Survey: Earthquake Prediction Topics
- Nature magazine — debate on whether earthquake prediction is a realistic scientific goal
- Dr Stuart Robbins (1 September 2012). "Lunatic Earthquakes: Do Tides Cause Quakes?". Exposing PseudoAstronomy Podcast. Retrieved April 2013. Check date values in:
|access-date=(help) - Podcast discussing why the claim that earthquakes can be predicted is false.