Ecological pyramid
An ecological pyramid (also trophic pyramid, eltonian pyramid, energy pyramid, or sometimes food pyramid) is a graphical representation designed to show the biomass or bio productivity at each trophic level in a given ecosystem.
Biomass is the amount of living or organic matter present in an organism. Biomass pyramids show how much biomass is present in the organisms at each trophic level, while productivity pyramids show the production or turnover in biomass.
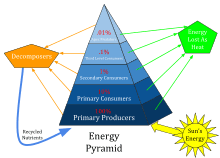
Energy pyramids begin with producers on the bottom (such as plants) and proceed through the various trophic levels (such as herbivores that eat plants, then carnivores that eat herbivores, then carnivores that eat those carnivores, and so on). The highest level is the top of the food chain.
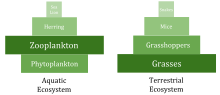
An energy pyramid of biomass shows the relationship between biomass and trophic level by quantifying the biomass present at each trophic level of an energy community at a particular time. It is a graphical representation of biomass (total amount of living or organic matter in an ecosystem) present in unit area in different tropic levels. Typical units are grams per meter2, or calories per meter2. The pyramid of biomass may be "inverted". For example, in a pond ecosystem, the standing crop of phytoplankton, the major producers, at any given point will be lower than the mass of the heterotrophs, such as fish and insects. This is explained as the phytoplankton reproduce very quickly, but have much shorter individual lives.
One problem with biomass pyramids is that they can make a trophic level appear to contain more energy than it actually does. For example, all birds have beaks and skeletons, which despite having mass are not eaten by the next trophic level.
There is also pyramid of numbers which represent the number of organisms in each trophic level. They may be upright (e.g. Grassland ecosystem), inverted (parasitic ecosystem) or dumbbell shaped (forest ecosystem).
Pyramid of productivity
An 'ecological pyramid of productivity' is often more useful, showing the production or turnover of biomass at each trophic level. Instead of showing a single snapshot in time, productivity pyramids show the flow of energy through the food chain. Typical units are grams per meter2 per year or calories per meter2 per year. As with the others, this graph shows producers at the bottom and higher trophic levels on top.
When an ecosystem is healthy, this graph produces a standard ecological pyramid. This is because in order for the ecosystem to sustain itself, there must be more energy at lower trophic levels than there is at higher trophic levels. This allows organisms on the lower levels to not only to maintain a stable population, but also to transfer energy up the pyramid. The exception to this generalization is when portions of a food web are supported by inputs of resources from outside the local community. In small, forested streams, for example, the volume of higher levels is greater than could be supported by the local primary production.
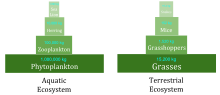
When energy is transferred to the next trophic level, typically only 10% of it is used to build new biomass, becoming stored energy (the rest going to metabolic processes) (Pauly and Christensen, 1995). In this case, in the pyramid of productivity each step will be 10% the size of the previous step (100,000, 10,000, 1,000, 100, 10, 1, .1, .01).
The advantages of the pyramid of productivity as a representation:
- It takes account of the rate of production over a period of time.
- Two species of comparable biomass may have very different life spans. Thus a direct comparison of their total biomasses is misleading, but their productivity is directly comparable.
- The relative energy chain within an ecosystem can be compared using pyramids of energy; also different ecosystems can be compared.
- There are no inverted pyramids.
- The input of solar energy can be added.
The disadvantages of the pyramid of productivity as a representation:
- The rate of biomass production of an organism is required, which involves measuring growth and reproduction through time.
- There is still the difficulty of assigning the organisms to a specific trophic level. As well as the organisms in the food chains there is the problem of assigning the decomposers and detritivores to a particular trophic level.
Nonetheless, productivity pyramids usually provide more insight into an ecological community when the necessary information is available.
An ecological pyramid of numbers shows graphically the population of each level in a food chain.
See also
References
- Odum, E.P. 1971. Fundamentals of Ecology. Third Edition. W.B. Saunders Company, Philadelphia,
- Pauly, D. and Christensen, V. 1995 Primary production required to sustain global fisheries. Nature 374.6519: 255-257.