Fingal County Council election, 1991
Fingal County Council election, 1991

|
|
|
|
|
|
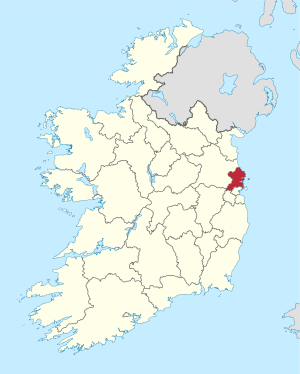
| Map showing the area of Fingal County Council |
|
Council control after election
TBD
|
|
|
An election to Fingal County Council took place on 27 June 1991 as part of that year's Irish local elections. 24 councillors were elected from six electoral divisions by PR-STV voting for an eight-year term of office.
Results by party
Results by Electoral Area
Balbriggan
| Balbriggan - 5 seats |
| Party | Candidate | % 1st Pref | Count 1 | Count 2 | Count 3 | Count 4 | Count 5 | Count 6 | Count 7 | Count 8 | Count 9 | Count 10 | Count 11 |
|
Labour Party |
Ken Farrell* |
17.5% |
1,865 |
|
|
|
|
|
|
|
|
|
|
|
Green Party |
Trevor Sargent |
13.2% |
1,405 |
1,413 |
1,464 |
1,507 |
1,532 |
1,730 |
1,957 |
|
|
|
|
|
Fianna Fáil |
Sean Gilbride* |
10.4% |
1,104 |
1,107 |
1,114 |
1,126 |
1,204 |
1,267 |
1,306 |
1,318 |
1,463 |
1,554 |
1,671 |
|
Fianna Fáil |
Jim Geraghty* |
8.6% |
916 |
922 |
923 |
925 |
1,017 |
1,072 |
1,100 |
1,103 |
1,190 |
1,222 |
1,260 |
|
Fine Gael |
Cathal Boland* |
8.2% |
871 |
878 |
882 |
1,015 |
1,037 |
1,137 |
1,168 |
1,191 |
1,266 |
1,457 |
1,679 |
|
Fianna Fáil |
Jack Larkin* |
6.7% |
711 |
712 |
727 |
744 |
789 |
796 |
862 |
880 |
1,167 |
1,309 |
1,489 |
|
Fianna Fáil |
John Maxwell |
6.2% |
665 |
666 |
668 |
674 |
731 |
732 |
747 |
752 |
|
|
|
|
Labour Party |
Joe Davis |
5.7% |
608 |
653 |
695 |
722 |
738 |
754 |
855 |
897 |
924 |
1,108 |
|
|
Progressive Democrats |
David Murray |
5.5% |
585 |
587 |
595 |
638 |
648 |
681 |
766 |
830 |
879 |
|
|
|
Independent |
Liam Dineen |
5% |
532 |
535 |
553 |
557 |
563 |
|
|
|
|
|
|
|
Independent |
Gertie Sheilds |
4.7% |
503 |
506 |
534 |
565 |
572 |
634 |
|
|
|
|
|
|
Fianna Fáil |
Wilbur McKittrick |
3.5% |
374 |
381 |
386 |
387 |
|
|
|
|
|
|
|
|
Fine Gael |
Patricia Gallen |
2.9% |
313 |
314 |
324 |
|
|
|
|
|
|
|
|
|
Workers' Party |
Anne McCarthy |
1.2% |
123 |
125 |
|
|
|
|
|
|
|
|
|
|
Independent |
Sean Brady |
0.7% |
78 |
78 |
|
|
|
|
|
|
|
|
|
| Electorate: 19,705 Valid: 10,653 (54.1%) Spoilt: 100 Quota: 1,776 Turnout: 10,753 (54.6%) |
Castleknock
| Castleknock - 4 seats |
| Party | Candidate | % 1st Pref | Count 1 | Count 2 | Count 3 | Count 4 | Count 5 | Count 6 | Count 7 | Count 8 | Count 9 | Count 10 | Count 11 |
|
Independent |
Seán Lyons* |
18.5% |
1,378 |
1,396 |
1,412 |
1,446 |
1,523 |
|
|
|
|
|
|
|
Fine Gael |
Tom Morrissey |
15.8% |
1,172 |
1,213 |
1,217 |
1,228 |
1,249 |
1,259 |
1,333 |
1,338 |
1,814 |
|
|
|
Progressive Democrats |
Sheila Terry |
14.7% |
1,093 |
1,099 |
1,106 |
1,121 |
1,172 |
1,214 |
1,401 |
1,417 |
1,683 |
|
|
|
Fianna Fáil |
Ned Ryan* |
10.9% |
807 |
812 |
815 |
818 |
823 |
942 |
978 |
981 |
1,049 |
1,124 |
1,181 |
|
Fine Gael |
Eithne Loftus |
10.5% |
780 |
825 |
829 |
833 |
853 |
878 |
950 |
958 |
|
|
|
|
Fianna Fáil |
Tom Boland* |
10.1% |
752 |
753 |
761 |
768 |
770 |
954 |
989 |
993 |
1,037 |
1,112 |
1,164 |
|
Fianna Fáil |
Miley Caldwell |
5.9% |
439 |
442 |
446 |
450 |
455 |
|
|
|
|
|
|
|
Green Party |
Paul Gogarty |
5.3% |
391 |
391 |
394 |
448 |
549 |
576 |
|
|
|
|
|
|
Workers' Party |
Patricia Condron |
2.6% |
196 |
197 |
213 |
|
|
|
|
|
|
|
|
|
Labour Party |
Joanna Tuffy |
2.2% |
167 |
169 |
239 |
316 |
|
|
|
|
|
|
|
|
Labour Party |
Willie Byrne |
1.8% |
136 |
137 |
|
|
|
|
|
|
|
|
|
|
Fine Gael |
Patrick Malone |
1.7% |
123 |
|
|
|
|
|
|
|
|
|
|
| Electorate: 15,777 Valid: 7,434 (47.1%) Spoilt: 29 Quota: 1,487 Turnout: 7,463 (47.3%) |
Howth
| Howth - 4 seats |
| Party | Candidate | % 1st Pref | Count 1 | Count 2 | Count 3 | Count 4 | Count 5 | Count 6 | Count 7 | Count 8 | Count 9 |
|
Fine Gael |
Michael Joe CosgraveTD* |
17.7% |
1,342 |
1,401 |
1,457 |
1,502 |
1,545 |
|
|
|
|
|
Fine Gael |
Joan Maher* |
15% |
1,141 |
1,155 |
1,204 |
1,255 |
1,300 |
1,301 |
1,541 |
|
|
|
Green Party |
David Healy |
10.4% |
789 |
797 |
869 |
914 |
938 |
943 |
1,155 |
1,275 |
1,454 |
|
Fianna Fáil |
Liam Creaven* |
9.3% |
704 |
822 |
841 |
877 |
1,053 |
1,060 |
1,166 |
1,784 |
|
|
Workers' Party |
Niall Behan |
9.2% |
695 |
711 |
908 |
923 |
953 |
955 |
1,091 |
1,131 |
1,190 |
|
Fianna Fáil |
Dympna Clune |
7.2% |
550 |
589 |
597 |
625 |
893 |
901 |
964 |
|
|
|
Fianna Fáil |
Tom Beary |
6.8% |
519 |
569 |
611 |
617 |
|
|
|
|
|
|
Progressive Democrats |
Noel Peers |
6.7% |
511 |
540 |
570 |
864 |
885 |
888 |
|
|
|
|
Progressive Democrats |
Michael Kenny |
6.6% |
500 |
503 |
522 |
|
|
|
|
|
|
|
Labour Party |
Frank Barry |
6.5% |
497 |
502 |
|
|
|
|
|
|
|
|
Fianna Fáil |
Eugene Rudden |
4.5% |
345 |
|
|
|
|
|
|
|
|
| Electorate: 16,807 Valid: 7,593 (45.2%) Spoilt: 56 Quota: 1,519 Turnout: 7,649 (45.5%) |
Malahide
| Malahide - 4 seats |
| Party | Candidate | % 1st Pref | Count 1 | Count 2 | Count 3 | Count 4 | Count 5 | Count 6 | Count 7 | Count 8 |
|
Fianna Fáil |
Senator G.V. Wright* |
23.1% |
1,929 |
|
|
|
|
|
|
|
|
Labour Party |
Bernie MaloneMEP* |
14.4% |
1,198 |
1,217 |
1,268 |
1,298 |
1,363 |
1,475 |
1,527 |
1,702 |
|
Fine Gael |
Nora OwenTD* |
13.8% |
1,148 |
1,185 |
1,225 |
1,243 |
1,279 |
1,469 |
1,533 |
1,830 |
|
Fianna Fáil |
Michael Kennedy |
11.1% |
923 |
986 |
1,005 |
1,049 |
1,094 |
1,106 |
1,525 |
1,723 |
|
Green Party |
Alan Nagle |
9.7% |
813 |
827 |
856 |
915 |
957 |
1,047 |
1,082 |
1,222 |
|
Fine Gael |
Terri Jones |
8% |
670 |
672 |
705 |
732 |
826 |
848 |
870 |
|
|
Fianna Fáil |
Pat Dunne* |
5.7% |
472 |
581 |
603 |
622 |
629 |
650 |
|
|
|
Progressive Democrats |
Bill O'Brien |
4.7% |
394 |
401 |
405 |
415 |
493 |
|
|
|
|
Progressive Democrats |
Mary Webberley |
4.2% |
347 |
350 |
353 |
374 |
|
|
|
|
|
Independent |
Angela Keaveney |
2.9% |
241 |
244 |
252 |
|
|
|
|
|
|
Fine Gael |
John Hancox |
2.5% |
211 |
213 |
|
|
|
|
|
|
| Electorate: 16,431 Valid: 8,346 (50.8%) Spoilt: 37 Quota: 1,670 Turnout: 8,385 (51%) |
Mulhuddart
| Mulhuddart - 3 seats |
| Party | Candidate | % 1st Pref | Count 1 | Count 2 | Count 3 | Count 4 | Count 5 | Count 6 | Count 7 | Count 8 |
|
Independent |
Joe Higgins |
19.6% |
1,281 |
1,294 |
1,316 |
1,347 |
1,464 |
1,581 |
1,652 |
|
|
Fine Gael |
Marian Sheehan* |
29.2% |
906 |
920 |
933 |
1,020 |
1,025 |
1,151 |
1,200 |
1,289 |
|
Fianna Fáil |
Marian McGennis* |
13.8% |
903 |
955 |
969 |
1,031 |
1,054 |
1,099 |
1,536 |
1,642 |
|
Labour Party |
Joan Burton |
12.9% |
844 |
856 |
887 |
916 |
934 |
1,018 |
1,074 |
1,499 |
|
Workers' Party |
Ollie Lunney |
10.3% |
672 |
682 |
706 |
718 |
771 |
837 |
868 |
|
|
Fianna Fáil |
Jim Fahey* |
9.5% |
620 |
651 |
662 |
670 |
685 |
730 |
|
|
|
Independent |
Tom Reynolds |
6.9% |
450 |
459 |
491 |
507 |
527 |
|
|
|
|
Sinn Féin |
Jim Heffernan |
4% |
264 |
267 |
275 |
282 |
|
|
|
|
|
Fine Gael |
Jim Fleming |
3.9% |
254 |
255 |
268 |
|
|
|
|
|
|
Green Party |
Anthony McGuinness |
2.6% |
168 |
177 |
|
|
|
|
|
|
|
Fianna Fáil |
P.J. Leahy |
1.9% |
123 |
|
|
|
|
|
|
|
|
Independent |
Frank Clarke |
0.54% |
35 |
|
|
|
|
|
|
|
| Electorate: 13,768 Valid: 6,520 (47.4%) Spoilt: 72 Quota: 1,631 Turnout: 6,592 (47.9%) |
Swords
| Swords - 4 seats |
| Party | Candidate | % 1st Pref | Count 1 | Count 2 | Count 3 | Count 4 | Count 5 | Count 6 | Count 7 | Count 8 | Count 9 |
|
Labour Party |
Seán RyanTD* |
34.7% |
2,667 |
|
|
|
|
|
|
|
|
|
Fianna Fáil |
Cyril Gallagher* |
11.3% |
872 |
963 |
998 |
1,003 |
1,046 |
1,496 |
1,562 |
|
|
|
Fianna Fáil |
Margaret O'Connor |
10.5% |
809 |
846 |
854 |
917 |
963 |
1,177 |
1,285 |
1,299 |
1,316 |
|
Fianna Fáil |
Larry Mulvihil |
9.5% |
727 |
821 |
840 |
857 |
887 |
|
|
|
|
|
Fine Gael |
Anne Devitt* |
9% |
689 |
783 |
875 |
893 |
988 |
1,065 |
1,268 |
1,316 |
1,324 |
|
Green Party |
Tommy Nolan |
6.7% |
514 |
608 |
640 |
718 |
893 |
937 |
|
|
|
|
Labour Party |
Tom Kelleher* |
5.9% |
453 |
1,006 |
1,034 |
1,154 |
1,251 |
1,287 |
1,599 |
|
|
|
Independent |
Elaine Hobson |
5.3% |
406 |
466 |
507 |
562 |
|
|
|
|
|
|
Workers' Party |
Tim O'Brien |
4% |
306 |
366 |
380 |
|
|
|
|
|
|
|
Fine Gael |
Tom McCormack |
1.7% |
133 |
162 |
|
|
|
|
|
|
|
|
Independent |
Noel Crosbie |
1.4% |
108 |
126 |
|
|
|
|
|
|
|
| Electorate: 17,053 Valid: 7,684 (45%) Spoilt: 54 Quota: 1,537 Turnout: 7,738 (45.4%) |
External links