Monaghan County Council election, 1991
Monaghan County Council election, 1991

|
|
|
|
|
|
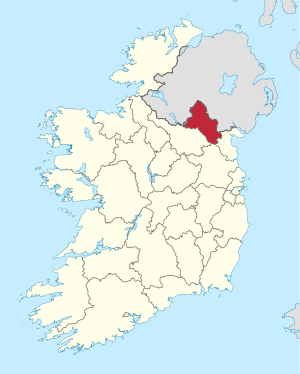
| Map showing the area of Monaghan County Council |
|
Council control after election
TBD
|
|
|
An election to Monaghan County Council took place on 27 June 1991 as part of that year's Irish local elections. 20 councillors were elected from four electoral divisions by PR-STV voting for a five-year term of office.
Results by party
Results by Electoral Area
Carrickmacross
| Carrickmacross - 5 seats |
| Party | Candidate | % 1st Pref | Count 1 | Count 2 | Count 3 | Count 4 | Count 5 | Count 6 | Count 7 | Count 8 |
|
Fine Gael |
Bill CotterTD* |
22.4% |
1,435 |
|
|
|
|
|
|
|
|
Fianna Fáil |
Pádraig McNally* |
18.7% |
1,198 |
|
|
|
|
|
|
|
|
Fianna Fáil |
Rosaleen O'Hanlon* |
14.3% |
917 |
965 |
1,024 |
1,087 |
|
|
|
|
|
Fine Gael |
Patrick Jones* |
12.6% |
808 |
1,031 |
1,041 |
1,092 |
|
|
|
|
|
Independent |
Peter Murphy |
9.6% |
615 |
647 |
653 |
691 |
698 |
704 |
802 |
926 |
|
Fianna Fáil |
Tom Freeman |
8% |
515 |
532 |
556 |
584 |
591 |
596 |
659 |
873 |
|
Fianna Fáil |
Joe Meegan |
5.7% |
367 |
382 |
403 |
435 |
440 |
445 |
509 |
|
|
Sinn Féin |
Brian Meegan |
4.7% |
303 |
312 |
316 |
348 |
353 |
356 |
|
|
|
Workers' Party |
Francis O'Donoghue |
3.9% |
249 |
272 |
272 |
|
|
|
|
|
| Electorate: 9,384 Valid: 6,407 (68.28%) Spoilt: 53 Quota: 1,068 Turnout: 6,460 (68.84%) |
Castleblayney
| Castleblayney- 5 seats |
| Party | Candidate | % 1st Pref | Count 1 | Count 2 | Count 3 | Count 4 | Count 5 | Count 6 | Count 7 |
|
Fianna Fáil |
Senator Francis O'Brien* |
19.1% |
1,105 |
|
|
|
|
|
|
|
Fine Gael |
Arthur Carville* |
18.6% |
1,080 |
|
|
|
|
|
|
|
Fianna Fáil |
Brendan Hughes* |
15.2% |
879 |
911 |
929 |
944 |
1,044 |
|
|
|
Fine Gael |
John F. Conlan* |
13.4% |
777 |
805 |
841 |
939 |
1,002 |
|
|
|
Fine Gael |
Adam Armstrong |
12.2% |
710 |
716 |
757 |
781 |
811 |
828 |
847 |
|
Fianna Fáil |
Olivia Keenan |
10.3% |
598 |
650 |
661 |
714 |
797 |
836 |
852 |
|
Sinn Féin |
Malachy Woods |
6.4% |
370 |
378 |
383 |
456 |
|
|
|
|
Independent |
Talbot Duffy |
4.8% |
280 |
292 |
294 |
|
|
|
|
| Electorate: 8,853 Valid: 5,799 (65.5%) Spoilt: 59 Quota: 967 Turnout: 5,858 (65.87%) |
Clones
Monaghan
| Monaghan - 6 seats |
| Party | Candidate | % 1st Pref | Count 1 | Count 2 | Count 3 | Count 4 | Count 5 |
|
Sinn Féin |
Caoimhghin O Caolain* |
16.8% |
1,193 |
|
|
|
|
|
Fianna Fáil |
Patsy Treanor* |
15.9% |
1,127 |
|
|
|
|
|
Fianna Fáil |
Willie McKenna* |
14.4% |
1,019 |
|
|
|
|
|
Fine Gael |
Stephen McAree* |
12.7% |
899 |
905 |
921 |
978 |
1,269 |
|
Independent |
Noel Maxwell |
12.4% |
877 |
882 |
887 |
925 |
969 |
|
Sinn Féin |
Brian McKenna |
11.3% |
798 |
942 |
953 |
1,003 |
1,017 |
|
Fianna Fáil |
Matt Caulfield |
7% |
499 |
507 |
574 |
617 |
644 |
|
Fine Gael |
Timothy O'Hanrahan |
5.8% |
410 |
417 |
425 |
443 |
|
|
Independent |
Plunkett McKenna |
3.8% |
267 |
277 |
284 |
|
|
| Electorate: 11,830 Valid: 7,089 (59.92%) Spoilt: 77 Quota: 1,013 Turnout: 7,166 (60.57%) |
External links
Preceded by
Monaghan County Council election, 1985 |
Monaghan County Council elections |
Succeeded by
Monaghan County Council election, 1991 |