Offaly County Council election, 1991
Offaly County Council election, 1991

|
|
|
|
|
|
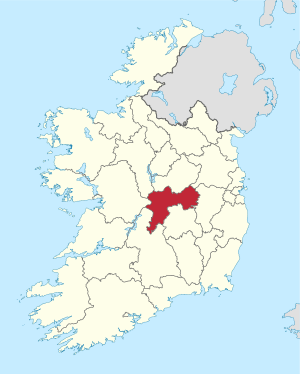
| Map showing the area of Offaly County Council |
|
Council control after election
TBD
|
|
|
An election to Offaly County Council took place on 27 June 1991 as part of that year's Irish local elections. 21 councillors were elected from five electoral divisions by PR-STV voting for an eight-year term of office.
Results by party
Results by Electoral Area
Birr
| Birr- 5 seats |
| Party | Candidate | % 1st Pref | Count 1 | Count 2 | Count 3 | Count 4 | Count 5 | Count 6 | Count 7 | Count 8 |
|
Fine Gael |
Tom EnrightTD* |
15.5% |
924 |
966 |
1,076 |
|
|
|
|
|
|
Fianna Fáil |
Pat Moylan* |
13.2% |
789 |
823 |
898 |
908 |
1,010 |
|
|
|
|
Fine Gael |
Percy Clendennen |
12.4% |
742 |
760 |
801 |
820 |
876 |
896 |
904 |
906 |
|
Fianna Fáil |
Seamus Loughnane* |
11.4% |
681 |
725 |
794 |
813 |
1,037 |
|
|
|
|
Fianna Fáil |
Pat McLoughney |
11% |
658 |
689 |
732 |
740 |
|
|
|
|
|
Fine Gael |
Joe Clear* |
11% |
657 |
678 |
749 |
759 |
873 |
896 |
904 |
907 |
|
Fianna Fáil |
Joe Dooley* |
10.7% |
635 |
688 |
796 |
812 |
999 |
|
|
|
|
Sinn Féin |
John Carroll |
9.6% |
570 |
601 |
|
|
|
|
|
|
|
Independent |
Neayvn Kavanagh |
5.1% |
304 |
|
|
|
|
|
|
|
| Electorate: 9,171 Valid: 5,960 (64.99%) Spoilt: 41 Quota: 994 Turnout: 6,001 (65.43%) |
Edenderry
| Edenderry - 5 seats |
| Party | Candidate | % 1st Pref | Count 1 | Count 2 | Count 3 | Count 4 | Count 5 | Count 6 | Count 7 | Count 8 |
|
Fine Gael |
Michael Fox* |
15.6% |
915 |
917 |
937 |
1,038 |
|
|
|
|
|
Independent |
James Flanagan* |
13.6% |
795 |
844 |
870 |
910 |
942 |
951 |
1,194 |
656 |
|
Fianna Fáil |
Frank Weir |
12.3% |
718 |
718 |
791 |
806 |
894 |
898 |
920 |
926 |
|
Fianna Fáil |
Noel Bourke |
11.6% |
681 |
701 |
713 |
733 |
746 |
752 |
904 |
982 |
|
Fianna Fáil |
Paddy Scully* |
11.6% |
677 |
678 |
684 |
709 |
728 |
747 |
773 |
781 |
|
Progressive Democrats |
Tom O'Connell |
9.9% |
579 |
597 |
608 |
642 |
660 |
673 |
|
|
|
Progressive Democrats |
Brigid Emerson |
7.4% |
436 |
438 |
506 |
541 |
675 |
685 |
832 |
867 |
|
Fine Gael |
Jack Dunne |
6.2% |
361 |
363 |
388 |
425 |
|
|
|
|
|
Green Party |
Anthony Dolan |
5.1% |
299 |
305 |
333 |
|
|
|
|
|
|
Labour Party |
Sean Coughlan |
4.9% |
289 |
292 |
|
|
|
|
|
|
|
Independent |
William Brereton |
1.9% |
111 |
|
|
|
|
|
|
|
| Electorate: 10,007 Valid: 5,861 (58.57%) Spoilt: 73 Quota: 977 Turnout: 5,934 (59.3%) |
Ferbane
| Ferbane- 5 seats |
| Party | Candidate | % 1st Pref | Count 1 | Count 2 | Count 3 | Count 4 |
|
Fine Gael |
Connie Hanniffy* |
22.4% |
1,183 |
|
|
|
|
Fianna Fáil |
Eamon Dooley* |
18.3% |
966 |
|
|
|
|
Independent |
Johnny Butterfield* |
15.7% |
829 |
886 |
|
|
|
Fianna Fáil |
Tom Feighery* |
12.8% |
680 |
695 |
804 |
848 |
|
Fine Gael |
Bernard Corcoran* |
12.7% |
673 |
840 |
1,061 |
|
|
Fianna Fáil |
Patrick Mahon* |
10.3% |
544 |
562 |
602 |
608 |
|
Fine Gael |
Pat Troy |
7.9% |
417 |
460 |
|
|
| Electorate: 8,914 Valid: 5,292 (59.37%) Spoilt: 55 Quota: 883 Turnout: 5,347 (59.98%) |
Tullamore
| Tullamore - 6 seats |
| Party | Candidate | % 1st Pref | Count 1 | Count 2 | Count 3 | Count 4 | Count 5 | Count 6 | Count 7 | Count 8 | Count 9 |
|
Fianna Fáil |
Brian CowenTD* |
15% |
1,141 |
|
|
|
|
|
|
|
|
|
Fianna Fáil |
John Flanagan* |
12.5% |
953 |
965 |
981 |
994 |
1,018 |
1,072 |
1,113 |
|
|
|
Independent |
Thomas Dolan* |
11.1% |
844 |
860 |
875 |
879 |
902 |
926 |
950 |
966 |
1,013 |
|
Fine Gael |
Tommy McKeigue |
10.9% |
830 |
854 |
855 |
882 |
913 |
946 |
1,057 |
1,118 |
|
|
Labour Party |
Pat Gallagher |
9.5% |
722 |
742 |
743 |
808 |
842 |
894 |
921 |
1,099 |
|
|
Fine Gael |
Frank Feery* |
9.3% |
708 |
712 |
719 |
722 |
724 |
737 |
798 |
810 |
848 |
|
Fianna Fáil |
Miriam O'Callaghan* |
9.3% |
706 |
722 |
729 |
747 |
781 |
797 |
816 |
851 |
1,076 |
|
Fianna Fáil |
Michael Lynam |
5.3% |
403 |
405 |
408 |
412 |
422 |
430 |
441 |
448 |
|
|
Fine Gael |
Kevin Wrafter |
3.8% |
289 |
298 |
299 |
304 |
309 |
310 |
|
|
|
|
Labour Party |
Laurence Byrne |
3.3% |
250 |
258 |
259 |
270 |
280 |
|
|
|
|
|
Labour Party |
Ernest McGuire |
2.9% |
223 |
232 |
233 |
265 |
292 |
360 |
368 |
|
|
|
Labour Party |
Seán O'Brien |
2.7% |
202 |
204 |
204 |
|
|
|
|
|
|
|
Independent |
Anne O'Toole |
2.5% |
193 |
207 |
207 |
219 |
|
|
|
|
|
|
Independent |
Peadar Keeley |
1% |
78 |
|
|
|
|
|
|
|
|
|
Independent |
May Keeley |
0.5% |
41 |
|
|
|
|
|
|
|
|
|
Independent |
Nellie Gaffney |
0.3% |
26 |
70 |
|
|
|
|
|
|
|
| Electorate: 12,610 Valid: 7,609 (60.34%) Spoilt: 64 Quota: 1,088 Turnout: 7,673 (60.85%) |
External links