Kildare County Council election, 1991
Kildare County Council election, 1991

|
|
|
|
|
|
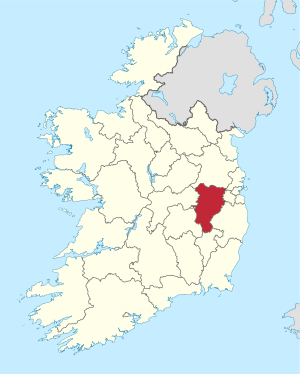
| Map showing the area of Kildare County Council |
|
Council control after election
TBD
|
|
|
An election to Kildare County Council took place on 27 June 1991 as part of that year's Irish local elections. 25 councillors were elected from six electoral divisions by PR-STV voting for a five-year term of office.
Results by party
Results by Electoral Area
Athy
| Athy - 4 seats |
| Party | Candidate | % 1st Pref | Count 1 | Count 2 | Count 3 | Count 4 | Count 5 | Count 6 | Count 7 | Count 8 | Count 9 |
|
Independent |
Joseph Bermingham* |
19.3% |
1,291 |
1,336 |
1,376 |
|
|
|
|
|
|
|
Fianna Fáil |
Martin Miley* |
19.3% |
932 |
943 |
1,027 |
1,050 |
1,058 |
1,277 |
1,356 |
|
|
|
Sinn Féin |
Paddy Wright* |
12.6% |
843 |
879 |
890 |
910 |
916 |
1,007 |
1,168 |
1,176 |
1,313 |
|
Fine Gael |
Rainsford Hendy |
10.5% |
705 |
720 |
727 |
852 |
854 |
870 |
922 |
925 |
1,192 |
|
Labour Party |
John Keating |
8.2% |
548 |
575 |
585 |
637 |
639 |
661 |
|
|
|
|
Fine Gael |
Sean Cunnane |
7.8% |
520 |
533 |
556 |
590 |
594 |
679 |
756 |
759 |
|
|
Fianna Fáil |
Eamon Kane |
7.5% |
503 |
505 |
561 |
641 |
648 |
716 |
771 |
776 |
836 |
|
Fianna Fáil |
Frank Taaffe |
7.5% |
502 |
515 |
549 |
563 |
565 |
|
|
|
|
|
Progressive Democrats |
David Cope |
5.4% |
364 |
377 |
400 |
|
|
|
|
|
|
|
Fianna Fáil |
Michael Behan |
4.3% |
288 |
293 |
|
|
|
|
|
|
|
|
Green Party |
Ronnie Cullen |
2.1% |
141 |
|
|
|
|
|
|
|
|
|
Workers' Party |
Eugene Little |
0.8% |
51 |
|
|
|
|
|
|
|
|
| Electorate: 12,209 Valid: 6,688 (54.78%) Spoilt: 73 Quota: 1,338 Turnout: 6,761 (55.38%) |
Celbridge
| Celbridge - 5 seats |
| Party | Candidate | % 1st Pref | Count 1 | Count 2 | Count 3 | Count 4 | Count 5 | Count 6 | Count 7 | Count 8 | Count 9 | Count 10 | Count 11 | Count 12 |
|
Labour Party |
Emmet StaggTD* |
15.1% |
1,449 |
1,460 |
1,464 |
1,488 |
1,527 |
1,574 |
1,677 |
|
|
|
|
|
|
Workers' Party |
Catherine Murphy |
12.9% |
1,242 |
1,250 |
1,255 |
1,263 |
1,304 |
1,312 |
1,340 |
1,346 |
1,448 |
1,472 |
1,506 |
1,748 |
|
Labour Party |
Colm Purcell* |
10.1% |
965 |
969 |
979 |
986 |
1,010 |
1,012 |
1,031 |
1,051 |
1,101 |
1,131 |
1,146 |
1,393 |
|
Fine Gael |
Bernard DurkanTD* |
9.6% |
923 |
928 |
1,024 |
1,058 |
1,074 |
1,258 |
1,331 |
1,352 |
1,429 |
1,499 |
1,587 |
1,745 |
|
Fianna Fáil |
Gerry Brady* |
8.5% |
817 |
824 |
827 |
854 |
861 |
869 |
894 |
899 |
932 |
1,162 |
1,607 |
|
|
Labour Party |
John McGinley |
8.3% |
799 |
813 |
814 |
853 |
873 |
875 |
888 |
897 |
931 |
936 |
948 |
981 |
|
Independent |
Finbarr Kelly |
6.1% |
588 |
598 |
611 |
624 |
649 |
654 |
680 |
682 |
847 |
861 |
881 |
|
|
Fianna Fáil |
Mairead Byrne |
5.1% |
488 |
488 |
489 |
491 |
504 |
522 |
575 |
585 |
592 |
735 |
|
|
|
Fianna Fáil |
Tim Cotter |
5% |
480 |
482 |
488 |
488 |
494 |
516 |
546 |
548 |
573 |
|
|
|
|
Independent |
John Colgan |
4.7% |
447 |
450 |
462 |
475 |
505 |
512 |
539 |
541 |
|
|
|
|
|
Progressive Democrats |
Mairín Hyland |
3.9% |
372 |
376 |
383 |
386 |
408 |
443 |
|
|
|
|
|
|
|
Fine Gael |
Catherine McGarry |
3.3% |
314 |
314 |
343 |
343 |
350 |
|
|
|
|
|
|
|
|
Green Party |
Catherine Power |
2.6% |
248 |
251 |
254 |
263 |
|
|
|
|
|
|
|
|
|
Fine Gael |
Gerard Gallery |
2% |
193 |
194 |
|
|
|
|
|
|
|
|
|
|
|
Independent |
Fred Leavy |
1.7% |
163 |
197 |
198 |
|
|
|
|
|
|
|
|
|
|
Independent |
Sean Horan |
1.1% |
107 |
|
|
|
|
|
|
|
|
|
|
|
| Electorate: 20,088 Valid: 9,595 (44.92) Spoilt: 47 Quota: 1,600 Turnout: 9,642 (48%) |
Clane
| Clane - 4 seats |
| Party | Candidate | % 1st Pref | Count 1 | Count 2 | Count 3 | Count 4 | Count 5 | Count 6 |
|
Fine Gael |
Sean Reilly* |
20.8% |
1,376 |
|
|
|
|
|
|
Fianna Fáil |
Michael Fitzpatrick |
14.1% |
935 |
939 |
973 |
992 |
|
|
|
Fianna Fáil |
P.J. Sheridan |
14% |
926 |
935 |
984 |
1,020 |
1,296 |
1,370 |
|
Fine Gael |
Jim Reilly* |
13.3% |
879 |
907 |
1,014 |
1,073 |
1,194 |
1,198 |
|
Fianna Fáil |
Liam Doyle* |
11.9% |
788 |
790 |
862 |
1,020 |
1,406 |
|
|
Labour Party |
Michael McCormack |
9.8% |
647 |
648 |
715 |
1,034 |
1,130 |
1,135 |
|
Labour Party |
Rose Murphy |
8.8% |
584 |
588 |
673 |
|
|
|
|
Progressive Democrats |
Noel Lyons |
4% |
262 |
265 |
|
|
|
|
|
Green Party |
Daragh Davernport |
1.7% |
112 |
113 |
|
|
|
|
|
Green Party |
Deirdre O'Sullivan |
1.6% |
105 |
106 |
|
|
|
|
| Electorate: 12,455 Valid: 6,614 (53.1%) Spoilt: 62 Quota: 1,323 Turnout: 6,676 (53.6%) |
Kildare
| Kildare - 5 seats |
| Party | Candidate | % 1st Pref | Count 1 | Count 2 | Count 3 | Count 4 | Count 5 | Count 6 | Count 7 | Count 8 |
|
Fianna Fáil |
Seán Ó Fearghail* |
14.2% |
1,012 |
1,021 |
1,034 |
1,050 |
1,122 |
1,149 |
1,211 |
|
|
Progressive Democrats |
John Dardis |
11.7% |
835 |
873 |
913 |
954 |
999 |
1,037 |
1,071 |
1,137 |
|
Fianna Fáil |
Jimmy O'Loughlin* |
11% |
786 |
791 |
838 |
889 |
912 |
924 |
938 |
1,176 |
|
Fine Gael |
Michael McWey* |
10.5% |
751 |
757 |
771 |
854 |
884 |
1,036 |
1,094 |
1,179 |
|
Labour Party |
Jim Keane |
9.3% |
665 |
689 |
702 |
710 |
777 |
808 |
1,076 |
1,127 |
|
Fianna Fáil |
Paddy Aspell* |
9% |
643 |
658 |
681 |
682 |
801 |
809 |
823 |
918 |
|
Fianna Fáil |
Denis Mahon |
7.9% |
566 |
574 |
580 |
581 |
608 |
749 |
757 |
|
|
Labour Party |
Mary Kavanagh |
5.8% |
414 |
440 |
453 |
460 |
478 |
503 |
|
|
|
Fine Gael |
Con Carr |
5.7% |
408 |
419 |
420 |
455 |
463 |
|
|
|
|
Fianna Fáil |
Angela Doyle |
5.7% |
406 |
427 |
434 |
435 |
|
|
|
|
|
Fine Gael |
John Joe Murphy |
3.2% |
230 |
235 |
258 |
|
|
|
|
|
|
Independent |
Harry Price |
3.1% |
221 |
232 |
|
|
|
|
|
|
|
Green Party |
Olive Brady |
2.7% |
193 |
|
|
|
|
|
|
|
| Electorate: 14,895 Valid: 7,130 (47.87%) Spoilt: 61 Quota: 1,189 Turnout: 7,191 (48.28%) |
Naas
| Naas - 7 seats |
| Party | Candidate | % 1st Pref | Count 1 | Count 2 | Count 3 | Count 4 | Count 5 | Count 6 | Count 7 | Count 8 | Count 9 | Count 10 | Count 11 | Count 12 | Count 13 | Count 14 |
|
Fianna Fáil |
Paddy Power* |
11% |
1,146 |
1,150 |
1,156 |
1,163 |
1,209 |
1,221 |
1,235 |
1,253 |
1,420 |
|
|
|
|
|
|
Independent |
Patsy Lawlor* |
11% |
1,145 |
1,150 |
1,164 |
1,171 |
1,217 |
1,229 |
1,265 |
1,292 |
1,360 |
|
|
|
|
|
|
Fianna Fáil |
John O'Neill* |
9.4% |
977 |
986 |
986 |
1,020 |
1,036 |
1,039 |
1,053 |
1,079 |
1,109 |
1,153 |
1,254 |
1,269 |
1,273 |
1,302 |
|
Progressive Democrats |
Timmy Conway* |
9.1% |
947 |
950 |
962 |
965 |
973 |
997 |
1,009 |
1,031 |
1,074 |
1,083 |
1,152 |
1,227 |
1,239 |
1,341 |
|
Fine Gael |
Mary French |
7.7% |
800 |
803 |
809 |
811 |
819 |
822 |
833 |
837 |
852 |
853 |
886 |
1,078 |
1,089 |
1,144 |
|
Fine Gael |
Michael Nolan, Snr* |
6.9% |
717 |
725 |
725 |
750 |
753 |
757 |
780 |
811 |
816 |
816 |
942 |
1,081 |
1,083 |
1,130 |
|
Fianna Fáil |
Paddy Behan* |
6.1% |
630 |
631 |
639 |
639 |
684 |
696 |
704 |
710 |
786 |
845 |
862 |
882 |
891 |
935 |
|
Fine Gael |
Billy Hillis* |
5.7% |
597 |
599 |
602 |
603 |
605 |
669 |
674 |
683 |
689 |
690 |
703 |
|
|
|
|
Green Party |
Sean English |
4.8% |
504 |
510 |
612 |
626 |
630 |
643 |
685 |
707 |
738 |
741 |
824 |
899 |
904 |
1,103 |
|
Independent |
Colm Feeney |
4.6% |
480 |
486 |
496 |
541 |
541 |
542 |
569 |
610 |
612 |
612 |
|
|
|
|
|
Labour Party |
Norman Croke |
4.5% |
465 |
468 |
471 |
478 |
485 |
545 |
581 |
760 |
780 |
783 |
828 |
846 |
852 |
|
|
Fianna Fáil |
Mary Robinson |
4.3% |
444 |
444 |
453 |
454 |
475 |
479 |
489 |
497 |
|
|
|
|
|
|
|
Labour Party |
Simon Donohoe |
3% |
317 |
324 |
326 |
333 |
333 |
395 |
439 |
|
|
|
|
|
|
|
|
Labour Party |
Tom Geoghegan |
2.8% |
289 |
290 |
294 |
295 |
297 |
|
|
|
|
|
|
|
|
|
|
Workers' Party |
Mary Larkin |
2.5% |
263 |
272 |
277 |
302 |
304 |
318 |
|
|
|
|
|
|
|
|
|
Fianna Fáil |
Andy Kelly |
2.1% |
216 |
217 |
217 |
219 |
|
|
|
|
|
|
|
|
|
|
|
Green Party |
Peter Sweetman |
1.8% |
189 |
193 |
|
|
|
|
|
|
|
|
|
|
|
|
|
Independent |
Dan O'Sullivan |
1.7% |
175 |
196 |
203 |
|
|
|
|
|
|
|
|
|
|
|
|
Independent |
Peter Kennedy |
1% |
101 |
|
|
|
|
|
|
|
|
|
|
|
|
|
| Electorate: 24,361 Valid: 10,394 (42.67%) Spoilt: 83 Quota: 1,300 Turnout: 10,477 (43.01%) |
External links