Meath County Council election, 1991
Meath County Council election, 1991

|
|
|
|
|
|
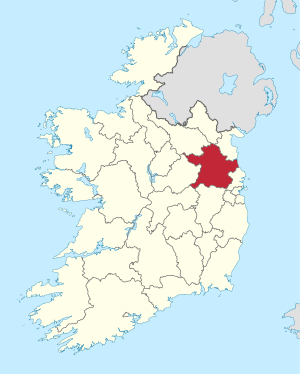
| Map showing the area of Meath County Council |
|
Council control after election
TBD
|
|
|
An election to Meath County Council took place on 27 June 1991 as part of that year's Irish local elections. 29 councillors were elected from five electoral divisions by PR-STV voting for an eight-year term of office.
Results by party
Results by Electoral Area
Dunshaughlin
| Dunshaughlin - 5 seats |
| Party | Candidate | % 1st Pref | Count 1 | Count 2 | Count 3 | Count 4 | Count 5 | Count 6 | Count 7 | Count 8 |
|
Fianna Fáil |
Mary WallaceTD* |
19.4% |
1,469 |
|
|
|
|
|
|
|
|
Labour Party |
Brian Fitzgerald* |
15.8% |
1,196 |
1,214 |
1,262 |
1,326 |
|
|
|
|
|
Fine Gael |
Mary Sylver* |
13.1% |
994 |
1,009 |
1,014 |
1,030 |
1,039 |
1,157 |
1,198 |
1,230 |
|
Fianna Fáil |
Conor Tormey |
11.7% |
885 |
949 |
953 |
969 |
971 |
994 |
1,109 |
1,192 |
|
Fine Gael |
John Fanning |
11.3% |
855 |
862 |
876 |
882 |
883 |
984 |
1,151 |
1,184 |
|
Fianna Fáil |
Tadhg Delaney* |
8.1% |
613 |
662 |
665 |
679 |
683 |
719 |
733 |
1,053 |
|
Fianna Fáil |
Donal Clynch |
6.1% |
461 |
496 |
497 |
516 |
521 |
548 |
559 |
|
|
Workers' Party |
John King |
5.5% |
417 |
419 |
430 |
452 |
459 |
496 |
|
|
|
Progressive Democrats |
Joe Fernandez |
5% |
376 |
384 |
387 |
404 |
406 |
|
|
|
|
Sinn Féin |
Thomas McDonnell |
2.9% |
219 |
223 |
224 |
|
|
|
|
|
|
Labour Party |
Eamon Tuttle |
1.3% |
97 |
100 |
|
|
|
|
|
|
| Electorate: 15,984 Valid: 7,582 (47.43%) Spoilt: 88 Quota: 1,264 Turnout: 7,648 (47.85%) |
Kells
| Kells - 7 seats |
| Party | Candidate | % 1st Pref | Count 1 | Count 2 | Count 3 | Count 4 | Count 5 | Count 6 | Count 7 | Count 8 | Count 9 | Count 10 |
|
Fianna Fáil |
Michael Lynch* |
16.6% |
1,630 |
1,705 |
|
|
|
|
|
|
|
|
|
Fine Gael |
John V. FarrellyTD* |
13.1% |
1,293 |
|
|
|
|
|
|
|
|
|
|
Fine Gael |
Gerry Gibney |
10% |
980 |
1,069 |
1,078 |
1,097 |
1,101 |
1,119 |
1,122 |
1,130 |
1,130 |
1,180 |
|
Fianna Fáil |
Johnny Brady* |
9.5% |
932 |
1,052 |
1,054 |
1,067 |
1,085 |
1,098 |
1,217 |
1,273 |
|
|
|
Fianna Fáil |
Sebastian Rooney* |
7.9 |
780 |
834 |
836 |
846 |
864 |
895 |
990 |
1,127 |
1,149 |
1,285 |
|
Fianna Fáil |
James Weldon* |
7.3% |
717 |
750 |
755 |
762 |
772 |
789 |
815 |
1,162 |
1,176 |
1,212 |
|
Fianna Fáil |
Fergus Muldoon* |
7% |
693 |
719 |
725 |
732 |
742 |
749 |
766 |
|
|
|
|
Fine Gael |
Tom Bradley* |
6.8% |
672 |
683 |
709 |
711 |
716 |
787 |
792 |
826 |
829 |
916 |
|
Independent |
Jack Fitzsimons |
6.6% |
648 |
664 |
668 |
700 |
731 |
794 |
820 |
879 |
881 |
1,127 |
|
Labour Party |
Tommy Grimes |
6.2% |
608 |
617 |
621 |
653 |
714 |
735 |
798 |
810 |
810 |
|
|
Fianna Fáil |
James O'Rourke |
3% |
300 |
324 |
325 |
330 |
360 |
367 |
|
|
|
|
|
Progressive Democrats |
Caroline Mhic Daeid |
2.6% |
254 |
258 |
259 |
262 |
265 |
|
|
|
|
|
|
Independent |
John Maguire |
1.9% |
187 |
194 |
195 |
202 |
|
|
|
|
|
|
|
Sinn Féin |
Patrick McCabe |
1.6% |
154 |
159 |
159 |
|
|
|
|
|
|
|
| Electorate: 16,291 Valid: 9,848 (60.45%) Spoilt: 104 Quota: 1,232 Turnout: 9,952 (61.09%) |
Navan
| Navan - 7 seats |
| Party | Candidate | % 1st Pref | Count 1 | Count 2 | Count 3 | Count 4 | Count 5 | Count 6 | Count 7 | Count 8 | Count 9 | Count 10 | Count 11 |
|
Fianna Fáil |
Paddy Fitzsimons* |
11.8% |
973 |
976 |
1,035 |
|
|
|
|
|
|
|
|
|
Fine Gael |
Patsy O'Neill* |
8.9% |
731 |
738 |
740 |
741 |
753 |
769 |
778 |
881 |
933 |
933 |
981 |
|
Fianna Fáil |
Jimmy Mangan* |
8.4% |
689 |
692 |
713 |
715 |
730 |
743 |
816 |
832 |
889 |
891 |
897 |
|
Workers' Party |
Christy Gorman |
8.1% |
663 |
685 |
694 |
709 |
735 |
852 |
887 |
917 |
969 |
969 |
970 |
|
Progressive Democrats |
Patrick Andrews |
7.3% |
599 |
606 |
614 |
619 |
654 |
671 |
696 |
752 |
|
|
|
|
Fine Gael |
Noel Foley |
7.1% |
584 |
587 |
596 |
600 |
619 |
632 |
658 |
945 |
1,117 |
|
|
|
Fianna Fáil |
Owen Heaney* |
6.8% |
563 |
563 |
588 |
589 |
596 |
611 |
780 |
804 |
892 |
895 |
903 |
|
Fine Gael |
Jim D'Arcy* |
6.8% |
561 |
566 |
566 |
571 |
579 |
601 |
610 |
|
|
|
|
|
Independent |
Patricia Hegarty |
6.8% |
556 |
572 |
576 |
796 |
825 |
866 |
904 |
934 |
1,024 |
1,025 |
1,033 |
|
Labour Party |
Brendan Clusker* |
6.5% |
533 |
566 |
586 |
597 |
721 |
766 |
831 |
869 |
989 |
989 |
1,006 |
|
Sinn Féin |
Joe Reilly |
5.3% |
435 |
440 |
443 |
449 |
459 |
|
|
|
|
|
|
|
Fianna Fáil |
Frank Carberry |
5.2% |
424 |
426 |
478 |
484 |
494 |
510 |
|
|
|
|
|
|
Independent |
Anthony McDonnell |
3.3% |
275 |
279 |
285 |
|
|
|
|
|
|
|
|
|
Labour Party |
Sean O'Brien |
3% |
245 |
305 |
307 |
310 |
|
|
|
|
|
|
|
|
Fianna Fáil |
Michael McGoona |
2.7% |
220 |
222 |
|
|
|
|
|
|
|
|
|
|
Labour Party |
Jim O'Brien |
2.1% |
176 |
|
|
|
|
|
|
|
|
|
|
| Electorate: 17,840 Valid: 8,227 (46.12%) Spoilt: 146 Quota: 1,029 Turnout: 8,288 (46.46%) |
Slane
| Slane - 5 seats |
| Party | Candidate | % 1st Pref | Count 1 | Count 2 | Count 3 | Count 4 | Count 5 | Count 6 | Count 7 | Count 8 |
|
Independent |
Gerald Marry* |
20.5% |
1,412 |
|
|
|
|
|
|
|
|
Fine Gael |
Tom Kelly* |
12.6% |
865 |
887 |
891 |
1,004 |
1,203 |
|
|
|
|
Fianna Fáil |
Hugh Gough |
10.4% |
718 |
752 |
919 |
926 |
999 |
1,008 |
1,099 |
1,127 |
|
Fine Gael |
Shaun Lynch |
10% |
691 |
735 |
746 |
767 |
786 |
797 |
1,248 |
|
|
Labour Party |
Jimmy Cudden* |
9.6% |
659 |
719 |
730 |
921 |
946 |
960 |
1,014 |
1,071 |
|
Fine Gael |
Michael Meade |
9.5% |
651 |
665 |
751 |
760 |
767 |
769 |
|
|
|
Fianna Fáil |
Sean Murray |
8.7% |
596 |
638 |
681 |
686 |
931 |
951 |
977 |
993 |
|
Fianna Fáil |
Patrick Traynor* |
8% |
551 |
576 |
595 |
627 |
|
|
|
|
|
Labour Party |
Ken Lougheed |
5.6% |
382 |
397 |
402 |
|
|
|
|
|
|
Fianna Fáil |
Joe Halpin |
5.1% |
353 |
362 |
|
|
|
|
|
|
| Electorate: 13,953 Valid: 6,878 (49.29%) Spoilt: 77 Quota: 1,147 Turnout: 6,955 (49.85%) |
Trim
| Trim - 5 seats |
| Party | Candidate | % 1st Pref | Count 1 | Count 2 | Count 3 | Count 4 | Count 5 | Count 6 | Count 7 | Count 8 | Count 9 |
|
Fianna Fáil |
Noel DempseyTD* |
33.5% |
2,113 |
|
|
|
|
|
|
|
|
|
Fianna Fáil |
Colm HilliardTD* |
20.2% |
1,277 |
|
|
|
|
|
|
|
|
|
Fine Gael |
Willie Carey* |
13.6% |
858 |
913 |
930 |
933 |
935 |
977 |
1,037 |
1,066 |
|
|
Fine Gael |
Bernard Eivers |
8.8% |
555 |
636 |
658 |
661 |
668 |
712 |
719 |
729 |
791 |
|
Labour Party |
Patrick Lowe |
6.5% |
409 |
491 |
514 |
521 |
539 |
607 |
631 |
640 |
891 |
|
Labour Party |
Larry Murray |
4.5% |
282 |
371 |
384 |
388 |
400 |
442 |
457 |
467 |
|
|
Fianna Fáil |
Gabriel Cribbin* |
4.4% |
278 |
768 |
855 |
860 |
873 |
904 |
1,118 |
|
|
|
Green Party |
Patrick Cummins |
3.9% |
246 |
288 |
298 |
302 |
332 |
|
|
|
|
|
Fianna Fáil |
Sylvester Murphy |
2.7% |
173 |
360 |
403 |
406 |
413 |
433 |
|
|
|
|
Sinn Féin |
Lydia Comiskey |
1.6% |
101 |
123 |
129 |
130 |
|
|
|
|
|
|
Independent |
John Gormley |
0.4% |
23 |
35 |
38 |
|
|
|
|
|
|
| Electorate: 12,858 Valid: 6,315 (49.11%) Spoilt: 75 Quota: 1,053 Turnout: 6,390 (49.7%) |
External links
Preceded by
Meath County Council election, 1985 |
Meath County Council elections |
Succeeded by
Meath County Council election, 1991 |