Hendon (UK Parliament constituency)
| Hendon | |
|---|---|
|
Borough constituency for the House of Commons | |
|
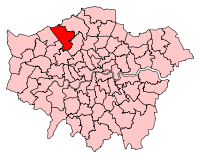
Boundary of Hendon in Greater London for the 2010 general election. | |
| County | Greater London |
| Electorate | 74,329 (December 2010)[1] |
| Current constituency | |
| Created | 1997 |
| Member of parliament | Matthew Offord (Conservative) |
| Number of members | One |
| Created from | Hendon North and parts of Hendon South |
| 1918–1945 | |
| Number of members | One |
| Replaced by | Harrow East, Harrow West, Hendon North, Hendon South and Wembley North |
| Created from | Harrow |
| Overlaps | |
| European Parliament constituency | London |
Hendon /ˈhɛndᵿn/ is a constituency[n 1] represented in the House of Commons of the UK Parliament.[n 2] since 2010 by Matthew Offord of the Conservative Party.
History
First creation
The constituency was originally created for the 1918 General Election. By 1941 the estimated electorate was the largest at 217,900.[2] and the constituency was divided into two parts (Hendon North and Hendon South) for the 1945 general election.
Second creation
In the boundary change legislation passed to implement the Fifth Periodic Review of Westminster constituencies before the 1997 General Election the London Borough of Barnet's Parliamentary representation was reduced from four seats to three and the Hendon North constituency was combined with a northern part of the Hendon South constituency. Although this new seat re-adopted the name Hendon, this version is smaller, as a south-eastern swathe of Hendon South was then placed in the new seat, Finchley and Golders Green. Within 10% of the average electorate, the new seat avoided malapportionment that would otherwise exist by way of two undersized constituencies.
Including the period of division into larger north/south replacement seats (1945–97), for one term a Labour Party MP has represented Hendon (as broadly drawn), Barbara Ayrton-Gould in Hendon North (1945–50). However, on its re-composition arranged before the 1997 election Andrew Dismore seized the seat from the Tories who were otherwise victors and held it until 2010. No Liberal or Liberal Democrat has served these seats since 1910. Neither independent candidates nor those of any other political party have won the seat or its predecessors.
Boundaries

1918–45: The Urban Districts of Hendon and Kingsbury, and the Rural District of Hendon.
1997–present: The London Borough of Barnet wards of Burnt Oak, Colindale, Edgware, Hale, Hendon, Mill Hill, and West Hendon.
1918-45
No national reviews took place between the Representation of the People Act 1918 which enfranchised this constituency and the next such Act in 1945. Later national reviews took place by the newly established Boundary Commissions for the four countries of United Kingdom for the elections of 1950, 1974, 1983, 1997 and 2010. As can be seen from the map, during the early period the seat spanned the area made up of the present seat and primarily the two neighbours to east and west, Chipping Barnet and Harrow East.
2010 review
Under the Fifth Review of Westminster Constituencies, looking at the population subset North London, and as a consequence of abolishing ward-sharing, Parliament accepted the Boundary Commission's recommendation that the shared part of Underhill be transferred to the constituency of Chipping Barnet, parts of the wards Golders Green and Finchley Church End be transferred to Finchley and Golders Green and that shared parts of Mill Hill ward be received from the named seats (to the north-east and south-east).
Members of Parliament
| Election | Member[3] | Party | |
|---|---|---|---|
| 1918 | Philip Cunliffe-Lister | Conservative | |
| 1935 | Reginald Blair | Conservative | |
| 1945 | constituency abolished: see Hendon North and Hendon South | ||
| 1997 | constituency recreated | ||
| 1997 | Andrew Dismore | Labour | |
| 2010 | Matthew Offord | Conservative | |
Election results
Elections 1997-2015
| Party | Candidate | Votes | % | ± | |
|---|---|---|---|---|---|
| Conservative | Matthew Offord | 24,328 | 49.0 | +6.7 | |
| Labour | Andrew Dismore | 20,604 | 41.5 | −0.6 | |
| UKIP | Raymond Shamash[6] | 2,595 | 5.2 | +3.2 | |
| Liberal Democrat | Alasdair Hill | 1,088 | 2.2 | −10.2 | |
| Green | Ben Samuel | 1,015 | 2.0 | +0.9 | |
| Majority | 3,724 | 7.5 | +7.3 | ||
| Turnout | 49,630 | 65.9 | +7.1 | ||
| Conservative hold | Swing | +3.6 | |||
| Party | Candidate | Votes | % | ± | |
|---|---|---|---|---|---|
| Conservative | Matthew Offord | 19,635 | 42.3 | +5.2 | |
| Labour | Andrew Dismore | 19,529 | 42.1 | −3.0 | |
| Liberal Democrat | Matthew Harris | 5,734 | 12.4 | −1.7 | |
| UKIP | Robin Lambert | 958 | 2.1 | +0.5 | |
| Green | Andrew Newby | 518 | 1.1 | −0.7 | |
| Majority | 106 | 0.2 | |||
| Turnout | 46,374 | 58.8 | +0.5 | ||
| Conservative gain from Labour | Swing | +4.1 | |||
| Party | Candidate | Votes | % | ± | |
|---|---|---|---|---|---|
| Labour | Andrew Dismore | 18,596 | 44.4 | −8.1 | |
| Conservative | Richard George Evans | 15,897 | 38.0 | +3.7 | |
| Liberal Democrat | Mrs. Nahid Boethe | 5,831 | 13.9 | +2.3 | |
| Green | David G. Williams | 754 | 1.8 | +1.8 | |
| UKIP | Melvyn Smallman | 637 | 1.5 | +0.5 | |
| Rainbow Dream Ticket | George Weiss | 68 | 0.2 | +0.2 | |
| Progressive Democratic Party | Michael Mashud Stewart | 56 | 0.1 | −0.2 | |
| Majority | 2,699 | 6.5 | |||
| Turnout | 41,839 | 58.3 | |||
| Labour hold | Swing | −6.5 | |||
| Party | Candidate | Votes | % | ± | |
|---|---|---|---|---|---|
| Labour | Andrew Dismore | 21,432 | 52.5 | +3.1 | |
| Conservative | Richard George Evans | 14,015 | 34.3 | −2.7 | |
| Liberal Democrat | Wayne John Casey | 4,724 | 11.6 | +0.7 | |
| UKIP | Craig Crosbie | 409 | 1.0 | +0.5 | |
| Workers Revolutionary | Mrs. Stella Taylor | 164 | 0.4 | +0.1 | |
| Progressive Democratic Party | Michael Mashud Stewart | 107 | 0.3 | N/A | |
| Majority | 7,417 | 18.2 | |||
| Turnout | 40,851 | 52.2 | −13.4 | ||
| Labour hold | Swing | ||||
| Party | Candidate | Votes | % | ± | |
|---|---|---|---|---|---|
| Labour | Andrew Dismore | 24,683 | 49.3 | N/A | |
| Conservative | Sir John Gorst | 18,528 | 37.0 | N/A | |
| Liberal Democrat | Wayne John Casey | 5,427 | 10.8 | N/A | |
| Referendum | Stanley Rabbow | 978 | 2.0 | N/A | |
| UKIP | B.P. Wright | 267 | 0.5 | N/A | |
| Workers Revolutionary | Mrs. Stella Taylor | 153 | 0.3 | N/A | |
| Majority | 6,155 | 12.3 | N/A | ||
| Turnout | 50,036 | 65.7 | N/A | ||
| Labour win (new seat) | |||||
Elections in the 1930s
| Party | Candidate | Votes | % | ± | |
|---|---|---|---|---|---|
| Conservative | Sir Reginald Blair | 69,762 | 65.78 | ||
| Labour | Amber Blanco White | 28,375 | 26.75 | ||
| Liberal | Basil E Goldstone | 7,920 | 7.47 | ||
| Majority | 41,387 | 39.02 | |||
| Turnout | 64.35 | ||||
| Conservative hold | Swing | ||||
| Party | Candidate | Votes | % | ± | |
|---|---|---|---|---|---|
| Conservative | Philip Cunliffe-Lister | 66,305 | 81.25 | ||
| Labour | Amber Blanco White | 15,305 | 18.75 | ||
| Majority | 51,000 | 62.49 | |||
| Turnout | 71.73 | ||||
| Conservative hold | Swing | ||||
Elections in the 1920s

| Party | Candidate | Votes | % | ± | |
|---|---|---|---|---|---|
| Unionist | Rt Hon. Philip Cunliffe-Lister | 31,758 | 52.3 | ||
| Labour | Robert Lyons | 15,434 | 25.5 | ||
| Liberal | Margery Irene Corbett Ashby | 13,449 | 22.2 | ||
| Majority | 16,324 | 26.8 | |||
| Turnout | 72.0 | ||||
| Unionist hold | Swing | ||||
| Party | Candidate | Votes | % | ± | |
|---|---|---|---|---|---|
| Unionist | Rt Hon. Philip Lloyd-Graeme | 13,278 | 51.9 | -10.9 | |
| Liberal | Rt Hon. John Mackinnon Robertson | 7,324 | 28.6 | +8.2 | |
| Labour | Charles Latham | 5,005 | 19.5 | +2.7 | |
| Majority | 5,954 | 23.3 | -3.5 | ||
| Turnout | 67.3 | ||||
| Unionist hold | Swing | -9.6 | |||
See also
- List of Parliamentary constituencies in Greater London
- Opinion polling for the next United Kingdom general election in individual constituencies
Notes
- ↑ A borough constituency (for the purposes of election expenses and type of returning officer)
- ↑ As with all constituencies, the constituency elects one Member of Parliament (MP) by the first past the post system of election at least every five years.
References
- ↑ "Electorate Figures - Boundary Commission for England". 2011 Electorate Figures. Boundary Commission for England. 4 March 2011. Retrieved 13 March 2011.
- ↑ The Guinness Book Of Records 1980
- ↑ Leigh Rayment's Historical List of MPs – Constituencies beginning with "H" (part 2)
- ↑ "Election Data 2015". Electoral Calculus. Archived from the original on 17 October 2015. Retrieved 17 October 2015.
- ↑ https://www.barnet.gov.uk/citizen-home/news/Election-results-in-Barnet.html 9Jul15
- ↑ http://www.hendon-today.co.uk/news.cfm?id=20536&headline=Controversial%20UKIP%20candidate%20to%20challenge%20Hendon%20seat
- ↑ "Election Data 2010". Electoral Calculus. Archived from the original on 17 October 2015. Retrieved 17 October 2015.
- ↑ http://www.barnet.gov.uk/hendon-constituency-candidates2010.pdf
- ↑ "Election Data 2005". Electoral Calculus. Archived from the original on 15 October 2011. Retrieved 18 October 2015.
- ↑ "Election Data 2001". Electoral Calculus. Archived from the original on 15 October 2011. Retrieved 18 October 2015.
- ↑ "Election Data 1997". Electoral Calculus. Archived from the original on 15 October 2011. Retrieved 18 October 2015.
- ↑ British Parliamentary Election Results 1918-1949, FWS Craig
- ↑ British Parliamentary Election Results 1918-1949, FWS Craig
- Iain Dale, ed. (2003). The Times House of Commons 1929, 1931, 1935. Politico's (reprint). ISBN 1-84275-033-X.
- The Times House of Commons 1945. 1945.