Walthamstow (UK Parliament constituency)
| Walthamstow | |
|---|---|
|
Borough constituency for the House of Commons | |
|
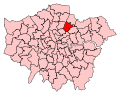
Boundary of Walthamstow in . | |
| County | Greater London |
| Electorate | 64,482 (December 2010)[1] |
| Current constituency | |
| Created | 1974 |
| Member of parliament | Stella Creasy (Labour Co-op) |
| Number of members | One |
| Created from |
Walthamstow East Walthamstow West |
| 1885–1918 | |
| Number of members | One |
| Type of constituency | County constituency |
| Replaced by | Walthamstow East and Walthamstow West, Leyton East, Leyton West, and Epping |
| Created from | South Essex |
| Overlaps | |
| European Parliament constituency | London |
Walthamstow (Contemp. and Cons. RP) /wɔːlθm̩stəʊ/, (Est. Eng.) /woːwfm̩stɐʏ/ is a constituency[n 1] represented in the House of Commons of the UK Parliament since 2010 by Stella Creasy, a member of the Labour Party and of the Cooperative Party.[n 2]
Boundaries

1885–1918
The South-Western or Walthamstow Division of the parliamentary county of Essex was created by the Redistribution of Seats Act 1885, when the existing seat of South Essex was divided into three single-member constituencies.
The constituency consisted of the three civil parishes of Leyton, Wanstead and Walthamstow. The area lay on the periphery of the London conurbation and became increasingly suburban over its existence.
The seat was abolished under the Representation of the People Act 1918. Two new constituencies were created with Walthamstow Urban District divided between Walthamstow East and Walthamstow West.[2]
1974 – date
1974-1983: The London Borough of Waltham Forest wards of Higham Hill, High Street, Hoe Street, St James Street, and Wood Street.
1983-1997: The London Borough of Waltham Forest wards of Higham Hill, High Street, Hoe Street, Lloyd Park, St James Street, and Wood Street.
1997-2010: The London Borough of Waltham Forest wards of Chapel End, Higham Hill, High Street, Hoe Street, Lea Bridge, Lloyd Park, St James Street, and Wood Street.
2010–present: The London Borough of Waltham Forest wards of Chapel End, Higham Hill, High Street, Hoe Street, Lea Bridge, Markhouse, William Morris, and Wood Street.
History
The seat has been represented by the Labour Party since 1992, before which it was won on a marginal majority in 1987 by a Conservative, having until then (since its 1974 recreation as a seat) been served by one Labour MP, Eric Deakins.
The 2010 result was unusual in defying the national swing, producing a greater than 1% one-party swing to the new Labour candidate, Stella Creasy. She took the candidature from Neil Gerrard who was placed on the left of the Labour party. The Liberal Democrat, Farid Ahmed, has been the runner-up since 2005.
Prominent frontbenchers
Stella Creasy, the present member, was the Shadow Minister for Crime Prevention.
Constituency profile
The seat is that part of Outer London closest to Stratford, with its international rail connections, major city shopping centre and London's Olympic Park. To the East the seat borders Walthamstow Forest and Gilbert's Slade, thin sections of Epping Forest, and to the West, the Lea Valley. The eponymous district had as its open space feature a greyhound racing track, which is set for redevelopment into a modernist housing and green space scheme. Workless claimants, registered jobseekers, were in November 2012 significantly higher than the national average of 3.8% and Greater London average of 4%, at 7.2% of the population based on a statistical compilation by The Guardian.[3]
Member of Parliament
MPs 1885–1918
| Year | Member[4] | Party | |
|---|---|---|---|
| 1885 | Edward Buxton | Liberal | |
| 1886 | William Makins | Conservative | |
| 1892 | Edmund Widdrington Byrne | Conservative | |
| 1897 | Sam Woods | Liberal | |
| 1900 | David John Morgan | Conservative | |
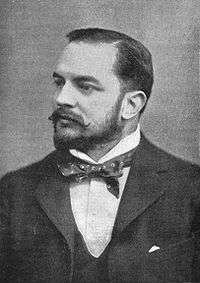
| 1906 | John Simon | Liberal | |
| 1918 | Constituency abolished | ||
MPs 1974–present
| Election | Member[4] | Party | |
|---|---|---|---|
| Feb 1974 | constituency recreated | ||
| Feb 1974 | Eric Deakins | Labour | |
| 1987 | Hugo Summerson | Conservative | |
| 1992 | Neil Gerrard | Labour | |
| 2010 | Stella Creasy | Labour | |
Election results
Elections in the 2010s
| Party | Candidate | Votes | % | ± | |
|---|---|---|---|---|---|
| Labour Co-op | Stella Creasy | 28,779 | 68.9 | +17.0 | |
| Conservative | Molly Samuel-Leport | 5,584 | 13.4 | −0.6 | |
| Green | Michael Gold[7] | 2,661 | 6.4 | +4.5 | |
| UKIP | Paul Hillman | 2,507 | 6.0 | +4.0 | |
| Liberal Democrat | Steven Dominique Cheung | 1,661 | 4.0 | −24.7 | |
| TUSC | Nancy Taaffe [8] | 394 | 0.9 | +0.3 | |
| Independent | Ellie Merton [9] | 129 | 0.3 | n/a | |
| Workers Revolutionary | Jonty Leff [10] | 81 | 0.2 | n/a | |
| Majority | 23,195 | 55.5 | +32.4 | ||
| Turnout | 41,796 | 62.4 | -1.0 | ||
| Labour Co-op hold | Swing | +8.8 | |||
| Party | Candidate | Votes | % | ± | |
|---|---|---|---|---|---|
| Labour Co-op | Stella Creasy | 21,252 | 51.8 | +1.5 | |
| Liberal Democrat | Farid Ahmed | 11,774 | 28.7 | +1.6 | |
| Conservative | Andy Hemsted | 5,734 | 14.0 | −4.2 | |
| UKIP | Judith Chisholm-Benli | 823 | 2.0 | -0.3 | |
| Green | Daniel Perrett | 767 | 1.9 | N/A | |
| TUSC | Nancy Taaffe | 279 | 0.7 | N/A | |
| Christian | Ashar Mall | 248 | 0.6 | N/A | |
| Independent | Paul Warburton | 117 | 0.3 | N/A | |
| Majority | 9,478 | 23.1 | -0.1 | ||
| Turnout | 40,994 | 63.4 | +8.8 | ||
| Labour Co-op hold | Swing | -0.04 | |||
Elections in the 2000s
| Party | Candidate | Votes | % | ± | |
|---|---|---|---|---|---|
| Labour | Neil Gerrard | 17,323 | 50.3 | -11.9 | |
| Liberal Democrat | Farid Ahmed | 9,330 | 27.1 | +12.5 | |
| Conservative | Jane Wright | 6,254 | 18.2 | +0.1 | |
| UKIP | Robert Brock | 810 | 2.4 | +1.5 | |
| Socialist Alternative | Nancy Taaffe | 727 | 2.1 | -0.2 | |
| Majority | 7,993 | 23.2 | -20.9 | ||
| Turnout | 34,444 | 54.6 | +1.1 | ||
| Labour hold | Swing | -12.2 | |||
| Party | Candidate | Votes | % | ± | |
|---|---|---|---|---|---|
| Labour | Neil Gerrard | 21,402 | 62.2 | -1.0 | |
| Conservative | Nicholas Boys Smith | 6,221 | 18.1 | -2.2 | |
| Liberal Democrat | Peter Dunphy | 5,024 | 14.6 | +0.9 | |
| Socialist Alternative | Simon Donovan | 806 | 2.3 | N/A | |
| BNP | William Phillips | 389 | 1.1 | N/A | |
| UKIP | Gerda Mayer | 298 | 0.9 | N/A | |
| ProLife Alliance | Barbara Duffy | 289 | 0.8 | N/A | |
| Majority | 15,181 | 44.1 | +1.3 | ||
| Turnout | 34,429 | 53.5 | -9.3 | ||
| Labour hold | Swing | -0.6 | |||
Elections in the 1990s
| Party | Candidate | Votes | % | ± | |
|---|---|---|---|---|---|
| Labour | Neil Gerrard | 25,287 | 63.1 | +17.4 | |
| Conservative | Jill Andrew | 8,138 | 20.3 | -16.9 | |
| Liberal Democrat | Jane Jackson | 5,491 | 13.7 | -0.8 | |
| Referendum | Rev George Hargreaves | 1,139 | 2.8 | N/A | |
| Majority | 17,149 | 42.8 | +34.3 | ||
| Turnout | 40,055 | 62.8 | -9.6 | ||
| Labour hold | Swing | +17.15 | |||
| Party | Candidate | Votes | % | ± | |
|---|---|---|---|---|---|
| Labour | Neil Gerrard | 16,251 | 45.7 | +10.97 | |
| Conservative | Hugo Summerson | 13,229 | 37.2 | -1.82 | |
| Liberal Democrat | Peter Leighton | 5,142 | 14.5 | N/A | |
| Liberal | Vernon Wilkinson | 241 | 0.7 | N/A | |
| Majority | 3,022 | 8.5 | N/A | ||
| Turnout | 34,863 | 72.4 | +0.00 | ||
| Labour gain from Conservative | Swing | +6.4 | |||
Elections in the 1980s
| Party | Candidate | Votes | % | ± | |
|---|---|---|---|---|---|
| Conservative | Hugo Summerson | 13,748 | 39.02 | +3.12 | |
| Labour | Eric Deakins | 12,236 | 34.73 | -5.07 | |
| Social Democratic | Peter Leonard Leighton | 8,852 | 25.1 | +3.5 | |
| Independent | Dr Zafar I Malik | 396 | 1.12 | N/A | |
| Majority | 1,512 | 4.29 | N/A | ||
| Turnout | 35,232 | 72.4 | +3.6 | ||
| Conservative gain from Labour | Swing | +4.1 | |||
| Party | Candidate | Votes | % | ± | |
|---|---|---|---|---|---|
| Labour | Eric Deakins | 13,241 | 39.8 | -10.4 | |
| Conservative | Alan Amos | 11,936 | 35.9 | -1.8 | |
| Social Democratic | Peter Leonard Leighton | 7,192 | 21.6 | N/A | |
| National Front | P Mitchell | 444 | 1.3 | -1.9 | |
| Ecology | Stephen William Lambert | 424 | 1.3 | N/A | |
| Majority | 1,305 | 3.9 | -8.6 | ||
| Turnout | 33,237 | 68.8 | -2.5 | ||
| Labour hold | Swing | -4.3 | |||
Elections in the 1970s
| Party | Candidate | Votes | % | ± | |
|---|---|---|---|---|---|
| Labour | Eric Deakins | 17,651 | 50.2 | -4.9 | |
| Conservative | S Eyres | 13,248 | 37.7 | +13.4 | |
| Liberal | Mervyn Peter O'Flanagan | 3,117 | 8.9 | -6.1 | |
| National Front | G Flaxton | 1,119 | 3.2 | -2.3 | |
| Majority | 4,403 | 12.5 | -18.3 | ||
| Turnout | 35,135 | 71.3 | +5.1 | ||
| Labour hold | Swing | -9.15 | |||
| Party | Candidate | Votes | % | ± | |
|---|---|---|---|---|---|
| Labour | Eric Deakins | 19,088 | 55.1 | +4.4 | |
| Conservative | D Arnold | 8,424 | 24.3 | -4.0 | |
| Liberal | Mervyn Peter O'Flanagan | 5,199 | 15.0 | -6.0 | |
| National Front | R Adde | 1,911 | 5.5 | N/A | |
| Majority | 10,664 | 30.8 | +8.3 | ||
| Turnout | 34,622 | 66.2 | -8.7 | ||
| Labour hold | Swing | +4.2 | |||
| Party | Candidate | Votes | % | ± | |
|---|---|---|---|---|---|
| Labour | Eric Deakins | 19,726 | 50.7 | N/A | |
| Conservative | PS Gill | 10,992 | 28.3 | N/A | |
| Liberal | Mervyn Peter O'Flanagan | 8,157 | 21.0 | N/A | |
| Majority | 8,374 | 22.5 | N/A | ||
| Turnout | 38,875 | 74.9 | N/A | ||
| Labour win (new seat) | |||||
Elections 1885–1918
General Election 1914/15:
Another General Election was required to take place before the end of 1915. The political parties had been making preparations for an election to take place and by the July 1914, the following candidates had been selected;
- Liberal: Emslie John Horniman
- Unionist: Louis Stanley Johnson
| Party | Candidate | Votes | % | ± | |
|---|---|---|---|---|---|
| Liberal | Sir John Allsebrook Simon | 16,998 | 56.1 | +1.6 | |
| Conservative | Carlyon Wilfroy Bellairs | 13,275 | 43.9 | -1.6 | |
| Majority | 3,723 | 12.2 | +3.2 | ||
| Turnout | 30,273 | 77.4 | -0.8 | ||
| Liberal hold | Swing | +1.6 | |||
| Party | Candidate | Votes | % | ± | |
|---|---|---|---|---|---|
| Liberal | John Allsebrook Simon | 16,673 | 54.5 | +1.2 | |
| Conservative | Louis Stanley Johnson | 13,907 | 45.5 | -1.2 | |
| Majority | 2,766 | 9.0 | +2.4 | ||
| Turnout | 30,580 | 78.2 | -6.8 | ||
| Liberal hold | Swing | +1.2 | |||
| Party | Candidate | Votes | % | ± | |
|---|---|---|---|---|---|
| Liberal | John Allsebrook Simon | 17,726 | 53.3 | -4.2 | |
| Conservative | Louis Stanley Johnson | 15,531 | 46.7 | +4.2 | |
| Majority | 2,195 | 6.6 | -8.4 | ||
| Turnout | 33,257 | 85.0 | +11.1 | ||
| Liberal hold | Swing | -4.2 | |||
Elections in the 1900s
| Party | Candidate | Votes | % | ± | |
|---|---|---|---|---|---|
| Liberal | John Allsebrook Simon | 15,011 | 57.5 | +14.7 | |
| Conservative | William Isaac Shard | 11,074 | 42.5 | -14.7 | |
| Majority | 3,937 | 15.0 | 29.4 | ||
| Turnout | 26,085 | 73.9 | +3.0 | ||
| Liberal gain from Conservative | Swing | +14.7 | |||
| Party | Candidate | Votes | % | ± | |
|---|---|---|---|---|---|
| Conservative | David John Morgan | 9,807 | 57.2 | +8.3 | |
| Lib-Lab | Sam Woods | 7,342 | 42.8 | -8.3 | |
| Majority | 2,465 | 14.4 | 16.6 | ||
| Turnout | 17,149 | 70.9 | +6.6 | ||
| Conservative gain from Lib-Lab | Swing | +8.3 | |||
Elections in the 1890s
| Party | Candidate | Votes | % | ± | |
|---|---|---|---|---|---|
| Lib-Lab | Sam Woods | 6,518 | 51.1 | +11.4 | |
| Conservative | Thomas Robert Dewar | 6,239 | 48.9 | -11.4 | |
| Majority | 279 | 2.2 | 22.8 | ||
| Turnout | 12,757 | 64.3 | +2.1 | ||
| Lib-Lab gain from Conservative | Swing | +11.4 | |||
| Party | Candidate | Votes | % | ± | |
|---|---|---|---|---|---|
| Conservative | Edmund Widdrington Byrne | 6,876 | 60.3 | +5.1 | |
| Liberal | Arthur Joseph Hungerford Pollen | 4,423 | 39.7 | -5.1 | |
| Majority | 2,353 | 20.6 | +10.2 | ||
| Turnout | 11,399 | 64.2 | -8.1 | ||
| Conservative hold | Swing | +5.1 | |||
| Party | Candidate | Votes | % | ± | |
|---|---|---|---|---|---|
| Conservative | Edmund Widdrington Byrne | 6,155 | 55.2 | -7.6 | |
| Liberal | Walter Basden Whittingham | 4,965 | 44.8 | +7.6 | |
| Majority | 1,150 | 10.4 | -15.2 | ||
| Turnout | 11,080 | 72.3 | +9.1 | ||
| Conservative hold | Swing | -7.6 | |||
Elections in the 1880s
| Party | Candidate | Votes | % | ± | |
|---|---|---|---|---|---|
| Conservative | William Thomas Makins | 4,461 | 62.8 | +13.8 | |
| Liberal | Albert Spicer | 2,639 | 37.2 | -13.8 | |
| Majority | 1,822 | 25.6 | 27.6 | ||
| Turnout | 7,000 | 63.2 | -11.8 | ||
| Conservative hold | Swing | +13.8 | |||
| Party | Candidate | Votes | % | ± | |
|---|---|---|---|---|---|
| Liberal | Edward North Buxton | 4,300 | 51.0 | n/a | |
| Conservative | Thomas Charles Baring | 4,125 | 49.0 | n/a | |
| Majority | 175 | 2.0 | n/a | ||
| Turnout | 8,425 | 75.0 | n/a | ||
| Liberal win (new seat) | |||||
See also
Notes and references
Notes
- ↑ A borough constituency (for the purposes of election expenses and type of returning officer)
- ↑ As with all constituencies, the constituency elects one Member of Parliament (MP) by the first past the post system of election at least every five years.
References
- Youngs, Frederic A, Jr. (1979). Guide to the Local Administrative Units of England, Vol.I: Southern England. London: Royal Historical Society. ISBN 0-901050-67-9.
- ↑ "Electorate Figures – Boundary Commission for England". 2011 Electorate Figures. Boundary Commission for England. 4 March 2011. Retrieved 13 March 2011.
- ↑ Leyton was divided into two seats: Leyton East and Leyton West, while Wanstead was included in the Epping constituency. (Youngs, p.727)
- ↑ Unemployment claimants by constituency The Guardian
- 1 2 Leigh Rayment's Historical List of MPs – Constituencies beginning with "W" (part 1)
- ↑ "Election Data 2015". Electoral Calculus. Archived from the original on 17 October 2015. Retrieved 17 October 2015.
- ↑ https://www.walthamforest.gov.uk/Pages/ServiceChild/election-results-7May15.aspx
- ↑ london.greenparty.org.uk/elections/2015-general-election.html
- ↑ http://www.tusc.org.uk/txt/320.pdf
- ↑ https://yournextmp.com/constituency/65651/walthamstow
- ↑ http://wrp.org.uk/images/photos/15-04-07-10813.jpg
- ↑ "Walthamstow". Election 2010. BBC. Retrieved 7 May 2010.
- ↑ "UK General Election results May 2010". Richard Kimber's Political Science Resources. Retrieved 2 September 2012.
- ↑ "UK General Election results May 2005". Richard Kimber's Political Science Resources. Retrieved 2 September 2012.
- 1 2 "UK General Election results 1997 & 2001: Walthamstow". Richard Kimber's Political Science Resources. Retrieved 2 September 2012.
- ↑ "UK General Election results April 1992". Richard Kimber's Political Science Resources. Retrieved 2 September 2012.
- ↑ "UK General Election results June 1987". Richard Kimber's Political Science Resources. Retrieved 2 September 2012.
- ↑ "UK General Election results June 1983". Richard Kimber's Political Science Resources. Retrieved 2 September 2012.
- ↑ "UK General Election results May 1979". Richard Kimber's Political Science Resources. Retrieved 2 September 2012.
- ↑ "UK General Election results October 1974". Richard Kimber's Political Science Resources. Retrieved 2 September 2012.
- ↑ "UK General Election results February 1974". Richard Kimber's Political Science Resources. Retrieved 2 September 2012.
- 1 2 3 4 5 6 7 8 9 10 British Parliamentary Election Results 1885-1918, FWS Craig
- 1 2 3 The Liberal Year Book, 1907
- 1 2 3 Debrett's House of Commons & Judicial Bench, 1901
| Parliament of the United Kingdom | ||
|---|---|---|
| Preceded by Essex South |
UK Parliament constituency 1885 – 1918 |
Succeeded by Walthamstow East |
| UK Parliament constituency 1885 – 1918 |
Succeeded by Walthamstow West | |
| Preceded by Walthamstow East |
UK Parliament constituency 1974 – present |
Incumbent |
| Preceded by Walthamstow West |
UK Parliament constituency 1974 – present | |