Essex County Council election, 2009
| | |||||||||||||||||||||||||||||||
| |||||||||||||||||||||||||||||||
| |||||||||||||||||||||||||||||||
|
| |||||||||||||||||||||||||||||||
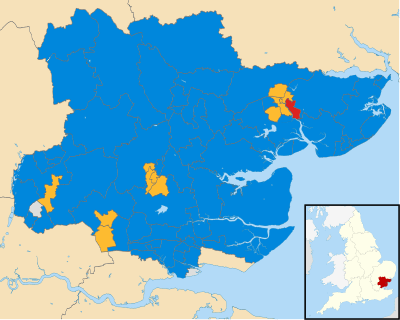
| Results by electoral division.Conservatives in blue, Liberal Democrats in yellow, Labour in red and in grey the Canvey Island Independent Party and Independent Loughton Residents Association. | |||||||||||||||||||||||||||||||
| |||||||||||||||||||||||||||||||
An election to Essex County Council took place on 4 June 2009 as part of the United Kingdom local elections, 2009. The elections had been delayed from 7 May, to coincide with elections to the European Parliament. 75 councillors were elected from various electoral divisions, which returned either one or two county councillors each by first-past-the-post voting for a four-year term of office. The electoral divisions were the same as those used at the previous election in 2009.
All locally registered electors (British, Irish, Commonwealth and European Union citizens) who were aged 18 or over on Thursday 2 May 2013 were entitled to vote in the local elections. Those who were temporarily away from their ordinary address (for example, away working, on holiday, in student accommodation or in hospital) were also entitled to vote in the local elections,[1] although those who had moved abroad and registered as overseas electors cannot vote in the local elections. It is possible to register to vote at more than one address (such as a university student who had a term-time address and lives at home during holidays) at the discretion of the local Electoral Register Office, but it remains an offence to vote more than once in the same local government election.[2]
Summary
The Conservatives were re-elected with an increased majority. As in several other Tory councils, the Liberal Democrats replaced Labour as the main opposition party as Labour lost all but one seat, reflecting the Labour Party's declining national popularity at that time.
A notable feature of this election was the number of minor parties and local groups. These included right wing and anti-European parties, that appear to have siphoned support from the main parties and, in some divisions, out-polled them. Local groups enjoyed strong local support, challenging the successful candidates and winning seats.
Results summary
In summaries, Labour and Labour Co-operative results are amalgamated. In multi-member divisions, the "majority" is the number of votes by which the loser with the highest number of votes fell short of being elected.
| Essex County Council election, 2009[3] | ||||||||||
|---|---|---|---|---|---|---|---|---|---|---|
| Party | Seats | Gains | Losses | Net gain/loss | Seats % | Votes % | Votes | +/− | ||
| Conservative | 60 | 14 | 4 | |
80.0 | 43.3 | 169,975 | -1.2 | ||
| Liberal Democrat | 12 | 4 | 0 | |
16.0 | 20.1 | 79,085 | -2.8 | ||
| Labour | 1 | 0 | 12 | |
1.3 | 10.8 | 42,334 | -13.8 | ||
| Loughton Residents | 1 | 0 | 0 | |
1.3 | 0.7 | 2,764 | +0.3 | ||
| Canvey Island Independent | 1 | 1 | 0 | |
1.3 | 0.4 | 1,655 | N/A | ||
| BNP | 0 | 0 | 0 | |
0 | 8.9 | 35,037 | +8.7 | ||
| Green | 0 | 0 | 0 | |
0 | 6.8 | 26,547 | +1.2 | ||
| UKIP | 0 | 0 | 0 | |
0 | 4.6 | 18,186 | +4.0 | ||
| Tendring First | 0 | 0 | 0 | |
0 | 1.5 | 5,866 | N/A | ||
| English Democrat | 0 | 0 | 0 | |
0 | 1.3 | 5,212 | +1.2 | ||
| Independent | 0 | 0 | 0 | |
0 | 1.1 | 4,322 | +0.8 | ||
| Community Representative | 0 | 0 | 1 | |
0 | 0.4 | 1,523 | -0.5 | ||
Election results by electoral division
| Party | Candidate | Votes | % | ± | |
|---|---|---|---|---|---|
| Liberal Democrat | Margaret Fisher | 2384 | 50.4 | +7.5 | |
| Green | Linda Wonnacott | 845 | 17.9 | +6.9 | |
| Conservative | Darius Laws | 828 | 17.5 | -5.4 | |
| Labour | Rossanna Trudgian | 365 | 7.7 | -15.7 | |
| BNP | John Alfred Key | 305 | 6.4 | N/A | |
| Majority | 1539 | 32.6 | |||
| Turnout | 4727 | ||||
| Liberal Democrat hold | Swing | ||||
| Party | Candidate | Votes | % | ± | |
|---|---|---|---|---|---|
| Conservative | John Michael Schofield | 1936 | 34.6 | ||
| Liberal Democrat | Geoffrey Williams | 1679 | 30.0 | ||
| UKIP | Imelda Clancy | 711 | 12.7 | ||
| Labour | Mark Witzer | 679 | 12.1 | ||
| BNP | Geoffrey John McCarthy | 596 | 10.6 | ||
| Majority | 257 | 5.4 | |||
| Turnout | 5601 | ||||
| Conservative hold | Swing | ||||
| Party | Candidate | Votes | % | ± | |
|---|---|---|---|---|---|
| Conservative | Anthony Michael Headley | 6224 | 31.2 | ||
| Conservative | Kay Twitchen | 5021 | 25.2 | ||
| UKIP | Susan Patricia McCaffery | 1721 | 8.6 | ||
| Liberal Democrat | Martin Keith Howard | 1638 | 8.2 | ||
| Liberal Democrat | Stephen William Nice | 1519 | 7.6 | ||
| Labour | Margaret Mary Viney | 913 | 4.6 | ||
| English Democrat | Kim Elizabeth Gandy | 795 | 4.0 | ||
| BNP | Michael Richard Bateman | 735 | 3.7 | ||
| Labour | Anthony Richard Emrys Borlase | 717 | 3.6 | ||
| BNP | Irene Lillian Bateman | 656 | 3.3 | ||
| Majority | |||||
| Turnout | 19939 | ||||
| Conservative hold | Swing | ||||
| Conservative hold | Swing | ||||
| Party | Candidate | Votes | % | ± | |
|---|---|---|---|---|---|
| Conservative | John Baugh | 1814 | 37.3 | ||
| Labour | Lynn Rosemary Watson | 997 | 20.5 | ||
| UKIP | Gordon Kingsley Helm | 859 | 17.7 | ||
| Liberal Democrat | Terry Brooks | 572 | 11.8 | ||
| BNP | Carole Gladwin | 318 | 6.5 | ||
| Green | Nicholas David Scales | 299 | 6.2 | ||
| Majority | 817 | 17.3 | |||
| Turnout | 4859 | ||||
| Conservative gain from Labour | Swing | ||||
| Party | Candidate | Votes | % | ± | |
|---|---|---|---|---|---|
| Conservative | Nigel Edey | 2316 | 45.6 | ||
| Labour | Eric Robert Lynch | 747 | 14.7 | ||
| Liberal Democrat | Paul William Lemon | 607 | 11.9 | ||
| Green | Andrea Hilton Bunn | 554 | 10.9 | ||
| English Democrat | Perry James Blye | 493 | 9.7 | ||
| BNP | Matthew Dominic Adam Taylor | 368 | 7.2 | ||
| Majority | 1569 | 33.2 | |||
| Turnout | 5085 | ||||
| Conservative hold | Swing | ||||
| Party | Candidate | Votes | % | ± | |
|---|---|---|---|---|---|
| Conservative | Graham Butland | 1575 | 35.3 | ||
| Labour | Elwyn Bishop | 876 | 19.6 | ||
| UKIP | Philip James Shute | 652 | 14.6 | ||
| Liberal Democrat | Doug Rice | 600 | 13.4 | ||
| Green | Wendy Anne Partridge | 279 | 6.2 | ||
| BNP | Paul Stephen Hooks | 254 | 5.7 | ||
| English Democrat | Albert Frederick Day | 231 | 5.2 | ||
| Majority | 699 | 14.9 | |||
| Turnout | 4467 | ||||
| Conservative gain from Labour | Swing | ||||
| Party | Candidate | Votes | % | ± | |
|---|---|---|---|---|---|
| Conservative | John Roberts | 4052 | 65.4 | ||
| Liberal Democrat | Ross Adam Carter | 1119 | 18.1 | ||
| BNP | Clifford James Houghton | 602 | 9.7 | ||
| Labour | Kees Maxey | 420 | 6.8 | ||
| Majority | 2933 | 62.0 | |||
| Turnout | 6193 | ||||
| Conservative hold | Swing | ||||
| Party | Candidate | Votes | % | ± | |
|---|---|---|---|---|---|
| Liberal Democrat | Barry Roy Aspinell | 2698 | 45.5 | ||
| Conservative | Phil Baker | 2397 | 40.4 | ||
| Labour | Michele Anne Wigram | 562 | 9.5 | ||
| BNP | Carolyn Rossiter | 276 | 4.6 | ||
| Majority | 301 | 6.4 | |||
| Turnout | 5933 | ||||
| Liberal Democrat gain from Conservative | Swing | ||||
| Party | Candidate | Votes | % | ± | |
|---|---|---|---|---|---|
| Conservative | Ann Frances Naylor | 2953 | 48.7 | ||
| UKIP | Yvonne Jeanette Maguire | 1300 | 21.4 | ||
| Liberal Democrat | Karen Louise Chilvers | 991 | 16.3 | ||
| Labour | Dennis David Norman | 314 | 5.2 | ||
| BNP | Sidney Albert Chaney | 312 | 5.1 | ||
| English Democrat | Maureen Dallis Davies | 198 | 3.3 | ||
| Majority | 1653 | 27.2 | |||
| Turnout | 6068 | ||||
| Conservative hold | Swing | ||||
| Party | Candidate | Votes | % | ± | |
|---|---|---|---|---|---|
| Liberal Democrat | David John Kendall | 2273 | 41.5 | ||
| Conservative | Lionel Martin Lee | 2266 | 41.3 | ||
| BNP | Kevin Swaby | 501 | 9.1 | ||
| Labour | Gareth Paul Barrett | 443 | 8.1 | ||
| Majority | 7 | 0.1 | |||
| Turnout | 5483 | ||||
| Liberal Democrat gain from Conservative | Swing | ||||
| Party | Candidate | Votes | % | ± | |
|---|---|---|---|---|---|
| Conservative | Derek Charles Frederick Robinson | 2387 | 43.0 | ||
| Liberal Democrat | Gary Gordon Ian Scott | 1577 | 28.4 | ||
| Labour Co-op | Tracey Osben | 588 | 10.6 | ||
| BNP | Jim Taylor | 537 | 9.7 | ||
| Green | Stephen Ronald Whiteman | 468 | 8.4 | ||
| Majority | 810 | 14.6 | |||
| Turnout | 5557 | ||||
| Conservative hold | Swing | ||||
| Party | Candidate | Votes | % | ± | |
|---|---|---|---|---|---|
| Conservative | John Francis Aldridge | 3234 | 56.7 | ||
| Liberal Democrat | Don Bacon | 1176 | 20.6 | ||
| Green | Reza Hossain | 489 | 8.6 | ||
| BNP | Daniel Russell Trevor Warden | 434 | 7.6 | ||
| Labour Co-op | John Knott | 369 | 6.5 | ||
| Majority | 2058 | 36.1 | |||
| Turnout | 5702 | ||||
| Conservative hold | Swing | ||||
| Party | Candidate | Votes | % | ± | |
|---|---|---|---|---|---|
| Conservative | Valerie Metcalfe | 2601 | 40.1 | ||
| Liberal Democrat | Ann Mary Haigh | 1952 | 30.1 | ||
| UKIP | Gerard Mark Wadsworth | 637 | 9.8 | ||
| Green | Steven John Sayfritz Neville | 392 | 6.0 | ||
| BNP | Alexander Patrick Copland | 370 | 5.7 | ||
| Labour | Tom Owen | 359 | 5.5 | ||
| Canvey Island Independent | Neville Wright | 177 | 2.7 | ||
| Majority | 649 | 10.0 | |||
| Turnout | 6488 | ||||
| Liberal Democrat hold | Swing | ||||
| Party | Candidate | Votes | % | ± | |
|---|---|---|---|---|---|
| Canvey Island Independent | Brian Sidney Wood | 1782 | 34.8 | ||
| Conservative | Mark John Howard | 1612 | 31.5 | ||
| BNP | Laurence Morgan | 852 | 16.7 | ||
| Labour | John Payne | 553 | |||
| Liberal Democrat | Nicole Anne Nunn | 316 | |||
| Majority | 170 | 3.3 | |||
| Turnout | 5115 | ||||
| Canvey Island Independent gain from Conservative | Swing | ||||
| Party | Candidate | Votes | % | ± | |
|---|---|---|---|---|---|
| Conservative | Ray Howard | 1948 | 43.1 | ||
| Canvey Island Independent | Peter May | 1655 | 36.6 | ||
| BNP | John Morgan | 505 | 11.2 | ||
| Labour | Jackie Reilly | 314 | 7.0 | ||
| Liberal Democrat | Ashley James Final | 97 | 2.2 | ||
| Majority | 293 | 6.5 | |||
| Turnout | 4519 | ||||
| Conservative hold | Swing | ||||
| Party | Candidate | Votes | % | ± | |
|---|---|---|---|---|---|
| Conservative | Peter James Martin | 3431 | 57.9 | +4.4 | |
| Liberal Democrat | David Whiteing | 1162 | 19.6 | -3.1 | |
| Green | Eleanor Jessy Burgess | 589 | 9.9 | +3.4 | |
| Labour | David Howell | 378 | 6.4 | -10.9 | |
| BNP | Viktor Underwood | 366 | 6.2 | N/A | |
| Majority | 2269 | 38.3 | |||
| Turnout | 5926 | ||||
| Conservative hold | Swing | ||||
| Party | Candidate | Votes | % | ± | |
|---|---|---|---|---|---|
| Liberal Democrat | Margaret Hutchon | 2076 | 44.5 | +6.6 | |
| Conservative | Robert Alexander Pontin | 1570 | 33.6 | -1.7 | |
| Green | Peter James Lynn | 381 | 8.2 | +2.3 | |
| Labour | Jonathan David Legg | 358 | 7.7 | -13.2 | |
| BNP | Jay Lee Slaven | 284 | 6.1 | N/A | |
| Majority | 506 | 10.8 | |||
| Turnout | 4669 | ||||
| Liberal Democrat hold | Swing | ||||
| Party | Candidate | Votes | % | ± | |
|---|---|---|---|---|---|
| Liberal Democrat | Tom Smith-Hughes | 2418 | 46.7 | +7.6 | |
| Conservative | Dick Madden | 1659 | 32.0 | -3.3 | |
| Labour Co-op | Jim Webb | 405 | 7.8 | -16.5 | |
| Green | Angela Joan Thomson | 376 | 7.3 | +1.4 | |
| BNP | Paul Maylin | 323 | 6.2 | N/A | |
| Majority | 759 | 14.6 | |||
| Turnout | 5181 | ||||
| Liberal Democrat hold | Swing | ||||
| Party | Candidate | Votes | % | ± | |
|---|---|---|---|---|---|
| Liberal Democrat | Jude Deakin | 2040 | 41.2 | +5.2 | |
| Conservative | James Stuart Morgan | 1613 | 32.6 | +3.0 | |
| Labour Co-op | Joan Valerie Bliss | 546 | 11.0 | -16.1 | |
| BNP | Christine Margaret Mitchell | 376 | 7.6 | N/A | |
| Green | Nelson Joseph Brunton | 372 | 7.5 | +2.2 | |
| Majority | 427 | 8.6 | |||
| Turnout | 4947 | ||||
| Liberal Democrat hold | Swing | ||||
| Party | Candidate | Votes | % | ± | |
|---|---|---|---|---|---|
| Conservative | John Knapman | 2363 | 53.2 | ||
| Labour | Ruth Montefiore | 618 | 13.9 | ||
| BNP | Edward Mark Butler | 540 | 12.2 | ||
| Liberal Democrat | Katie Holmes | 509 | 11.5 | ||
| Green | Chris Lord | 410 | 9.2 | ||
| Majority | 1745 | 39.3 | |||
| Turnout | 4440 | ||||
| Conservative hold | Swing | ||||
| Party | Candidate | Votes | % | ± | |
|---|---|---|---|---|---|
| Conservative | Linda Mead | 2270 | 42.6 | ||
| Tendring First | Pierre James Oxley | 1361 | 25.5 | ||
| BNP | Keith Francis Beaumont | 626 | 11.8 | ||
| Labour | Norman Jacobs | 508 | 9.5 | ||
| Green | Eleanor Mary Gordon | 325 | 6.1 | ||
| Liberal Democrat | Dominique Azid | 238 | 4.5 | ||
| Majority | 909 | 17.1 | |||
| Turnout | 5328 | ||||
| Conservative hold | Swing | ||||
| Party | Candidate | Votes | % | ± | |
|---|---|---|---|---|---|
| Conservative | Stephen Stuart Mayzes | 1566 | 39.8 | ||
| Liberal Democrat | Brian Whitson | 782 | 19.9 | ||
| BNP | Loraine Teresa Henry | 651 | 16.6 | ||
| Labour Co-op | Delia Jeanne Aldis | 649 | 16.5 | ||
| Green | Robbie Spence | 282 | 7.2 | ||
| Majority | 784 | 19.9 | |||
| Turnout | 3930 | ||||
| Conservative gain from Labour | Swing | ||||
| Party | Candidate | Votes | % | ± | |
|---|---|---|---|---|---|
| Conservative | Chris Griffiths | 1639 | 40.0 | ||
| Tendring First | Kevin Paul Watson | 694 | 16.9 | ||
| BNP | Tracey Carole Worsley | 606 | 14.8 | ||
| Labour Co-op | Roy Ernest Raby | 469 | 11.4 | ||
| Liberal Democrat | John Candler | 348 | 8.5 | ||
| Green | Clare Teresa Palmer | 223 | 5.4 | ||
| Community Representative | Kenneth George Sargeant | 123 | 3.0 | ||
| Majority | 945 | 23.0 | |||
| Turnout | 4102 | ||||
| Conservative gain from Community Representative | Swing | ||||
| Party | Candidate | Votes | % | ± | |
|---|---|---|---|---|---|
| Conservative | Anne Brown | 3209 | 51.5 | +1.4 | |
| UKIP | George Seymour Curtis | 880 | 14.1 | N/A | |
| Liberal Democrat | Barry Ronald Woodward | 821 | 13.2 | -10.4 | |
| Green | Roger Edwin Bamforth | 583 | 9.4 | +2.6 | |
| Labour | David Alexander Hough | 406 | 6.5 | -13.0 | |
| BNP | James Edward Butler | 223 | 3.6 | N/A | |
| Independent | Bruno Paul Hickman | 107 | 1.7 | N/A | |
| Majority | 2329 | 37.4 | |||
| Turnout | 6229 | ||||
| Conservative hold | Swing | ||||
| Party | Candidate | Votes | % | ± | |
|---|---|---|---|---|---|
| Conservative | Jeremy Robert Lucas | 2402 | 40.6 | -3.3 | |
| Liberal Democrat | John Martin Loxley | 2383 | 40.3 | +7.6 | |
| Green | Stephen Ford | 563 | 9.5 | +2.8 | |
| Labour | Michael John Donnachie | 323 | 5.5 | -11.0 | |
| BNP | Graham Neville Carter | 238 | 4.0 | N/A | |
| Majority | 19 | 0.3 | |||
| Turnout | 5909 | ||||
| Conservative hold | Swing | ||||
| Party | Candidate | Votes | % | ± | |
|---|---|---|---|---|---|
| Conservative | Susan Barker | 3780 | 60.9 | ||
| Liberal Democrat | Alan Ralph Thawley Liberal Democrats | 906 | 14.6 | ||
| Green | Simon Anthony Whittle | 632 | 10.2 | ||
| BNP | Lynne Patricia Turpin British National | 500 | 8.1 | ||
| Labour | Bill McCarthy | 390 | 6.3 | ||
| Majority | 2874 | 46.3 | |||
| Turnout | 6208 | ||||
| Conservative hold | Swing | ||||
| Party | Candidate | Votes | % | ± | |
|---|---|---|---|---|---|
| Liberal Democrat | Janet Hilda Whitehouse | 2481 | 42.3 | ||
| Conservative | James Edward Surguy | 2080 | 35.5 | ||
| UKIP | Andrew George Smith | 581 | 9.9 | ||
| BNP | Tony Frankland | 306 | 5.2 | ||
| Green | Daniel Joseph Kieve | 219 | 3.7 | ||
| Labour | Simon David Bullough | 192 | 3.3 | ||
| Majority | 401 | 6.8 | |||
| Turnout | 5859 | ||||
| Liberal Democrat gain from Conservative | Swing | ||||
| Party | Candidate | Votes | % | ± | |
|---|---|---|---|---|---|
| Conservative | Mick Page | 3215 | 46.2 | ||
| Tendring First | Terry Allen | 2253 | 32.4 | ||
| BNP | Pat Henry | 500 | 7.2 | ||
| Green | Sandra Adele Moog | 500 | 7.2 | ||
| Labour Co-op | James William Osben | 495 | 7.1 | ||
| Majority | 962 | 13.8 | |||
| Turnout | 6963 | ||||
| Conservative hold | Swing | ||||
| Party | Candidate | Votes | % | ± | |
|---|---|---|---|---|---|
| Liberal Democrat | Maureen Miller | 2545 | 40.9 | ||
| Conservative | Janette Anita Potter | 2089 | 33.6 | ||
| UKIP | Jesse Pryke | 785 | 12.6 | ||
| Labour | James Michael French | 326 | 5.2 | ||
| Green | Colin Budgey | 260 | 4.2 | ||
| BNP | Jemma Cutts | 216 | 3.5 | ||
| Majority | 456 | 7.3 | |||
| Turnout | 6221 | ||||
| Conservative hold | Swing | ||||
| Party | Candidate | Votes | % | ± | |
|---|---|---|---|---|---|
| Conservative | Jillian Mary Reeves | 2965 | 52.0 | ||
| Say No to European Union | Bob Eldridge | 1023 | 17.9 | ||
| Labour Co-op | John Trollope | 507 | 8.9 | ||
| Green | Lesley Patricia Morgan | 427 | 7.5 | ||
| Liberal Democrat | Paul Jeffrey Westlake | 406 | 7.1 | ||
| BNP | Peter Barber | 378 | 6.6 | ||
| Majority | 1942 | 34.0 | |||
| Turnout | 5706 | ||||
| Conservative hold | Swing | ||||
| Party | Candidate | Votes | % | ± | |
|---|---|---|---|---|---|
| Conservative | Joe Pike | 2196 | 40.8 | ||
| UKIP | Michael Leonard Ford | 790 | 14.7 | ||
| Labour | Malcolm John Fincken | 600 | 11.2 | ||
| Liberal Democrat | Alan Crowe | 584 | 10.9 | ||
| English Democrat | Raymond Brown | 529 | 9.8 | ||
| Green | Patricia Ann Brunton | 413 | 7.7 | ||
| BNP | Linda Henry | 265 | 4.9 | ||
| Majority | 1406 | 26.1 | |||
| Turnout | 5377 | ||||
| Conservative hold | Swing | ||||
| Party | Candidate | Votes | % | ± | |
|---|---|---|---|---|---|
| Conservative | Michael George Garnett | 1838 | 33.2 | ||
| Labour | Paul Michael Sztumpf | 1378 | 24.9 | ||
| Liberal Democrat | Ian Stephen Jackson | 1129 | 20.4 | ||
| BNP | Geoffrey Mark Williams | 716 | 12.9 | ||
| Green | Robert Charles King | 472 | 8.5 | ||
| Majority | 460 | 8.3 | |||
| Turnout | 5533 | ||||
| Conservative gain from Labour | Swing | ||||
| Party | Candidate | Votes | % | ± | |
|---|---|---|---|---|---|
| Conservative | Eddie Johnson | 1956 | 40.8 | ||
| Labour | Mike Danvers | 983 | 20.5 | ||
| Liberal Democrat | Linda Janette Pailing | 859 | 17.9 | ||
| BNP | Thomas Leonard Richardson | 677 | 14.1 | ||
| Green | Suzzanne Mary King | 320 | 6.7 | ||
| Majority | 973 | 20.3 | |||
| Turnout | 4795 | ||||
| Conservative hold | Swing | ||||
| Party | Candidate | Votes | % | ± | |
|---|---|---|---|---|---|
| Conservative | Lee Tony Dangerfield | 3235 | 18.1 | ||
| Conservative | Guy Laurence Mitchinson | 2939 | 16.4 | ||
| Labour | Tony Durcan | 2549 | 14.2 | ||
| Labour | Jenny Holland | 2453 | 13.7 | ||
| Liberal Democrat | Tim Sanderson | 1504 | 8.4 | ||
| Liberal Democrat | Manny Doku | 1447 | 8.1 | ||
| BNP | Paul Richard Evans | 1381 | 7.7 | ||
| BNP | Scott Lee Cato | 1318 | 7.4 | ||
| Green | Cheryl Anne Gerrard | 1066 | 6.0 | ||
| Majority | 390 | 2.2 | |||
| Turnout | 17,892 | ||||
| Conservative gain from Labour | Swing | ||||
| Conservative gain from Labour | Swing | ||||
| Party | Candidate | Votes | % | ± | |
|---|---|---|---|---|---|
| Conservative | Ricky Callender Conservative | 1746 | 36.5 | ||
| Community Representative | Steven Robert Henderson | 1115 | 23.3 | ||
| Labour Co-op | Les Double | 996 | 20.8 | ||
| BNP | Anthony Evennett | 331 | 6.9 | ||
| Liberal Democrat | Kate Douglas | 302 | 6.3 | ||
| Green | Frank Barton Green | 293 | 6.1 | ||
| Majority | 631 | 13.2 | |||
| Turnout | 4783 | ||||
| Conservative gain from Labour | Swing | ||||
| Party | Candidate | Votes | % | ± | |
|---|---|---|---|---|---|
| Conservative | David Malcolm Finch | 3329 | 54.5 | ||
| Liberal Democrat | Stephen John Bolter | 1130 | 18.5 | ||
| Green | Agnes Joyce Wells | 706 | 11.6 | ||
| BNP | Richard Higby | 504 | 8.3 | ||
| Labour | John Kotz | 435 | 7.1 | ||
| Majority | 2199 | 36.0 | |||
| Turnout | 6104 | ||||
| Conservative hold | Swing | ||||
| Party | Candidate | Votes | % | ± | |
|---|---|---|---|---|---|
| Conservative | Rodney Lister Bass | 3338 | 53.9 | ||
| Liberal Democrat | Matthew Francis Bellard | 992 | 16.0 | ||
| Green | Robert Ernest Charles Graves | 803 | 13.0 | ||
| BNP | Adrian John Litscher | 585 | 9.4 | ||
| Labour | Norman George Hunt | 473 | 7.6 | ||
| Majority | 2346 | 37.9 | |||
| Turnout | 6191 | ||||
| Conservative hold | Swing | ||||
| Party | Candidate | Votes | % | ± | |
|---|---|---|---|---|---|
| Conservative | John David Dornan | 2349 | 16.7 | ||
| Conservative | Terri Lilian Joan Sargent | 2282 | 16.2 | ||
| Labour | William Archibald | 2094 | 14.9 | ||
| Labour | Rachel Elizabeth Liebeschuetz | 1686 | 12.0 | ||
| BNP | David Micheal King | 1612 | 11.4 | ||
| BNP | Leonard Alfred Heather | 1608 | 11.4 | ||
| Liberal Democrat | Arnold Lutton | 1240 | 8.8 | ||
| Liberal Democrat | Linda Mary Williams | 1214 | 8.6 | ||
| Majority | 188 | 1.3 | |||
| Turnout | 14,085 | ||||
| Conservative gain from Labour | Swing | ||||
| Conservative gain from Labour | Swing | ||||
| Party | Candidate | Votes | % | ± | |
|---|---|---|---|---|---|
| Independent Loughton Residents Association | Chris Pond | 2764 | 55.2 | ||
| Conservative | Mitchell Moshe Cohen | 911 | 18.2 | ||
| BNP | Rodney Travis Law | 529 | 10.6 | ||
| UKIP | Michael Jack McGough | 317 | 6.3 | ||
| Labour | Martin Lawford | 250 | 5.0 | ||
| Green | Jesse Briton | 120 | 2.4 | ||
| Liberal Democrat | Christopher Michael Spence | 117 | 2.3 | ||
| Majority | 1853 | 37.0 | |||
| Turnout | 5008 | ||||
| Independent Loughton Residents Association hold | Swing | ||||
| Party | Candidate | Votes | % | ± | |
|---|---|---|---|---|---|
| Conservative | Penny Channer Conservative | 2359 | 41.6 | ||
| Canvey Island Independent | Brian Harold Mead | 1180 | 20.8 | ||
| Liberal Democrat | Christopher John Crowther | 621 | 11.0 | ||
| Green | Janet Marilyn Carden | 600 | 10.6 | ||
| Labour | Michael John Charles Bentley | 515 | 9.1 | ||
| BNP | Len Blain | 391 | 6.9 | ||
| Majority | 1179 | 20.8 | |||
| Turnout | 5666 | ||||
| Conservative hold | Swing | ||||
| Party | Candidate | Votes | % | ± | |
|---|---|---|---|---|---|
| Liberal Democrat | Lyn Barton | 1344 | 32.3 | +0.5 | |
| Labour | Dave Harris | 1226 | 29.4 | -5.4 | |
| Conservative | Roger Buston | 1021 | 24.5 | -4.2 | |
| BNP | Daniel Hack | 297 | 7.1 | N/A | |
| Green | Pamela Elizabeth Nelson | 277 | 6.7 | ||
| Majority | 118 | 2.1 | |||
| Turnout | 4165 | ||||
| Liberal Democrat gain from Labour | Swing | ||||
| Party | Candidate | Votes | % | ± | |
|---|---|---|---|---|---|
| Conservative | John Gilbert Jowers | 3004 | 56.7 | +12.7 | |
| Liberal Democrat | Jon Longman | 900 | 17.0 | +0.8 | |
| Green | Kathy Bamforth | 562 | 10.6 | +6.0 | |
| BNP | Michael Donald Bruce Newbury | 437 | 8.2 | N/A | |
| Labour | John Christopher Wood | 395 | 7.5 | -13.3 | |
| Majority | 2104 | 39.7 | |||
| Turnout | 5298 | ||||
| Conservative hold | Swing | ||||
| Party | Candidate | Votes | % | ± | |
|---|---|---|---|---|---|
| Liberal Democrat | Anne Turrell | 2509 | 54.2 | +16.1 | |
| Conservative | Brian David Henry Jarvis | 1337 | 28.9 | -8.8 | |
| Green | Mary Hilda Bryan | 315 | 6.8 | +1.0 | |
| Labour | Robert Anthony Abbott Fisher | 262 | 5.7 | -12.7 | |
| BNP | Benjamin Lewis Jones | 209 | 4.5 | N/A | |
| Majority | 1172 | 25.3 | |||
| Turnout | 4632 | ||||
| Liberal Democrat hold | Swing | ||||
| Party | Candidate | Votes | % | ± | |
|---|---|---|---|---|---|
| Conservative | Anthony James Jackson | 3119 | 61.0 | ||
| BNP | Julian Peter Leppert | 612 | 12.0 | ||
| Liberal Democrat | Matthew Lake | 524 | 10.2 | ||
| Green | Nicola Lesley Mary Harries | 442 | 8.6 | ||
| Labour | Kelvin Michael Morris | 419 | 8.2 | ||
| Majority | 2507 | 49.0 | |||
| Turnout | 5116 | ||||
| Conservative hold | Swing | ||||
| Party | Candidate | Votes | % | ± | |
|---|---|---|---|---|---|
| Conservative | Gerard William McEwen | 2358 | 53.0 | ||
| Liberal Democrat | Derek James Jacobs | 656 | 14.7 | ||
| English Democrat | Robin Tilbrook | 505 | 11.3 | ||
| BNP | Peter James Turpin | 380 | 8.5 | ||
| Green | Jessica Barnecutt | 288 | 6.5 | ||
| Labour | Sheila Spring Labour | 265 | 6.0 | ||
| Majority | 1702 | 38.2 | |||
| Turnout | 4452 | ||||
| Conservative hold | Swing | ||||
| Party | Candidate | Votes | % | ± | |
|---|---|---|---|---|---|
| Liberal Democrat | Theresa Margaret Anne Higgins | 2183 | 49.3 | +5.9 | |
| Conservative | Christopher John Arnold Conservative | 1183 | 26.7 | +3.2 | |
| Green | Maria Iacovou | 419 | 9.5 | +4.4 | |
| BNP | Gary Saveall | 328 | 7.4 | N/A | |
| Labour | Adam Daniel Fox | 317 | 7.2 | -14.4 | |
| Majority | 1000 | 22.6 | |||
| Turnout | 4430 | ||||
| Liberal Democrat hold | Swing | ||||
| Party | Candidate | Votes | % | ± | |
|---|---|---|---|---|---|
| Conservative | David Martin Abrahall | 2437 | 15.4 | ||
| Conservative | Sandra Elizabeth Hillier | 2122 | 13.4 | ||
| Labour | Keith Bobbin | 2027 | 12.8 | ||
| Labour | Paul Leslie Kirkman | 1836 | 11.6 | ||
| UKIP | Terry Douglas McBride | 1725 | 10.9 | ||
| UKIP | Janet Lilian Davies | 1637 | 10.4 | ||
| BNP | Philip David Howell | 1439 | 9.1 | ||
| BNP | Raymond Pearce | 1072 | 6.8 | ||
| Liberal Democrat | Elizabeth Grant | 788 | 5.0 | ||
| Liberal Democrat | Emma Peall | 697 | 4.4 | ||
| Majority | 95 | 0.6 | |||
| Turnout | 15780 | ||||
| Conservative gain from Labour | Swing | ||||
| Conservative gain from Labour | Swing | ||||
| Party | Candidate | Votes | % | ± | |
|---|---|---|---|---|---|
| Conservative | Stephen Charles Castle | 2095 | 38.3 | ||
| Liberal Democrat | Chris Black | 1739 | 31.8 | ||
| English Democrat | John Hayter | 718 | 13.1 | ||
| UKIP | Tony Smith | 416 | 7.6 | ||
| BNP | Lisa Byrne | 278 | 5.1 | ||
| Labour | David Dennis Bodimeade | 226 | 4.1 | ||
| Majority | 356 | 6.5 | |||
| Turnout | 5472 | ||||
| Conservative hold | Swing | ||||
| Party | Candidate | Votes | % | ± | |
|---|---|---|---|---|---|
| Conservative | Mavis Joan Webster | 2165 | 48.9 | ||
| English Democrat | Paula Hayter | 847 | 19.1 | ||
| Liberal Democrat | Lindsay Caroline Frend | 777 | 17.6 | ||
| BNP | Donna-Marie Loughran | 347 | 7.8 | ||
| Labour | Alan Bennett | 289 | 6.5 | ||
| Majority | 1318 | 29.8 | |||
| Turnout | 4425 | ||||
| Conservative hold | Swing | ||||
| Party | Candidate | Votes | % | ± | |
|---|---|---|---|---|---|
| Conservative | Tracey Margaret Chapman | 2490 | 51.7 | ||
| BNP | John Joseph Curtin | 705 | 14.6 | ||
| Liberal Democrat | Debbie Taylor | 679 | 14.1 | ||
| Green | Andrew John Vaughan | 618 | 12.8 | ||
| Labour | David Thomas Kirkman | 328 | 6.8 | ||
| Majority | 1785 | 37.0 | |||
| Turnout | 4820 | ||||
| Conservative hold | Swing | ||||
| Party | Candidate | Votes | % | ± | |
|---|---|---|---|---|---|
| Conservative | Roy Pearson | 1996 | 51.1 | ||
| BNP | Earl Victor Strobridge | 547 | 14.0 | ||
| Green | Douglas John Copping | 517 | 13.2 | ||
| Labour | David James Michael Lench | 491 | 12.6 | ||
| Liberal Democrat | Lester Wakeling | 354 | 9.1 | ||
| Majority | 1449 | 37.1 | |||
| Turnout | 3905 | ||||
| Conservative hold | Swing | ||||
| Party | Candidate | Votes | % | ± | |
|---|---|---|---|---|---|
| Conservative | Bonnie Hart | 2972 | 56.8 | ||
| Liberal Democrat | Sid Cumberland | 900 | 17.2 | ||
| BNP | Sandra Lynn Matthews | 874 | 16.7 | ||
| Labour | Angelina Donna Marriott | 489 | 9.3 | ||
| Majority | 2072 | 39.6 | |||
| Turnout | 5235 | ||||
| Conservative hold | Swing | ||||
| Party | Candidate | Votes | % | ± | |
|---|---|---|---|---|---|
| Conservative | Robert Pursey Chambers | 3287 | 50.6 | ||
| Liberal Democrat | Richard Ford Freeman | 1506 | 23.2 | ||
| Green | Trilby Fiona Roberts | 891 | 13.7 | ||
| Labour | Yvonne Lily Morton | 483 | 7.4 | ||
| BNP | Susan Irene Clapp | 332 | 5.1 | ||
| Majority | 1781 | 27.4 | |||
| Turnout | 6499 | ||||
| Conservative hold | Swing | ||||
| Party | Candidate | Votes | % | ± | |
|---|---|---|---|---|---|
| Conservative | Colin George Riley | 2702 | 54.0 | ||
| Labour | Emma Spicer | 757 | 15.1 | ||
| BNP | Mark Cooling | 652 | 13.0 | ||
| Liberal Democrat | Jeni Goldfinch | 475 | 9.5 | ||
| Green | Nanine Danielle Laurette Othni Pachy | 422 | 8.4 | ||
| Majority | 1945 | 38.8 | |||
| Turnout | 5008 | ||||
| Conservative hold | Swing | ||||
| Party | Candidate | Votes | % | ± | |
|---|---|---|---|---|---|
| Conservative | Norman John Hume | 1808 | 43.9 | ||
| Canvey Island Independent | Ian Clifford Roberts | 1076 | 26.1 | ||
| Liberal Democrat | Barry John Passingham Liberal Democrats | 393 | 9.5 | ||
| BNP | Victor Scott | 359 | 8.7 | ||
| Labour | Margaret Lesley Vanner Labour | 291 | 7.1 | ||
| Green | Stephanie Bills | 193 | 4.7 | ||
| Majority | 732 | 17.8 | |||
| Turnout | 4120 | ||||
| Conservative hold | Swing | ||||
| Party | Candidate | Votes | % | ± | |
|---|---|---|---|---|---|
| Conservative | Bob Boyce | 2821 | 44.8 | ||
| UKIP | Tim Drain | 1376 | 21.9 | ||
| Liberal Democrat | Marian Elsden | 614 | 9.8 | ||
| Labour | Pauline Susan Wells | 551 | 8.8 | ||
| BNP | Nev Saveall | 490 | 7.8 | ||
| Green | Jonathan Peter King | 440 | 7.0 | ||
| Majority | 1445 | 23.0 | |||
| Turnout | 6292 | ||||
| Conservative hold | Swing | ||||
| Party | Candidate | Votes | % | ± | |
|---|---|---|---|---|---|
| Liberal Democrat | Michael John Mackrory | 2845 | 45.7 | ||
| Conservative | Paul John Leslie Hutchinson | 2340 | 37.6 | ||
| BNP | Bernard Alfred John Corby | 403 | 6.5 | ||
| Green | John Howard Bills | 340 | 5.5 | ||
| Labour Co-op | Robert Joseph Jones | 302 | 4.8 | ||
| Majority | 505 | 8.1 | |||
| Turnout | 6230 | ||||
| Liberal Democrat hold | Swing | ||||
| Party | Candidate | Votes | % | ± | |
|---|---|---|---|---|---|
| Conservative | Ray Gooding | 2748 | 43.6 | ||
| Liberal Democrat | Alan Dean | 2651 | 42.0 | ||
| Green | Karmel Stannard | 421 | 6.7 | ||
| BNP | George Anthony Martin | 288 | 4.6 | ||
| Labour | Barbara Ann Light | 198 | 3.1 | ||
| Majority | 97 | 1.5 | |||
| Turnout | 6306 | ||||
| Conservative hold | Swing | ||||
| Party | Candidate | Votes | % | ± | |
|---|---|---|---|---|---|
| Conservative | Kevin Paul Bentley | 2394 | 44.7 | +0.4 | |
| Liberal Democrat | Colin Leslie Sykes | 1538 | 28.7 | -2.4 | |
| Labour | Michael Edward Charles Lilley | 551 | 10.3 | -9.7 | |
| Green | Walter Schwarz | 539 | 10.1 | +4.5 | |
| BNP | Shaun Cuming | 331 | 6.2 | N/A | |
| Majority | 856 | 16.0 | |||
| Turnout | 5353 | ||||
| Conservative hold | Swing | ||||
| Party | Candidate | Votes | % | ± | |
|---|---|---|---|---|---|
| Conservative | Paul White | 3726 | 65.7 | ||
| Liberal Democrat | Angela Robinson | 711 | 12.5 | ||
| Green | Richard Alexander Monk | 493 | 8.7 | ||
| BNP | Charlotte Davis | 442 | 7.8 | ||
| Labour | Una Norman | 297 | 5.2 | ||
| Majority | 3015 | 53.2 | |||
| Turnout | 5669 | ||||
| Conservative hold | Swing | ||||
| Party | Candidate | Votes | % | ± | |
|---|---|---|---|---|---|
| Conservative | Mick Skeels | 2002 | 35.3 | ||
| Tendring First | Mark Alan Cossens | 1271 | 22.4 | ||
| Labour | Charlie Powell | 589 | 10.4 | ||
| Liberal Democrat | Joyce Edith O'Brien | 528 | 9.3 | ||
| BNP | Peter Hack | 518 | 9.1 | ||
| Green | Chris Southall | 447 | 7.9 | ||
| Community Representative | Tony Colbourne | 253 | 4.5 | ||
| Majority | 731 | 12.9 | |||
| Turnout | 5608 | ||||
| Conservative hold | Swing | ||||
| Party | Candidate | Votes | % | ± | |
|---|---|---|---|---|---|
| Conservative | Sarah Candy | 2195 | 40.8 | ||
| Liberal Democrat | Ann Margaret Elvin | 983 | 18.3 | ||
| UKIP | David Ross Macdonald | 892 | 16.6 | ||
| Green | Duncan Michael Gordon | 434 | 8.1 | ||
| Labour | John Ford | 358 | 6.6 | ||
| Tendring First | Jack Robertson | 287 | 5.3 | ||
| BNP | Debbie Hack | 205 | 3.8 | ||
| Community Representative | Martyn Phillip Donn | 32 | 0.6 | ||
| Majority | 1212 | 22.5 | |||
| Turnout | 5386 | ||||
| Conservative hold | Swing | ||||
| Party | Candidate | Votes | % | ± | |
|---|---|---|---|---|---|
| Conservative | Simon Michael Walsh | 3106 | 56.0 | ||
| Liberal Democrat | Ron Clover | 968 | 17.5 | ||
| Green | Peter Gervase Francis Vernon | 644 | 11.6 | ||
| English Democrat | Gloria Meredew | 335 | 6.0 | ||
| BNP | Edward John Long | 263 | 4.7 | ||
| Labour | Yad Sardar Zewar Zanganah | 230 | 4.1 | ||
| Majority | 2138 | 38.6 | |||
| Turnout | 5546 | ||||
| Conservative hold | Swing | ||||
| Party | Candidate | Votes | % | ± | |
|---|---|---|---|---|---|
| Conservative | Roger Walters | 2648 | 55.9 | ||
| Liberal Democrat | Peter James Braley | 612 | 12.9 | ||
| English Democrat | Colin William Morris | 561 | 11.8 | ||
| Green | Stephen Eric Hicks | 412 | 8.7 | ||
| Labour | Moia Thorogood | 274 | 5.8 | ||
| BNP | Michael Keeble | 231 | 4.9 | ||
| Majority | 2036 | 43.0 | |||
| Turnout | 4738 | ||||
| Conservative hold | Swing | ||||
| Party | Candidate | Votes | % | ± | |
|---|---|---|---|---|---|
| Conservative | Bill Dick Conservative | 2076 | 43.9 | ||
| UKIP | Jean Annita Hulse | 916 | 19.4 | ||
| Labour Co-op | Joe Cooke | 658 | 13.9 | ||
| Liberal Democrat | Ian Fuller | 384 | 8.1 | ||
| BNP | Linda Elizabeth England | 373 | 7.9 | ||
| Green | Eileen Elizabeth Peck | 319 | 6.7 | ||
| Majority | 1160 | 24.5 | |||
| Turnout | 4726 | ||||
| Conservative hold | Swing | ||||
| Party | Candidate | Votes | % | ± | |
|---|---|---|---|---|---|
| Conservative | Liz Webster | 2577 | 50.5 | ||
| BNP | Pat Richardson | 1072 | 21.0 | ||
| Liberal Democrat | Pat Brooks | 682 | 13.4 | ||
| Labour | Mitch Diamond-Conway | 445 | 8.7 | ||
| Green | Nicky Fuller | 323 | 6.3 | ||
| Majority | 1505 | 29.5 | |||
| Turnout | 5099 | ||||
| Conservative hold | Swing | ||||
| Party | Candidate | Votes | % | ± | |
|---|---|---|---|---|---|
| Conservative | Don Morris | 4732 | 27.1 | ||
| Conservative | Iris Pummell | 4545 | 26.0 | ||
| UKIP | Ron Long | 1854 | 10.6 | ||
| BNP | Anthony Mark Gladwin | 1449 | 8.3 | ||
| Liberal Democrat | Philip Edward Jenkins | 1189 | 6.8 | ||
| Liberal Democrat | Benjamin Paul Williams | 1045 | 6.0 | ||
| BNP | Christopher Roberts | 947 | 5.4 | ||
| Labour | Santa Nina Bennett | 875 | 5.0 | ||
| Labour | Patricia Ann Rackley | 813 | 4.7 | ||
| Majority | 2691 | 15.4 | |||
| Turnout | 17,449 | ||||
| Conservative hold | Swing | ||||
| Conservative hold | Swing | ||||
| Party | Candidate | Votes | % | ± | |
|---|---|---|---|---|---|
| Conservative | Michael Charles Moore Lager | 1793 | 31.8 | ||
| Green | James Edward Abbott | 1307 | 23.2 | ||
| Labour | Phil Barlow | 946 | 16.8 | ||
| UKIP | David Hodges | 751 | 13.3 | ||
| Liberal Democrat | Pamela Hooper | 490 | 8.7 | ||
| BNP | Robert Rundell | 349 | 6.2 | ||
| Majority | 486 | 8.6 | |||
| Turnout | 5636 | ||||
| Conservative hold | Swing | ||||
| Party | Candidate | Votes | % | ± | |
|---|---|---|---|---|---|
| Conservative | Derrick Jonathan Louis | 2528 | 49.3 | ||
| Labour | Lucy Barlow | 800 | 15.6 | ||
| Liberal Democrat | Bernard Roy Dearlove | 671 | 13.1 | ||
| Green | Philip John Hughes | 643 | 12.5 | ||
| BNP | Rodney Leveridge | 490 | 9.5 | ||
| Majority | 1728 | 33.7 | |||
| Turnout | 5132 | ||||
| Conservative hold | Swing | ||||
| Party | Candidate | Votes | % | ± | |
|---|---|---|---|---|---|
| Labour | Julie Ann Young | 1653 | 34.7 | -2.4 | |
| Liberal Democrat | Mark Alan Cory | 1220 | 25.6 | +2.9 | |
| Conservative | Eugene Kraft | 1064 | 22.3 | -3.0 | |
| Green | Chris Fox | 580 | 12.2 | +3.2 | |
| BNP | Samantha Catherine Paterson | 248 | 5.2 | N/A | |
| Majority | 433 | 9.1 | |||
| Turnout | 4765 | ||||
| Labour hold | Swing | ||||
External links
References
- ↑ "The Representation of the People (Form of Canvass) (England and Wales) Regulations 2006, Schedule Part 1". Legislation.gov.uk. 13 October 2011. Retrieved 18 April 2012.
- ↑ "I have two homes. Can I register at both addresses?". The Electoral Commission. Retrieved 5 January 2011.
- ↑ http://www.andrewteale.me.uk/leap/results/2009/382/. Missing or empty
|title=(help)
| County council elections |
|
|---|---|
| Mayoral elections | |
| Unitary authorities |
|
Bold indicates a new unitary authority. Stoke-on-Trent cancelled mayoral election after abolishing mayoral system. | |