Mid Dorset and North Poole (UK Parliament constituency)
Coordinates: 50°42′01″N 2°04′09″W / 50.7004°N 2.0693°W
| Mid Dorset and North Poole | |
|---|---|
|
County constituency for the House of Commons | |
|
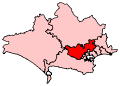
Boundary of Mid Dorset and North Poole in Dorset. | |
|
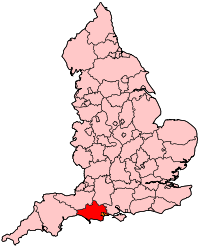
Location of Dorset within England. | |
| County | Dorset |
| Electorate | 64,705 (December 2010)[1] |
| Major settlements | Merley, Broadstone, Corfe Mullen, Bere Regis, Wareham, and Wimborne Minster |
| Current constituency | |
| Created | 1997 |
| Member of parliament | Michael Tomlinson (Conservative) |
| Number of members | One |
| Overlaps | |
| European Parliament constituency | South West England |
Mid Dorset and North Poole is a constituency[n 1] represented in the House of Commons of the UK Parliament since 2015 by Michael Tomlinson, a Conservative.[n 2]
Boundaries
1997-2010: The District of Purbeck wards of Bere Regis, Lytchett Matravers, Lytchett Minster, St Martin, and Wareham, the District of East Dorset wards of Corfe Mullen Central, Corfe Mullen North, and Corfe Mullen South, and the Borough of Poole wards of Alderney, Broadstone, Canford Heath, Canford Magna, and Creekmoor.
2010-present: The District of Purbeck wards of Bere Regis, Lytchett Matravers, Lytchett Minster and Upton East, Lytchett Minster and Upton West, St Martin, and Wareham, the District of East Dorset wards of Colehill East, Colehill West, Corfe Mullen Central, Corfe Mullen North, Corfe Mullen South, and Wimborne Minster, and the Borough of Poole wards of Broadstone, Canford Heath East, Canford Heath West, and Merley and Bearwood.
The constituency was created in 1997 from parts of the seats of North Dorset, Bournemouth West, South Dorset and Poole. Its present boundaries take in wards from three districts, namely Purbeck, Poole and East Dorset.
Constituency profile
This area includes the north of the Purbeck Hills Area of Outstanding Natural Beauty and two touristic high-end towns, namely Wimborne Minster with its traditional tearooms, towering inland Minster Church and Wareham at one end of Poole Harbour. Income levels are close to the national average, taking into account the high proportion of pensioners living across the area.[2] and levels of rented[3] and social housing[2] are below the national average, particularly levels seen in cities.
Members of Parliament
| Election | Member[4] | Party | |
|---|---|---|---|
| 1997 | Christopher Fraser | Conservative | |
| 2001 | Annette Brooke | Liberal Democrat | |
| 2015 | Michael Tomlinson | Conservative | |
Elections
Elections in the 2010s
| Party | Candidate | Votes | % | ± | |
|---|---|---|---|---|---|
| Conservative | Michael Tomlinson | 23,639 | 50.8 | +6.3 | |
| Liberal Democrat | Vikki Slade | 13,109 | 28.2 | −16.9 | |
| UKIP | Richard Turner | 5,663 | 12.2 | +7.7 | |
| Labour | Patrick Canavan[6] | 2,767 | 6.0 | +0.1 | |
| Green | Mark Chivers[7] | 1,321 | 2.8 | N/A | |
| Majority | 10,530 | 22.6 | +22 | ||
| Turnout | 46,499 | 72.5 | +8.1 | ||
| Conservative gain from Liberal Democrat | Swing | +11.6 | |||
| Party | Candidate | Votes | % | ± | |
|---|---|---|---|---|---|
| Liberal Democrat | Annette Brooke | 21,100 | 45.1 | −4.9 | |
| Conservative | Nick King[9] | 20,831 | 44.5 | +7.7 | |
| Labour | Darren Adrian Brown | 2,748 | 5.9 | −4.2 | |
| UKIP | Dave Evans | 2,109 | 4.5 | +1.4 | |
| Majority | 269 | 0.6 | −11.5 | ||
| Turnout | 46,788 | 64.4 | −4.1 | ||
| Liberal Democrat hold | Swing | −6.3 | |||
Elections in the 2000s
| Party | Candidate | Votes | % | ± | |
|---|---|---|---|---|---|
| Liberal Democrat | Annette Brooke | 22,000 | 48.7 | +6.7 | |
| Conservative | Simon Alexander Hayes | 16,518 | 36.6 | −4.5 | |
| Labour | Philip Murray | 5,221 | 11.6 | −3.9 | |
| UKIP | Avril Kathleen King | 1,420 | 3.1 | +1.7 | |
| Majority | 5,482 | 12.1 | +11.2 | ||
| Turnout | 45,159 | 68.5 | +2.9 | ||
| Liberal Democrat hold | Swing | +5.6 | |||
| Party | Candidate | Votes | % | ± | |
|---|---|---|---|---|---|
| Liberal Democrat | Annette Brooke | 18,358 | 42.0 | +2.7 | |
| Conservative | Christopher Fraser | 17,974 | 41.1 | +0.4 | |
| Labour | James Sebastian Selby-Bennett | 6,765 | 15.5 | −0.3 | |
| UKIP | Jeff Mager | 621 | 1.4 | N/A | |
| Majority | 384 | 0.9 | −0.4 | ||
| Turnout | 43,718 | 65.6 | −9.8 | ||
| Liberal Democrat gain from Conservative | Swing | 1.15 | |||
Elections in the 1990s
| Party | Candidate | Votes | % | ± | |
|---|---|---|---|---|---|
| Conservative | Christopher Fraser | 20,632 | 40.7 | N/A | |
| Liberal Democrat | Alan John Leaman | 19,951 | 39.3 | N/A | |
| Labour | David Graham Collis | 8,014 | 15.8 | N/A | |
| Referendum | David Joseph Nunes Nabarro | 2,136 | 4.2 | N/A | |
| Majority | 681 | 1.3 | N/A | ||
| Turnout | 50,733 | 75.7 | N/A | ||
| Conservative win (new seat) | |||||
See also
Notes and references
- Notes
- ↑ A county constituency (for the purposes of election expenses and type of returning officer)
- ↑ As with all constituencies, the constituency elects one Member of Parliament (MP) by the first past the post system of election at least every five years.
- References
- ↑ "Electorate Figures - Boundary Commission for England". 2011 Electorate Figures. Boundary Commission for England. 4 March 2011. Retrieved 13 March 2011.
- 1 2 2001 Census
- ↑ 2011 census interactive maps
- ↑ Leigh Rayment's Historical List of MPs – Constituencies beginning with "D" (part 2)
- ↑ "Election Data 2015". Electoral Calculus. Archived from the original on 17 October 2015. Retrieved 17 October 2015.
- ↑ http://www.bournemouthecho.co.uk/news/11666795.Meet_Labour_party_contender_for_general_election_in_Mid_Dorset_and_North_Poole/
- ↑ http://sedorset.greenparty.org.uk/news/2015/02/09/dorset-greens-make-history/
- ↑ "Election Data 2010". Electoral Calculus. Archived from the original on 17 October 2015. Retrieved 17 October 2015.
- ↑ "Mid Dorset and North Poole Conservatives". Conservative candidate. Mid Dorset and North Poole. 7 September 2011. Retrieved 4 July 2012.
- ↑ "Election Data 2005". Electoral Calculus. Archived from the original on 15 October 2011. Retrieved 18 October 2015.
- ↑ "Election Data 2001". Electoral Calculus. Archived from the original on 15 October 2011. Retrieved 18 October 2015.
- ↑ "Election Data 1997". Electoral Calculus. Archived from the original on 15 October 2011. Retrieved 18 October 2015.