Newton Abbot (UK Parliament constituency)
Coordinates: 50°32′46″N 3°29′49″W / 50.546°N 3.497°W
| Newton Abbot | |
|---|---|
|
County constituency for the House of Commons | |
|
Boundary of Newton Abbot in Devon for the 2010 general election. | |
|
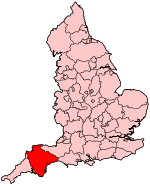
Location of Devon within England. | |
| County | Devon |
| Electorate | 69,600 (December 2010)[1] |
| Major settlements | Newton Abbot, Dawlish and Teignmouth |
| Current constituency | |
| Created | 2010 |
| Member of parliament | Anne-Marie Morris (Conservative) |
| Number of members | One |
| Created from | Teignbridge |
| Overlaps | |
| European Parliament constituency | South West England |

Newton Abbot is a constituency[n 1] represented in the House of Commons of the UK Parliament since its 2010 creation by Anne-Marie Morris, a Conservative.[n 2]
History
Parliament accepted the Boundary Commission's Fifth Periodic Review of Westminster constituencies proposing to create this constituency for the 2010 general election which increased the number of seats in the county from 11 to 12. It replaces the southern part of the former Teignbridge seat, including the town of Newton Abbot itself, as well as Dawlish and Teignmouth.[2] Nominally the 2010 results was a gain of the seat (LD-Conservative) on a swing of 5.8%. Teignbridge's other successor saw a very similar 6% swing with a much larger margin for the same winning party in Central Devon in the 2010 election.
Boundaries
The constituency is in the district of Teignbridge and has electoral wards:
- Ambrook, Bishopsteignton, Bradley, Buckland and Milber, Bushell, College, Dawlish Central and North East, Dawlish South West, Ipplepen, Kenton with Starcross, Kerswell-with-Combe, Kingsteignton East, Kingsteignton West, Shaldon and Stokeinteignhead, Teignmouth Central, Teignmouth East and Teignmouth West.[3]
Members of Parliament
| Election | Member[4] | Party | |
|---|---|---|---|
| 2010 | Anne-Marie Morris | Conservative | |
Elections
Elections in the 2010s
| Party | Candidate | Votes | % | ± | |
|---|---|---|---|---|---|
| Conservative | Anne Marie Morris | 22,794 | 47.5 | +4.3 | |
| Liberal Democrat | Richard Younger-Ross[7] | 11,506 | 23.9 | -18.1 | |
| UKIP | Rod Peers | 6,726 | 13.9 | +7.6 | |
| Labour | Roy Freer[8] | 4,736 | 9.8 | +2.8 | |
| Green | Steven Smyth-Bonfield[9] | 2,216 | 4.6 | +3.1 | |
| Majority | 11,288 | 23.4 | +22.3 | ||
| Turnout | 47,978 | 69 | -0.6 | ||
| Conservative hold | Swing | +11.2 | |||
| Party | Candidate | Votes | % | ± | |
|---|---|---|---|---|---|
| Conservative | Anne Marie Morris | 20,774 | 43.0 | +8.0 | |
| Liberal Democrat | Richard Younger-Ross* | 20,251 | 41.9 | -3.6 | |
| Labour | Patrick Canavan | 3,387 | 7.0 | -4.4 | |
| UKIP | Jackie Hooper | 3,088 | 6.4 | -0.1 | |
| Green | Corinne Lindsey | 701 | 1.5 | +1.5 | |
| Independent | Keith Sharp | 82 | 0.2 | +0.2 | |
| Majority | 523 | 1.1 | |||
| Turnout | 48,283 | 69.6 | +0.7 | ||
| Conservative gain from Liberal Democrat | Swing | +5.8 | |||
- * Served as an MP in the 2005–2010 Parliament
See also
Notes and references
- Notes
- ↑ A county constituency (for the purposes of election expenses and type of returning officer)
- ↑ As with all constituencies, the constituency elects one Member of Parliament (MP) by the first past the post system of election at least every five years.
- References
- ↑ "Electorate Figures - Boundary Commission for England". 2011 Electorate Figures. Boundary Commission for England. 4 March 2011. Archived from the original on 6 November 2010. Retrieved 13 March 2011.
- ↑ 2010 post-revision map non-metropolitan areas and unitary authorities of England
- ↑ "Final recommendations for Parliamentary constituencies in the counties of Devon, Plymouth and Torbay". Boundary Commission for England. 2004-11-24. Retrieved 2010-04-25.
- ↑ Leigh Rayment's Historical List of MPs – Constituencies beginning with "N" (part 2)
- ↑ "Election Data 2015". Electoral Calculus. Archived from the original on 17 October 2015. Retrieved 17 October 2015.
- ↑
- ↑ http://www.libdems.org.uk/richard_younger_ross
- ↑ "Roy Freer PPC page". Labour Party (UK). Retrieved 31 January 2015.
- ↑ http://southwest.greenparty.org.uk/general-election-2015.html
- ↑ "Election Data 2010". Electoral Calculus. Archived from the original on 17 October 2015. Retrieved 17 October 2015.