Stroud (UK Parliament constituency)
| Stroud | |
|---|---|
|
County constituency for the House of Commons | |
|
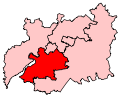
Boundary of Stroud in Gloucestershire. | |
|
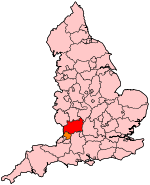
Location of Gloucestershire within England. | |
| County | Gloucestershire |
| Electorate | 79,135 (December 2010)[1] |
| Major settlements | Stroud, Dursley and Stonehouse |
| Current constituency | |
| Created | 1955 |
| Member of parliament | Neil Carmichael (Conservative) |
| Number of members | One |
| Created from | Stroud & Thornbury |
| 1885–1950 | |
| Number of members | One |
| Type of constituency | County constituency |
| Replaced by | Stroud & Thornbury |
| 1832–1885 | |
| Number of members | Two |
| Type of constituency | Borough constituency |
| Created from | Gloucestershire |
| Overlaps | |
| European Parliament constituency | South West England |
Stroud is a constituency[n 1] represented in the House of Commons of the UK Parliament since 2010 by Neil Carmichael, a Conservative.[n 2]
History
A previous parliamentary borough form of constituency of the same name was created by the First Reform Act for the 1832 general election. It elected two MPs using the bloc vote system until it was transformed in the Redistribution of Seats Act 1885 for that year's general election, the name being transferred to a single-seat county division which covered a wider geographical area.
This was abolished at the 1950 general election, partially replaced with a new Stroud and Thornbury county constituency. That was in turn abolished at the 1955 general election, when the present entity was created. Since this recreation the seat has had boundary changes.[2]
Boundaries
The seat has electoral wards:
- Amberley and Woodchester, Berkeley, Bisley, Caincross, Cam East, Cam West, Central, Chalford, Coaley and Uley, Dursley, Eastington and Standish, Farmhill and Paganhill, Hardwicke, Nailsworth, Over Stroud, Painswick, Rodborough, Severn, Slade, Stonehouse, The Stanleys, Thrupp, Trinity, Uplands, Upton St Leonards, Vale, and Valley in the Stroud District[2]
The extent of the constituency is almost all of the Stroud district (it also provides three wards to The Cotswolds seat). As such, the north-west boundary of the constituency is the River Severn, which meanders from Gloucester towards the River's estuary.
Constituency profile
Stroud lies south of Gloucester, between the two larger Gloucestershire rural constituencies of The Cotswolds and Forest of Dean. Though partially situated in the Cotswold Hills, Stroud is both smaller in area and more industrialised than these neighbours.
Much of the constituency is rural in character. Through the sparsely populated bulk, is a belt across the middle of the constituency that has a group of small but more urbanised villages, including Caincross, Cam and Rodborough.
The major market towns include Stroud itself, Dursley in the south of the constituency, and the smaller towns of Berkeley (which in fact has a smaller elctorate than Chalford, but more facilities), Stonehouse and Nailsworth.
Workless claimants, registered jobseekers, were in November 2012 significantly lower than the national average of 3.8%, at 2.1% of the population based on a statistical compilation by The Guardian.[3]
Members of Parliament
Stroud parliamentary borough
MPs 1832–1885
| Election | Member[4] | Party | Member[4] | Party | ||
|---|---|---|---|---|---|---|
| 1832 | David Ricardo | Liberal | William Henry Hyett | Liberal | ||
| 1833 by-election | George Poulett Scrope | Liberal | ||||
| 1835 | Charles Richard Fox | Liberal | ||||
| May 1835 by-election | Lord John Russell | Liberal | ||||
| 1841 | William Henry Stanton | Liberal | ||||
| 1852 | Lord Moreton | Liberal | ||||
| 1853 by-election | Edward Horsman | Liberal | ||||
| 1867 by-election | Henry Winterbotham | Liberal | ||||
| 1868 | Sebastian Dickinson | Liberal | ||||
| Jan. 1874 by-election | John Dorington | Conservative | ||||
| 1874[5] | Walter John Stanton | Liberal | ||||
| May 1874 by-election[6] | John Dorington | Conservative | Alfred John Stanton | Liberal | ||
| July 1874 by-election[7] | Henry Brand | Liberal | ||||
| 1875 by-election[8] | Samuel Stephens Marling | Liberal | ||||
| 1880 | Walter John Stanton | Liberal | Henry Brand | Liberal | ||
| 1880 | Parliamentary borough abolished. Name transferred to a new county division | |||||
Stroud division of Gloucestershire
MPs 1885–1950
Stroud County Constituency
MPs since 1955
| Election | Member[4] | Party | |
|---|---|---|---|
| 1955 | Sir Anthony Kershaw | Conservative | |
| 1987 | Roger Knapman | Conservative | |
| 1997 | David Drew | Labour Co-operative | |
| 2010 | Neil Carmichael | Conservative | |
Elections
Elections in the 2010s
| Party | Candidate | Votes | % | ± | |
|---|---|---|---|---|---|
| Conservative | Neil Carmichael | 27,813 | 45.7 | +4.9 | |
| Labour Co-op | David Drew | 22,947 | 37.7 | -0.9 | |
| UKIP | Caroline Stephens[11] | 4,848 | 8.0 | +5.7 | |
| Green | Sarah Lunnon | 2,779 | 4.6 | +1.9 | |
| Liberal Democrat | Adrian Walker-Smith | 2,086 | 3.4 | -12.0 | |
| Independent | Richard Wilson | 246 | 0.4 | +0.4 | |
| Free Public Transport | David Michael | 100 | 0.2 | +0.2 | |
| Majority | 4,866 | 8.0 | |||
| Turnout | 60,819 | 75.5 | |||
| Conservative hold | Swing | +2.9 | |||
| Party | Candidate | Votes | % | ± | |
|---|---|---|---|---|---|
| Conservative | Neil Carmichael | 23,679 | 40.8 | +2.5 | |
| Labour Co-op | David Drew | 22,380 | 38.6 | −1.5 | |
| Liberal Democrat | Dennis Andrewartha | 8,955 | 15.4 | +1.5 | |
| Green | Martin Whiteside | 1,542 | 2.7 | −3.0 | |
| UKIP | Steve Parker | 1,301 | 2.2 | +0.3 | |
| Independent | Alan Lomas | 116 | 0.2 | +0.2 | |
| Majority | 1,299 | 2.3 | |||
| Turnout | 57,973 | 74.0 | +3.9 | ||
| Conservative gain from Labour Co-op | Swing | +2.0 | |||
Elections in the 2000s
| Party | Candidate | Votes | % | ± | |
|---|---|---|---|---|---|
| Labour Co-op | David Drew | 22,527 | 39.6 | −7.0 | |
| Conservative | Neil Carmichael | 22,177 | 39.0 | +1.6 | |
| Liberal Democrat | Peter Hirst | 8,026 | 14.1 | +3.2 | |
| Green | Martin Whiteside | 3,056 | 5.4 | +1.9 | |
| UKIP | Edward Noble | 1,089 | 1.9 | +0.3 | |
| Majority | 350 | 0.6 | −8.8 | ||
| Turnout | 56875 | 71.3 | +1.3 | ||
| Labour Co-op hold | Swing | ||||
| Party | Candidate | Votes | % | ± | |
|---|---|---|---|---|---|
| Labour Co-op | David Drew | 25,685 | 46.6 | +3.9 | |
| Conservative | Neil Carmichael | 20,646 | 37.4 | −0.5 | |
| Liberal Democrat | Janice Beasley | 6,036 | 10.9 | −4.5 | |
| Green | Kevin Cranston | 1,913 | 3.5 | −0.5 | |
| UKIP | Adrian Blake | 895 | 1.6 | N/A | |
| Majority | 5,039 | 9.2 | |||
| Turnout | 55,175 | 70.0 | −8.8 | ||
| Labour Co-op hold | Swing | ||||
Elections in the 1990s
| Party | Candidate | Votes | % | ± | |
|---|---|---|---|---|---|
| Labour Co-op | David Drew | 26,170 | 42.7 | +15.8 | |
| Conservative | Roger Knapman | 23,260 | 37.9 | −8.3 | |
| Liberal Democrat | Paul Hodgkinson | 9,502 | 15.5 | −8.5 | |
| Green | John Marjoram | 2,415 | 3.9 | +1.0 | |
| Majority | 2,910 | 4.8 | |||
| Turnout | 61,347 | 79.2 | |||
| Labour Co-op gain from Conservative | Swing | +12.1 | |||
| Party | Candidate | Votes | % | ± | |
|---|---|---|---|---|---|
| Conservative | Roger Knapman | 32,201 | 46.2 | −4.0 | |
| Labour | David Drew | 18,796 | 26.9 | +8.4 | |
| Liberal Democrat | Myles P. Robinson | 16,751 | 24.0 | −7.3 | |
| Green | Ms. Sue M Atkinson | 2,005 | 2.9 | +2.9 | |
| Majority | 13,405 | 19.2 | +0.3 | ||
| Turnout | 69,753 | 84.5 | +3.9 | ||
| Conservative hold | Swing | −6.2 | |||
Elections in the 1980s
| Party | Candidate | Votes | % | ± | |
|---|---|---|---|---|---|
| Conservative | Roger Knapman | 32,883 | 50.2 | −1.1 | |
| Liberal | Adrian Anthony Walker-Smith | 20,508 | 31.3 | −0.6 | |
| Labour | Tom Levitt | 12,145 | 18.5 | +1.7 | |
| Majority | 12,375 | 18.9 | |||
| Turnout | 65,553 | 80.6 | |||
| Conservative hold | Swing | ||||
| Party | Candidate | Votes | % | ± | |
|---|---|---|---|---|---|
| Conservative | Sir John Anthony Kershaw | 30,896 | 51.3 | ||
| Liberal | G. Fallon | 19,182 | 31.9 | ||
| Labour | D.R. Parsons | 10,141 | 16.8 | ||
| Majority | 11,714 | 19.5 | |||
| Turnout | 60,219 | 77.7 | |||
| Conservative hold | Swing | ||||
Elections in the 1970s
| Party | Candidate | Votes | % | ± | |
|---|---|---|---|---|---|
| Conservative | John Anthony Kershaw | 32,534 | 52.6 | ||
| Labour | B.J. Marshall | 17,037 | 27.5 | ||
| Liberal | James Heppell | 12,314 | 19.9 | ||
| Majority | 15,497 | 25.0 | |||
| Turnout | 81.3 | ||||
| Conservative hold | Swing | ||||
| Party | Candidate | Votes | % | ± | |
|---|---|---|---|---|---|
| Conservative | John Anthony Kershaw | 24,406 | 43.8 | ||
| Labour | W.H. Maddocks | 17,352 | 31.1 | ||
| Liberal | S.A. Ritchie | 13,756 | 24.7 | ||
| United Democratic Party | J.S. Churchill | 241 | 0.4 | ||
| Majority | 7,054 | 12.7 | |||
| Turnout | 80.3 | ||||
| Conservative hold | Swing | ||||
| Party | Candidate | Votes | % | ± | |
|---|---|---|---|---|---|
| Conservative | John Anthony Kershaw | 25,619 | 43.6 | ||
| Labour | W.H. Maddocks | 17,148 | 29.2 | ||
| Liberal | S.A. Ritchie | 15,521 | 26.4 | ||
| Powell Conservative | J.S. Churchill | 470 | 0.8 | ||
| Majority | 8,471 | 14.4 | |||
| Turnout | 85.4 | ||||
| Conservative hold | Swing | ||||
| Party | Candidate | Votes | % | ± | |
|---|---|---|---|---|---|
| Conservative | John Anthony Kershaw | 27,089 | 51.1 | ||
| Labour | R. Derek Wheatley | 19,158 | 36.1 | ||
| Liberal | David M. Davies | 6,799 | 12.8 | ||
| Majority | 7,931 | 15.0 | |||
| Turnout | 80.3 | ||||
| Conservative hold | Swing | ||||
Elections in the 1960s
| Party | Candidate | Votes | % | ± | |
|---|---|---|---|---|---|
| Conservative | John Anthony Kershaw | 21,804 | 43.2 | ||
| Labour | Thomas Michael Cox | 20,259 | 40.2 | ||
| Liberal | John V. Smith | 8,397 | 16.6 | ||
| Majority | 1,545 | 3.1 | |||
| Turnout | 85.0 | ||||
| Conservative hold | Swing | ||||
| Party | Candidate | Votes | % | ± | |
|---|---|---|---|---|---|
| Conservative | John Anthony Kershaw | 21,802 | 44.1 | ||
| Labour | Dennis V. Hunt | 18,889 | 38.2 | ||
| Liberal | Iain P. Crawford | 8,747 | 17.7 | ||
| Majority | 2,913 | 5.9 | |||
| Turnout | 85.4 | ||||
| Conservative hold | Swing | ||||
Elections in the 1950s
| Party | Candidate | Votes | % | ± | |
|---|---|---|---|---|---|
| Conservative | John Anthony Kershaw | 23,448 | 48.1 | −1.3 | |
| Labour | Alfred Thomas Evans | 18,336 | 37.6 | −3.5 | |
| Liberal | Clement John McNair | 6,988 | 14.3 | +4.8 | |
| Majority | 5,112 | 10.5 | |||
| Turnout | 48,772 | 85.2 | |||
| Conservative hold | Swing | ||||
| Party | Candidate | Votes | % | ± | |
|---|---|---|---|---|---|
| Conservative | John Anthony Kershaw | 23,318 | 49.4 | N/A | |
| Labour | Richard W. Evely | 19,375 | 41.1 | N/A | |
| Liberal | Eric Barnett Ayliffe | 4,489 | 9.5 | N/A | |
| Majority | 3,943 | 8.4 | N/A | ||
| Turnout | 47,182 | 84.5 | N/A | ||
| Conservative win (new seat) | |||||
Election in the 1940s
| Party | Candidate | Votes | % | ± | |
|---|---|---|---|---|---|
| Labour | Benjamin Theaker Parkin | 22,495 | 40.77 | ||
| Conservative | Walter Robert Dempster Perkins | 21,546 | 39.05 | ||
| Liberal | Peter Egbert Cadbury | 11,141 | 20.19 | ||
| Majority | 949 | 1.72 | |||
| Turnout | 72.62 | ||||
| Labour gain from Conservative | Swing | ||||
General Election 1939/40:
Another general election was required to take place before the end of 1940. The political parties had been making preparations for an election to take place from 1939 and by the end of this year, the following candidates had been selected;
- Conservative: Walter Perkins
Elections in the 1930s
| Party | Candidate | Votes | % | ± | |
|---|---|---|---|---|---|
| Conservative | Walter Robert Dempster Perkins | 24,282 | 63.21 | ||
| Labour | Constance Elizabeth Maude Borrett | 14,133 | 36.79 | ||
| Majority | 10,149 | 26.42 | |||
| Turnout | 70.95 | ||||
| Conservative hold | Swing | ||||
| Party | Candidate | Votes | % | ± | |
|---|---|---|---|---|---|
| Conservative | Walter Robert Dempster Perkins | 27,612 | 71.4 | ||
| Labour | F W Davies | 11,039 | 28.6 | ||
| Majority | 16,573 | 42.8 | |||
| Turnout | 76.5 | ||||
| Conservative hold | Swing | ||||
| Party | Candidate | Votes | % | ± | |
|---|---|---|---|---|---|
| Unionist | Walter Robert Dempster Perkins | 17,641 | 49.6 | ||
| Labour | Sir Herbert John Maynard | 10,688 | 30.0 | ||
| Liberal | Arthur William Stanton | 7,267 | 20.4 | ||
| Majority | 6,953 | 19.6 | |||
| Turnout | 71.4 | ||||
| Unionist hold | Swing | ||||
Elections in the 1920s
| Party | Candidate | Votes | % | ± | |
|---|---|---|---|---|---|
| Unionist | Sir Frank Nelson | 17,700 | 44.4 | -9.8 | |
| Liberal | Arthur William Stanton | 11,728 | 29.5 | +8.9 | |
| Labour | F.E. White | 10,384 | 26.1 | +0.9 | |
| Majority | 5,972 | 14.9 | -18.7 | ||
| Turnout | 81.6 | +2.7 | |||
| Unionist hold | Swing | -9.4 | |||
| Party | Candidate | Votes | % | ± | |
|---|---|---|---|---|---|
| Unionist | Sir Frank Nelson | 15,973 | 54.2 | +7.4 | |
| Labour | Edith Picton-Turbervill | 7,418 | 25.2 | n/a | |
| Liberal | Arthur William Stanton | 6,057 | 20.6 | -32.6 | |
| Majority | 8,555 | 29.0 | |||
| Turnout | 78.9 | +0.7 | |||
| Unionist gain from Liberal | Swing | ||||
| Party | Candidate | Votes | % | ± | |
|---|---|---|---|---|---|
| Liberal | Rt Hon. Frederick Edward Guest | 15,179 | 53.2 | +21.9 | |
| Unionist | Stanley William Tubbs | 13,355 | 46.8 | -4.3 | |
| Majority | 1,824 | 6.4 | 26.2 | ||
| Turnout | 78.2 | ||||
| Liberal gain from Unionist | Swing | +13.1 | |||
| Party | Candidate | Votes | % | ± | |
|---|---|---|---|---|---|
| Unionist | Stanley William Tubbs | 14,723 | 51.1 | n/a | |
| Liberal | Rt Hon. Charles Peter Allen | 9,041 | 31.3 | -28.6 | |
| Labour | Samuel Edward Walters | 5,081 | 17.6 | -22.5 | |
| Majority | 5,682 | 19.8 | 0.0 | ||
| Turnout | 79.9 | +18.6 | |||
| Unionist gain from Liberal | Swing | ||||
Elections in the 1910s
| Party | Candidate | Votes | % | ± | |
|---|---|---|---|---|---|
| Liberal | 12,734 | 59.9 | |||
| Labour | Charles Wye Kendall | 8,522 | 40.1 | ||
| Majority | 4,212 | 19.8 | |||
| Turnout | 61.3 | ||||
| Liberal hold | Swing | ||||
- endorsed by Coalition Government
Elections 1832 to 1918
| Party | Candidate | Votes | % | ± | |
|---|---|---|---|---|---|
| Whig | William Henry Stanton | 594 | |||
| Whig | George Julius Poulett Scrope | 528 | |||
| Conservative | Sir William Wraxhall | 377 | |||
| Majority | |||||
| Turnout | |||||
| Whig hold | Swing | ||||
- J Symons, formerly Editor of Stroud Free Press, was a candidate but withdrew before election [17]
- A Chartist of Nailsworth by name Chapman who has issued his address couched in flaming terms worthy of the Northern Star (goes on to comment that he was a small publican and tailor [18]
Elections in the 1880s

| Party | Candidate | Votes | % | ± | |
|---|---|---|---|---|---|
| Liberal | Hon. Henry Robert Brand | 4,646 | 51.7 | ||
| Conservative | George Holloway | 4,333 | 48.3 | ||
| Majority | 313 | 3.4 | |||
| Turnout | 86.6 | n/a | |||
| Liberal hold | Swing | ||||
| Party | Candidate | Votes | % | ± | |
|---|---|---|---|---|---|
| Conservative | George Holloway | 4,620 | 54.2 | +5.9 | |
| Liberal | W.J. Stanton | 3,911 | 45.8 | -5.9 | |
| Majority | 709 | 8.4 | 11.8 | ||
| Turnout | 82.3 | -4.3 | |||
| Conservative gain from Liberal | Swing | +5.9 | |||
Elections in the 1890s
| Party | Candidate | Votes | % | ± | |
|---|---|---|---|---|---|
| Liberal | David Brynmor Jones | 4,611 | 51.1 | +5.3 | |
| Conservative | George Holloway | 4,410 | 48.9 | -5.3 | |
| Majority | 201 | 2.2 | 10.6 | ||
| Turnout | 81.5 | -0.8 | |||
| Liberal gain from Conservative | Swing | +5.3 | |||
| Party | Candidate | Votes | % | ± | |
|---|---|---|---|---|---|
| Conservative | Charles Alfred Cripps | 5,175 | 53.4 | +4.5 | |
| Liberal | Charles Peter Allen | 4,514 | 46.6 | -4.5 | |
| Majority | 661 | 6.8 | 9.0 | ||
| Turnout | 83.6 | +2.1 | |||
| Conservative gain from Liberal | Swing | +4.5 | |||
Elections in the 1900s

| Party | Candidate | Votes | % | ± | |
|---|---|---|---|---|---|
| Liberal | Charles Peter Allen | 4,692 | 51.7 | +5.1 | |
| Conservative | Charles Alfred Cripps | 4,379 | 48.3 | -5.1 | |
| Majority | 313 | 3.4 | 10.2 | ||
| Turnout | 86.6 | +3.0 | |||
| Liberal gain from Conservative | Swing | +5.1 | |||
| Party | Candidate | Votes | % | ± | |
|---|---|---|---|---|---|
| Liberal | Charles Peter Allen | 5,401 | 56.1 | +4.4 | |
| Conservative | William Burton Stewart | 4,221 | 43.9 | -4.4 | |
| Majority | 1,180 | 12.2 | +8.8 | ||
| Turnout | 90.6 | +4.0 | |||
| Liberal hold | Swing | +4.4 | |||
Elections in the 1910s
| Party | Candidate | Votes | % | ± | |
|---|---|---|---|---|---|
| Liberal | Charles Peter Allen | 5,285 | 51.6 | -4.5 | |
| Conservative | Arthur William Clifford | 4,962 | 48.4 | +4.5 | |
| Majority | 323 | 3.2 | -9.0 | ||
| Turnout | 93.2 | +2.6 | |||
| Liberal hold | Swing | -4.5 | |||
| Party | Candidate | Votes | % | ± | |
|---|---|---|---|---|---|
| Liberal | Charles Peter Allen | 5,051 | 51.0 | -0.6 | |
| Conservative | Cecil Edwin Fitch | 4,849 | 49.0 | +0.6 | |
| Majority | 202 | 2.0 | -1.2 | ||
| Turnout | 90.1 | -3.1 | |||
| Liberal hold | Swing | -0.6 | |||

General Election 1914/15:
Another General Election was required to take place before the end of 1915. The political parties had been making preparations for an election to take place and by the July 1914, the following candidates had been selected;
- Liberal: George Alexander Hardy
- Unionist: Cecil Edwin Fitch
See also
- List of Parliamentary constituencies in Gloucestershire
- Opinion polling for the next United Kingdom general election in individual constituencies
Notes
- ↑ A county constituency (for the purposes of election expenses and type of returning officer)
- ↑ As with all constituencies, the constituency elects one Member of Parliament (MP) by the first past the post system of election at least every five years.
References
Craig, F. W. S. (1983). British parliamentary election results 1918-1949 (3 ed.). Chichester: Parliamentary Research Services. ISBN 0-900178-06-X.
- ↑ "Electorate Figures - Boundary Commission for England". 2011 Electorate Figures. Boundary Commission for England. 4 March 2011. Retrieved 13 March 2011.
- 1 2 2010 post-revision map non-metropolitan areas and unitary authorities of England
- ↑ Unemployment claimants by constituency The Guardian
- 1 2 3 4 Leigh Rayment's Historical List of MPs – Constituencies beginning with "S" (part 5)
- ↑ The February 1874 general election in Stroud was declared void after a petition
- ↑ The May 1874 by-election was held two elect two members, after results of the general election had been declared void. Two MPs were elected, but the election of Dorington was overturned on petition
- ↑ The July 1874 by-election was held to elect a replacement for Dorington, whose victory at the May 1874 by-election had been declared void on petition
- ↑ The February 1875 by-election was held to elect a replacement for Brand, whose victory at the July 1874 by-election had been declared void on petition.
- ↑ "Election Data 2015". Electoral Calculus. Archived from the original on 17 October 2015. Retrieved 17 October 2015.
- ↑ http://www.stroud.gov.uk/info/elections/2015/parliamentary/07%20May%202015%20-%20Parliamentary%20-%20The%20Stroud%20Constituency.pdf 19 June 2015
- ↑ http://ukpollingreport.co.uk/2015guide/stroud/
- ↑ "Election Data 2010". Electoral Calculus. Archived from the original on 17 October 2015. Retrieved 17 October 2015.
- ↑ "Stroud District Elections Result". Stroud District Council. 2010. Retrieved 8 May 2010.
- ↑ "Politics Resources". Election 1992. Politics Resources. 9 April 1992. Retrieved 2010-12-06.
- ↑ British parliamentary election results 1918-1949, craig
- ↑ Gloucester Journal 3 July 1841 British Newspaper Archive
- ↑ Gloucester Journal 24 June 1841
- ↑ Gloucester Journal 26 June 1841
- ↑ British Parliamentary Election Results 1885-1918, FWS Craig
- ↑ British Parliamentary Election Results 1885-1918, FWS Craig
- ↑ British Parliamentary Election Results 1885-1918, FWS Craig
- ↑ British Parliamentary Election Results 1885-1918, FWS Craig
- ↑ British Parliamentary Election Results 1885-1918, FWS Craig
- ↑ British Parliamentary Election Results 1885-1918, FWS Craig
- ↑ British Parliamentary Election Results 1885-1918, FWS Craig
- ↑ British Parliamentary Election Results 1885-1918, FWS Craig