Bristol South (UK Parliament constituency)
| Bristol South | |
|---|---|
|
Borough constituency for the House of Commons | |
|
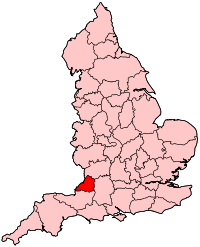
Boundary of Bristol South in Avon for the 2010 general election. | |
|
Location of Avon within England. | |
| County | City of Bristol |
| Population | 107,365 (2011 census)[1] |
| Electorate | 78,703 (December 2010)[2] |
| Current constituency | |
| Created | 1885 |
| Member of parliament | Karin Smyth (Labour) |
| Number of members | One |
| Overlaps | |
| European Parliament constituency | South West England |

Bristol South is a constituency[n 1] represented in the House of Commons of the UK Parliament since 2015 by Karin Smyth of the Labour Party.[n 2]
Boundaries
1885-1918: The Municipal Borough of Bristol wards of Bedminster East, Bedminster West, Bristol, and Redcliffe, and part of the civil parish of Bedminster.
1918-1950: The County Borough of Bristol wards of Bedminster East, Bedminster West, and Southville, and part of Somerset ward.
1950-1955: The County Borough of Bristol wards of Bedminster, Somerset, Southville, and Windmill Hill.
1955-1983: The County Borough of Bristol wards of Bedminster, Bishopsworth, Hengrove, Somerset, and Southville.
1983-1997: The City of Bristol wards of Bedminster, Bishopsworth, Filwood, Hartcliffe, Knowle, Southville, Whitchurch Park, and Windmill Hill.
1997–present: The City of Bristol wards of Bedminster, Bishopsworth, Filwood, Hartcliffe, Hengrove, Knowle, Southville, Whitchurch Park, and Windmill Hill.
The constituency covers the south-west of Bristol, bounded by the Avon New Cut to the north, the A37 Wells Road to the east, and the city boundaries to the south and west.
History
The seat has elected Labour MPs since 1935. The closest result, giving a marginal majority, was the 1987 election where Dawn Primarolo won a majority of 2.7% of the vote — in that election the Social Democratic Party, a 'moderate' breakaway party from the Labour Party,[n 3] won 19.6% of the vote.
The incumbent prior to Smyth was Dame Dawn Primarolo who held the seat for 28 years. She was a Minister of the Crown in the Blair Ministry and throughout the Coalition Government 2010 was a Deputy Speaker of the House of Commons.
Members of Parliament
Elections
Elections in the 2010s
| Party | Candidate | Votes | % | ± | |
|---|---|---|---|---|---|
| Labour | Karin Smyth [5] | 19,505 | 38.4 | -0.1 | |
| Conservative | Isobel Grant [6] | 12,377 | 24.3 | +1.4 | |
| UKIP | Steve Wood [7] | 8,381 | 16.5 | +13.9 | |
| Green | Tony Dyer [8] | 5,861 | 11.5 | +9.0 | |
| Liberal Democrat | Mark Wright [9] | 4,416 | 8.7 | -20.0 | |
| TUSC | Tom Baldwin [10] | 302 | 0.6 | +0.2 | |
| Majority | 7,128 | 14.0 | +4.2 | ||
| Turnout | 50,842 | 62.0 | +0.4 | ||
| Labour hold | Swing | -0.8 | |||
| Party | Candidate | Votes | % | ± | |
|---|---|---|---|---|---|
| Labour | Dawn Primarolo | 18,600 | 38.4 | -10.1 | |
| Liberal Democrat | Mark Wright | 13,866 | 28.7 | +4.9 | |
| Conservative | Mark Lloyd Davies | 11,086 | 22.9 | +3.3 | |
| BNP | Colin Chidsey | 1,739 | 3.6 | +3.6 | |
| UKIP | Colin McNamee | 1,264 | 2.6 | −0.5 | |
| Green | Charles Bolton | 1,216 | 2.5 | −2.5 | |
| English Democrat | Craig Clarke | 400 | 0.8 | +0.8 | |
| TUSC | Tom Baldwin | 206 | 0.4 | +0.4 | |
| Majority | 4,734 | 9.8 | −15.1 | ||
| Turnout | 48,377 | 61.6 | +2.6 | ||
| Labour hold | Swing | −7.5 | |||
Elections in the 2000s
| Party | Candidate | Votes | % | ± | |
|---|---|---|---|---|---|
| Labour | Dawn Primarolo | 20,778 | 49.1 | −7.8 | |
| Liberal Democrat | Kay Barnard | 9,636 | 22.8 | +8.0 | |
| Conservative | Graham Hill | 8,466 | 20.0 | −2.3 | |
| Green | Charlie Bolton | 2,127 | 5.0 | +2.0 | |
| UKIP | Mark Dent | 1,321 | 3.1 | +1.9 | |
| Majority | 11,142 | 26.3 | |||
| Turnout | 42,328 | 59.8 | +3.3 | ||
| Labour hold | Swing | −7.9 | |||
| Party | Candidate | Votes | % | ± | |
|---|---|---|---|---|---|
| Labour | Dawn Primarolo | 23,299 | 56.9 | −3.1 | |
| Conservative | Richard Eddy | 9,118 | 22.3 | +1.1 | |
| Liberal Democrat | James Main | 6,078 | 14.8 | +1.4 | |
| Green | Glenn Vowles | 1,233 | 3.0 | +1.6 | |
| Socialist Alliance | Brian Drummond | 496 | 1.2 | N/A | |
| UKIP | Chris Prasad | 496 | 1.2 | N/A | |
| Socialist Labour | Giles Shorter | 250 | 0.6 | N/A | |
| Majority | 14,181 | 34.6 | |||
| Turnout | 40,970 | 56.5 | −12.3 | ||
| Labour hold | Swing | ||||
Elections in the 1990s
| Party | Candidate | Votes | % | ± | |
|---|---|---|---|---|---|
| Labour | Dawn Primarolo | 29,890 | 60.0 | +9.8 | |
| Conservative | Michael Roe | 10,562 | 21.2 | −11.2 | |
| Liberal Democrat | Stephen Roy Williams | 6,691 | 13.4 | −2.2 | |
| Referendum | Derek W. Guy | 1,486 | 3.0 | N/A | |
| Green | John H. Boxall | 722 | 1.5 | 0 | |
| Socialist Alternative | Ian P. Marshall | 355 | 0.7 | N/A | |
| Glow Bowling Party | Louis P. Taylor | 153 | 0.3 | N/A | |
| Majority | 19,328 | 38.8 | |||
| Turnout | 49,859 | 68.9 | −8.9 | ||
| Labour hold | Swing | ||||
| Party | Candidate | Votes | % | ± | |
|---|---|---|---|---|---|
| Labour | Dawn Primarolo | 25,164 | 50.2 | +9.3 | |
| Conservative | John Bercow | 16,245 | 32.4 | −5.7 | |
| Liberal Democrat | Paul N. Crossley | 7,822 | 15.6 | −3.9 | |
| Green | John H. Boxall | 756 | 1.5 | +0.3 | |
| Natural Law | Neil D. Phillips | 136 | 0.3 | +0.3 | |
| Majority | 8,919 | 17.8 | +15.0 | ||
| Turnout | 50,123 | 77.8 | +3.8 | ||
| Labour hold | Swing | +7.5 | |||
Elections in the 1980s
| Party | Candidate | Votes | % | ± | |
|---|---|---|---|---|---|
| Labour | Dawn Primarolo | 20,798 | 40.9 | ||
| Conservative | Philip Stewart Cutcher | 19,394 | 38.1 | ||
| Social Democratic | Hilary Smethurst Long | 9,952 | 19.6 | ||
| Green | Glenn Royston Vowles | 600 | 1.2 | ||
| Red Front | Carol Margaret Meghji | 149 | 0.3 | ||
| Majority | 1,404 | 2.7 | |||
| Turnout | 74.1 | ||||
| Labour hold | Swing | ||||
| Party | Candidate | Votes | % | ± | |
|---|---|---|---|---|---|
| Labour | Michael Francis Lovell Cocks | 21,824 | 44.0 | ||
| Conservative | Alistair B. Gammell | 17,405 | 35.1 | ||
| Social Democratic | David M. Stanbury | 9,674 | 19.5 | ||
| Ecology | G. Collard | 352 | 0.7 | ||
| Communist | A. Chester | 224 | 0.5 | ||
| Workers Revolutionary | L.J. Byrne | 113 | 0.2 | ||
| Majority | 4,419 | 8.9 | |||
| Turnout | 68.8 | ||||
| Labour hold | Swing | ||||
Elections in the 1970s
| Party | Candidate | Votes | % | ± | |
|---|---|---|---|---|---|
| Labour | Michael Francis Lovell Cocks | 25,038 | 57.9 | ||
| Conservative | Terry Dicks | 13,855 | 32.1 | ||
| Liberal | C.J. Bidwell | 3,815 | 8.8 | ||
| National Front | K.G. Elliott | 392 | 0.9 | ||
| Workers Revolutionary | L.J. Cheek | 135 | 0.3 | ||
| Majority | 11,183 | 25.8 | |||
| Turnout | 71.9 | ||||
| Labour hold | Swing | ||||
| Party | Candidate | Votes | % | ± | |
|---|---|---|---|---|---|
| Labour | Michael Francis Lovell Cocks | 25,108 | 59.3 | ||
| Conservative | R.J. Kellaway | 10,124 | 23.9 | ||
| Liberal | D.R.F. Burrows | 6,289 | 14.9 | ||
| National Front | P.H. Gannaway | 795 | 1.9 | ||
| Majority | 14,984 | 35.4 | |||
| Turnout | 69.4 | ||||
| Labour hold | Swing | ||||
| Party | Candidate | Votes | % | ± | |
|---|---|---|---|---|---|
| Labour | Michael Francis Lovell Cocks | 24,909 | 55.2 | ||
| Conservative | R.J. Kellaway | 11,742 | 26.0 | ||
| Liberal | H.J. Stevens | 7,499 | 16.6 | ||
| National Front | P.H. Gannaway | 1,006 | 2.2 | ||
| Majority | 13,167 | 29.2 | |||
| Turnout | 74.7 | ||||
| Labour hold | Swing | ||||
| Party | Candidate | Votes | % | ± | |
|---|---|---|---|---|---|
| Labour | Michael Francis Lovell Cocks | 24,662 | 61.8 | ||
| Conservative | David James Fletcher Hunt | 15,254 | 38.2 | ||
| Majority | 9,428 | 23.6 | |||
| Turnout | 64.9 | ||||
| Labour hold | Swing | ||||
Elections in the 1960s
| Party | Candidate | Votes | % | ± | |
|---|---|---|---|---|---|
| Labour | William Albert Wilkins | 26,552 | 67.1 | ||
| Conservative | Robert William Wall | 12,998 | 32.9 | ||
| Majority | 13,554 | 34.2 | |||
| Turnout | 69.5 | ||||
| Labour hold | Swing | ||||
| Party | Candidate | Votes | % | ± | |
|---|---|---|---|---|---|
| Labour | William Albert Wilkins | 26,569 | 63.5 | ||
| Conservative | Robert William Wall | 15,282 | 36.5 | ||
| Majority | 11,287 | 27.0 | |||
| Turnout | 72.9 | ||||
| Labour hold | Swing | ||||
Elections in the 1950s
| Party | Candidate | Votes | % | ± | |
|---|---|---|---|---|---|
| Labour | William Albert Wilkins | 27,010 | 60.8 | ||
| Conservative | George Edward McWatters | 17,428 | 39.2 | ||
| Majority | 9,582 | 21.6 | |||
| Turnout | 75.7 | ||||
| Labour hold | Swing | ||||
| Party | Candidate | Votes | % | ± | |
|---|---|---|---|---|---|
| Labour | William Albert Wilkins | 24,954 | 64.1 | ||
| Conservative | George Edward McWatters | 13,978 | 35.9 | ||
| Majority | 10,976 | 28.2 | |||
| Turnout | 74.7 | ||||
| Labour hold | Swing | ||||
| Party | Candidate | Votes | % | ± | |
|---|---|---|---|---|---|
| Labour | William Albert Wilkins | 24,444 | 63.3 | ||
| Conservative | Herbert E.P. Buckle | 14,161 | 36.7 | ||
| Majority | 10,283 | 26.6 | |||
| Turnout | 84.5 | ||||
| Labour hold | Swing | ||||
| Party | Candidate | Votes | % | ± | |
|---|---|---|---|---|---|
| Labour | William Albert Wilkins | 23,456 | 59.9 | ||
| Conservative | Stephen Lynch Conway Maydon | 12,473 | 31.8 | ||
| Liberal | Dr Harold Tutt Kay | 3,259 | 8.3 | ||
| Majority | 10,983 | 28.1 | |||
| Turnout | 85.1 | ||||
| Labour hold | Swing | ||||
Elections in the 1940s
| Party | Candidate | Votes | % | ± | |
|---|---|---|---|---|---|
| Labour | William Albert Wilkins | 24,929 | 58.8 | ||
| Conservative | Edwin Hartley Cameron Leather | 12,379 | 29.2 | ||
| Liberal | Douglas Arthur Jones | 5,083 | 12.0 | ||
| Majority | 12,550 | 29.6 | |||
| Turnout | 75.5 | ||||
| Labour hold | Swing | ||||
Elections in the 1930s
| Party | Candidate | Votes | % | ± | |
|---|---|---|---|---|---|
| Labour | Alexander George Walkden | 22,586 | 50.4 | ||
| Conservative | Noel Ker Lindsay | 20,153 | 45.0 | ||
| Liberal | John Osborne Marshall Skelton | 2,090 | 4.7 | ||
| Majority | 2,433 | 5.4 | |||
| Turnout | 76.9 | ||||
| Labour gain from Conservative | Swing | ||||
| Party | Candidate | Votes | % | ± | |
|---|---|---|---|---|---|
| Conservative | Noel Ker Lindsay | 26,694 | 60.9 | ||
| Labour | Alexander George Walkden | 17,174 | 39.1 | ||
| Majority | 9,520 | 21.8 | |||
| Turnout | 82.3 | ||||
| Conservative gain from Labour | Swing | ||||
Elections in the 1920s
| Party | Candidate | Votes | % | ± | |
|---|---|---|---|---|---|
| Labour | Alexander George Walkden | 23,591 | 56.5 | +8.1 | |
| Liberal | Sir William Beddoe Rees | 18,194 | 43.5 | -8.1 | |
| Majority | 5,397 | 13.0 | 16.2 | ||
| Turnout | 80.9 | -2.1 | |||
| Labour gain from Liberal | Swing | +8.1 | |||
| Party | Candidate | Votes | % | ± | |
|---|---|---|---|---|---|
| Liberal | Sir William Beddoe Rees | 16,722 | 51.6 | ||
| Labour | David John Vaughan | 15,702 | 48.4 | ||
| Majority | 1,020 | 3.2 | |||
| Turnout | 83.0 | ||||
| Liberal hold | Swing | ||||
| Party | Candidate | Votes | % | ± | |
|---|---|---|---|---|---|
| Liberal | Sir William Beddoe Rees | 15,235 | 52.7 | -3.5 | |
| Labour | David John Vaughan | 13,701 | 47.3 | +3.5 | |
| Majority | 1,534 | 5.3 | -7.0 | ||
| Liberal hold | Swing | -3.5 | |||
| Party | Candidate | Votes | % | ± | |
|---|---|---|---|---|---|
| National Liberal | Sir William Beddoe Rees | 16,199 | 56.2 | ||
| Labour | David John Vaughan | 12,650 | 43.8 | ||
| Majority | 3,549 | 12.3 | |||
| National Liberal hold | Swing | ||||
Elections in the 1910s
| Party | Candidate | Votes | % | ± | |
|---|---|---|---|---|---|
| Liberal | 13,761 | 68.2 | |||
| Labour | Thomas Charles Lewis | 6,409 | 31.8 | ||
| Majority | 7,352 | 36.4 | |||
| Liberal hold | Swing | ||||
- endorsed by Coalition Government
Elections in the 1900s

| Party | Candidate | Votes | % | ± | |
|---|---|---|---|---|---|
| Liberal | William Howell Davies | 7,964 | 60.2 | +13.2 | |
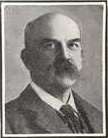
| Conservative | Rt Hon. Walter Hume Long | 5,272 | 39.8 | -13.2 | |
| Majority | 2,692 | 20.4 | 26.4 | ||
| Turnout | 88.6 | +10.4 | |||
| Liberal gain from Conservative | Swing | +13.2 | |||
See also
Notes and references
- Notes
- ↑ A borough constituency (for the purposes of election expenses and type of returning officer)
- ↑ As with all constituencies, the constituency elects one Member of Parliament (MP) by the first past the post system of election at least every five years.
- ↑ See also spoiler effect
- References
- ↑ "Bristol South: Usual Resident Population, 2011". Neighbourhood Statistics. Office for National Statistics. Retrieved 3 February 2015.
- ↑ "Electorate Figures - Boundary Commission for England". 2011 Electorate Figures. Boundary Commission for England. 4 March 2011. Archived from the original on 6 November 2010. Retrieved 13 March 2011.
- ↑ "Bristol South 1885-". Hansard 1803-2005. UK Parliament. Retrieved 2 February 2015.
- ↑ "Election Data 2015". Electoral Calculus. Archived from the original on 17 October 2015. Retrieved 17 October 2015.
- ↑ http://electionresults.blogspot.co.uk/2013/04/bristol-south-2015.html
- ↑ http://electionresults.blogspot.co.uk/2013/04/bristol-south-2015.html
- ↑ http://www.bristol.gov.uk/sites/default/files/documents/council_and_democracy/elections/BRISTOL%20SOUTH%20-%20Statement%20of%20Persons%20Nominated%20-UKPGE%20-.pdf[]
- ↑ http://electionresults.blogspot.co.uk/2013/04/bristol-south-2015.html
- ↑ http://electionresults.blogspot.co.uk/2013/04/bristol-south-2015.html
- ↑ http://www.tusc.org.uk/txt/320.pdf
- ↑ "Election Data 2010". Electoral Calculus. Archived from the original on 17 October 2015. Retrieved 17 October 2015.
- ↑ "Politics Resources". Election 1992. Politics Resources. 9 April 1992. Retrieved 2010-12-06.
- ↑ British parliamentary election results, 1885-1918 (Craig)
External links
- nomis Constituency Profile for Bristol South — presenting data from the ONS annual population survey and other official statistics.
Coordinates: 51°25′41″N 2°35′09″W / 51.42808°N 2.58587°W