Ohiowa, Nebraska
| Ohiowa, Nebraska | |
|---|---|
| Village | |
|
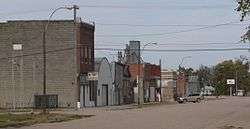
Downtown Ohiowa | |
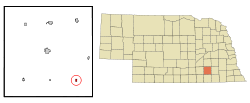 Location of Ohiowa, Nebraska | |
| Coordinates: 40°24′51″N 97°27′8″W / 40.41417°N 97.45222°WCoordinates: 40°24′51″N 97°27′8″W / 40.41417°N 97.45222°W | |
| Country | United States |
| State | Nebraska |
| County | Fillmore |
| Area[1] | |
| • Total | 0.25 sq mi (0.65 km2) |
| • Land | 0.25 sq mi (0.65 km2) |
| • Water | 0 sq mi (0 km2) |
| Elevation | 1,588 ft (484 m) |
| Population (2010)[2] | |
| • Total | 115 |
| • Estimate (2012[3]) | 113 |
| • Density | 460.0/sq mi (177.6/km2) |
| Time zone | Central (CST) (UTC-6) |
| • Summer (DST) | CDT (UTC-5) |
| ZIP code | 68416 |
| Area code(s) | 402 |
| FIPS code | 31-36015[4] |
| GNIS feature ID | 0831836[5] |
Ohiowa is a village in Fillmore County, Nebraska, United States. The population was 115 at the 2010 census.
History
Ohiowa was platted in 1886 when the railroad was extended to that point.[6] A majority of the early settlers being natives of the states of Ohio and Iowa caused the name to be selected.[7][8] The name of the village is unusual in that it contains the complete names of two states.[9]
Geography
Ohiowa is located at 40°24′51″N 97°27′8″W / 40.41417°N 97.45222°W (40.414057, -97.452190).[10]
According to the United States Census Bureau, the village has a total area of 0.25 square miles (0.65 km2), all of it land.[1]
Demographics
| Historical population | |||
|---|---|---|---|
| Census | Pop. | %± | |
| 1890 | 369 | — | |
| 1900 | 319 | −13.6% | |
| 1910 | 373 | 16.9% | |
| 1920 | 433 | 16.1% | |
| 1930 | 394 | −9.0% | |
| 1940 | 326 | −17.3% | |
| 1950 | 253 | −22.4% | |
| 1960 | 195 | −22.9% | |
| 1970 | 156 | −20.0% | |
| 1980 | 135 | −13.5% | |
| 1990 | 146 | 8.1% | |
| 2000 | 142 | −2.7% | |
| 2010 | 115 | −19.0% | |
| Est. 2015 | 110 | [11] | −4.3% |
2010 census
As of the census[2] of 2010, there were 115 people, 53 households, and 30 families residing in the village. The population density was 460.0 inhabitants per square mile (177.6/km2). There were 70 housing units at an average density of 280.0 per square mile (108.1/km2). The racial makeup of the village was 97.4% White, 0.9% Native American, 0.9% from other races, and 0.9% from two or more races. Hispanic or Latino of any race were 9.6% of the population.
There were 53 households of which 24.5% had children under the age of 18 living with them, 45.3% were married couples living together, 9.4% had a female householder with no husband present, 1.9% had a male householder with no wife present, and 43.4% were non-families. 39.6% of all households were made up of individuals and 13.2% had someone living alone who was 65 years of age or older. The average household size was 2.17 and the average family size was 2.93.
The median age in the village was 44.5 years. 25.2% of residents were under the age of 18; 3.5% were between the ages of 18 and 24; 21.7% were from 25 to 44; 32.1% were from 45 to 64; and 17.4% were 65 years of age or older. The gender makeup of the village was 49.6% male and 50.4% female.
2000 census
As of the census[4] of 2000, there were 142 people, 69 households, and 34 families residing in the village. The population density was 573.4 people per square mile (219.3/km²). There were 78 housing units at an average density of 315.0 per square mile (120.5/km²). The racial makeup of the village was 94.37% White, 0.70% African American, 2.11% from other races, and 2.82% from two or more races. Hispanic or Latino of any race were 7.04% of the population.
There were 69 households out of which 18.8% had children under the age of 18 living with them, 42.0% were married couples living together, 7.2% had a female householder with no husband present, and 50.7% were non-families. 46.4% of all households were made up of individuals and 30.4% had someone living alone who was 65 years of age or older. The average household size was 2.06 and the average family size was 2.97.
In the village the population was spread out with 19.0% under the age of 18, 6.3% from 18 to 24, 26.1% from 25 to 44, 19.0% from 45 to 64, and 29.6% who were 65 years of age or older. The median age was 44 years. For every 100 females there were 84.4 males. For every 100 females age 18 and over, there were 76.9 males.
As of 2000 the median income for a household in the village was $20,625, and the median income for a family was $28,125. Males had a median income of $23,333 versus $13,750 for females. The per capita income for the village was $12,526. There were 25.8% of families and 33.1% of the population living below the poverty line, including 73.1% of under eighteens and 22.0% of those over 64.
Notable residents
- Mato Kosyk, Sorbian writer
References
- 1 2 "US Gazetteer files 2010". United States Census Bureau. Archived from the original on January 24, 2012. Retrieved 2012-06-24.
- 1 2 "American FactFinder". United States Census Bureau. Retrieved 2012-06-24.
- ↑ "Population Estimates". United States Census Bureau. Archived from the original on June 17, 2013. Retrieved 2013-05-29.
- 1 2 "American FactFinder". United States Census Bureau. Archived from the original on September 11, 2013. Retrieved 2008-01-31.
- ↑ "US Board on Geographic Names". United States Geological Survey. 2007-10-25. Retrieved 2008-01-31.
- ↑ "Ohiowa, Fillmore County". Center for Advanced Land Management Information Technologies. University of Nebraska. Retrieved 8 August 2014.
- ↑ "Profile for Ohiowa, NE". ePodunk. Retrieved 8 August 2014.
- ↑ Fitzpatrick, Lillian L. (1960). Nebraska Place-Names. University of Nebraska Press. p. 59. A 1925 edition is available for download at University of Nebraska—Lincoln Digital Commons.
- ↑ Temple, Robert D. Edge Effects: The Border-Name Places, (2nd edition, 2009), iUniverse, ISBN 978-0-595-47758-6, page 148.
- ↑ "US Gazetteer files: 2010, 2000, and 1990". United States Census Bureau. 2011-02-12. Retrieved 2011-04-23.
- ↑ "Annual Estimates of the Resident Population for Incorporated Places: April 1, 2010 to July 1, 2015". Retrieved July 2, 2016.
- ↑ "Census of Population and Housing". Census.gov. Archived from the original on May 11, 2015. Retrieved June 4, 2015.
Municipalities and communities of Fillmore County, Nebraska, United States | ||
|---|---|---|
| City | ||
| Villages | ||
| Townships | ||
| Unincorporated communities | ||
| Ghost town | ||