San Francisco Board of Supervisors election, 2000
| Elections in California | ||||||||||
|---|---|---|---|---|---|---|---|---|---|---|
 | ||||||||||
|
||||||||||
|
||||||||||
The 2000 San Francisco Board of Supervisors elections occurred on November 7, 2000, with a runoff election held on December 12, 2000. All eleven seats were contested. Elections to odd-numbered districts were to four-year terms, while elections to even-numbered districts were to transitional two-year terms, then four-year terms thereafter.
This election was the first following the reintroduction of electoral districts for the Board of Supervisors in 2000; previously, except for a short period of time, supervisors were elected at-large. The first districts, implemented in 1977, saw Harvey Milk and Dan White attain office; the districts were abolished in 1980 in the wake of Milk's assassination by White.
Municipal elections in California are officially non-partisan, though most candidates in San Francisco do receive funding and support from various political parties.
Results
District 1
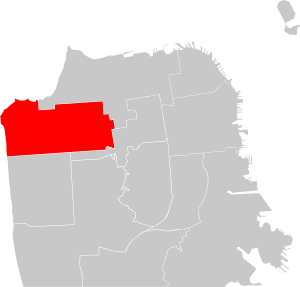
This district consists of the Richmond District. Incumbent supervisor Michael Yaki was defeated by Jake McGoldrick in the runoff.
| Candidate | Votes | Percentage | |
|---|---|---|---|
| Michael Yaki (incumbent) | 9,218 | 38.07%% | |
| Jake McGoldrick | 6,831 | 28.21% | |
| Rose Tsai | 5,347 | 22.09% | |
| Ron "K" Konopaski | 2,073 | 8.56% | |
| Jason A. Jungreis | 670 | 2.77% | |
| Write-in | 72 | 0.30% | |
| Invalid or blank votes | 3,983 | 14.13% | |
| Total votes | 28,194 | 100.00% | |
| Voter turnout | 69.8% | ||
| Runoff election | |||
| Jake McGoldrick | 7,486 | 52.08% | |
| Michael Yaki (incumbent) | 6,887 | 47.92% | |
| Invalid or blank votes | 21 | 0.15% | |
| Total votes | 14,394 | 100.00% | |
| Voter turnout | 35.4% | ||
District 2
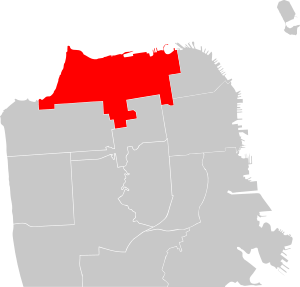
District 2 consists of the Marina, Pacific Heights, the Presidio, part of Russian Hill, and Sea Cliff. Incumbent supervisor Gavin Newsom won reelection unopposed.
| Candidate | Votes | Percentage | |
|---|---|---|---|
| Gavin Newsom (incumbent) | 26,433 | 97.65% | |
| Write-in | 637 | 2.35% | |
| Invalid or blank votes | 11,136 | 29.15% | |
| Voter turnout | 69.8% | ||
District 3
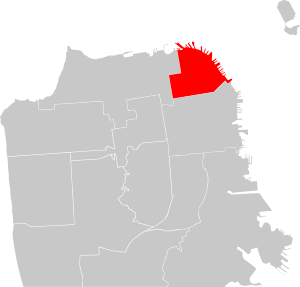
District 3 consists of the northeastern corner of San Francisco, including Chinatown, the Financial District, Fisherman's Wharf, Nob Hill, North Beach, and Telegraph Hill. Incumbent supervisor Alicia Becerril was defeated in the general election, with Aaron Peskin winning the runoff against Lawrence Wong.
| Candidate | Votes | Percentage | |
|---|---|---|---|
| Aaron Peskin | 7,565 | 35.91% | |
| Lawrence Wong | 3,111 | 14.77% | |
| Meagan Levitan | 2,669 | 12.67% | |
| Rose Chung | 2,306 | 10.95% | |
| Mike DeNunzio | 2,263 | 10.74% | |
| Alicia Becerril (incumbent) | 2,209 | 10.49% | |
| Bob Coleman | 528 | 2.51% | |
| Pelino "Paul" Jacobu | 352 | 1.67% | |
| Invalid or blank votes | 3,729 | 15.26% | |
| Total votes | 24,860 | 100.00% | |
| Voter turnout | 65.1% | ||
| Runoff election | |||
| Aaron Peskin | 7,202 | 58.02% | |
| Lawrence Wong | 5,212 | 41.98% | |
| Invalid or blank votes | 22 | 0.18% | |
| Total votes | 12,436 | 100.00% | |
| Voter turnout | 32.3% | ||
District 4
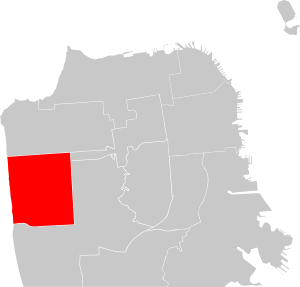
District 4 consists primarily of the Sunset district. Incumbent supervisor Leland Yee won reelection.
| Candidate | Votes | Percentage | |
|---|---|---|---|
| Leland Yee | 10,717 | 43.53% | |
| John Shanley | 4,144 | 16.83% | |
| Tom Hsieh | 3,925 | 15.94% | |
| Ron Dudum | 3,728 | 15.14% | |
| Darryl Honda | 829 | 3.37% | |
| Vu-Duc Vuong | 661 | 2.69% | |
| Jeffrey Dilwyn Roger | 548 | 2.23% | |
| Write-in | 65 | 0.26% | |
| Invalid or blank votes | 3,284 | 11.77% | |
| Total votes | 27,901 | 100.00% | |
| Voter turnout | 70.1% | ||
| Runoff election | |||
| Leland Yee | 8,453 | 57.18% | |
| John Shanley | 6,329 | 42.81% | |
| Invalid or blank votes | 31 | 0.21% | |
| Total votes | 14,813 | 100.00% | |
| Voter turnout | 37.0% | ||
District 5
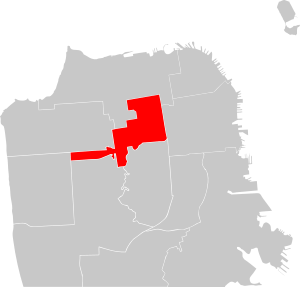
District 5 consists of the Fillmore, Haight-Ashbury, Hayes Valley, Japantown, UCSF, and the Western Addition. Matt Gonzalez won this open seat after a runoff against Juanita Owens.
| Candidate | Votes | Percentage | |
|---|---|---|---|
| Matt Gonzalez | 12,743 | 42.30% | |
| Juanita Owens | 8,589 | 28.51% | |
| Agar Jacks | 3,621 | 12.02% | |
| Holman Turner, Jr. | 1,273 | 4.23% | |
| Richard Hongisto | 1,210 | 4.02% | |
| Joe Konopka | 789 | 2.62% | |
| Jay Bagi | 743 | 2.47% | |
| Nicholas Gaffney | 504 | 1.67% | |
| Demian Barrett | 324 | 1.08% | |
| John D. Palmer | 163 | 0.54% | |
| Rob Anderson | 106 | 0.35% | |
| Write-in | 60 | 0.20% | |
| Invalid or blank votes | 5,990 | 16.59% | |
| Total votes | 36,115 | 100.00% | |
| Voter turnout | 63.9% | ||
| Runoff election | |||
| Matt Gonzalez | 10,384 | 65.36% | |
| Juanita Owens | 5,503 | 34.64% | |
| Invalid or blank votes | 36 | 0.23% | |
| Total votes | 15,923 | 100.00% | |
| Voter turnout | 28.0% | ||
District 6
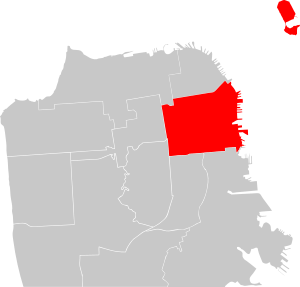
District 6 consists of Alcatraz Island, Civic Center, Mission Bay, South of Market, the Tenderloin, Treasure Island, and Yerba Buena Island. Chris Daly won this open seat after a runoff against Chris M. Dittenhafer.
| Candidate | Votes | Percentage | |
|---|---|---|---|
| Chris Daly | 6,023 | 33.78% | |
| Chris M. Dittenhafer | 2,931 | 16.44% | |
| Carol Ruth Silver | 2,666 | 14.95% | |
| Beryl Magilavy | 2,188 | 12.27% | |
| Denise D'Anne | 590 | 3.31% | |
| Hank Wilson | 508 | 2.85% | |
| Marc Salomon | 499 | 2.80% | |
| Joseph Blue | 483 | 2.71% | |
| Joan Roughgarden | 473 | 2.65% | |
| Jim Reid | 407 | 2.28% | |
| Garrett Jenkins | 366 | 2.05% | |
| Brenton Holland | 210 | 1.18% | |
| James Leo Dunn | 197 | 1.11% | |
| H. Brown | 188 | 1.05% | |
| Gilbert F. Criswell | 51 | 0.29% | |
| Write-in | 48 | 0.27% | |
| Invalid or blank votes | 5,597 | 23.89% | |
| Total votes | 23,425 | 100.00% | |
| Voter turnout | 53.5% | ||
| Runoff election | |||
| Chris Daly | 8,472 | 80.92% | |
| Chris M. Dittenhafer | 1,998 | 19.08% | |
| Invalid or blank votes | 27 | 0.26% | |
| Total votes | 10,497 | 100.00% | |
| Voter turnout | 23.9% | ||
District 7
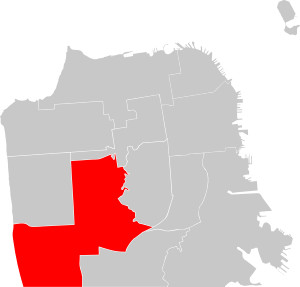
District 7 consists of City College, Forest Hill, Lake Merced, Mount Davidson, Parkmerced, San Francisco State University, St. Francis Wood, and Twin Peaks. Incumbent supervisor Mabel Teng was defeated in the runoff against Tony Hall.
| Candidate | Votes | Percentage | |
|---|---|---|---|
| Mabel Teng (incumbent) | 13,269 | 43.89% | |
| Tony Hall | 6,706 | 22.18% | |
| Rennie O'Brien | 3,656 | 12.09% | |
| Bud Wilson | 3,270 | 10.82% | |
| Harold M. Hoogasian | 2,796 | 9.25% | |
| Maryo Mogannam | 472 | 1.56% | |
| Write-in | 60 | 0.20% | |
| Invalid or blank votes | 3,638 | 10.74% | |
| Total votes | 33,867 | 100.00% | |
| Voter turnout | 74.7% | ||
| Runoff election | |||
| Tony Hall | 9,333 | 50.10% | |
| Mabel Teng (incumbent) | 9,294 | 49.90% | |
| Invalid or blank votes | 45 | 0.24% | |
| Total votes | 18,672 | 100.00% | |
| Voter turnout | 40.9% | ||
District 8
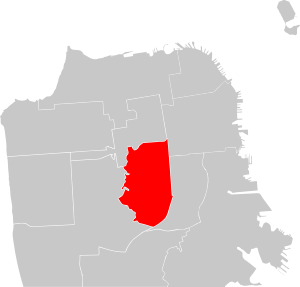
District 8 consists of The Castro, Diamond Heights, Duboce Triangle, Eureka Valley, Glen Park, and Noe Valley. Incumbent supervisor Mark Leno won reelection after a runoff against Eileen Hansen.
| Candidate | Votes | Percentage | |
|---|---|---|---|
| Mark Leno (incumbent) | 17,050 | 49.89% | |
| Eileen Hansen | 11,531 | 33.74% | |
| James Green | 2,062 | 6.03% | |
| Gary Virginia | 1,331 | 3.89% | |
| Scott Bingham | 1,205 | 3.53% | |
| Shawn O'Hearn | 932 | 2.73% | |
| Write-in | 67 | 0.20% | |
| Invalid or blank votes | 4,613 | 11.89% | |
| Total votes | 38,791 | 100.00% | |
| Voter turnout | 74.5% | ||
| Runoff election | |||
| Mark Leno (incumbent) | 9,578 | 51.93% | |
| Eileen Hansen | 8,866 | 48.07% | |
| Invalid or blank votes | 38 | 0.21% | |
| Total votes | 18,482 | 100.00% | |
| Voter turnout | 35.3% | ||
District 9
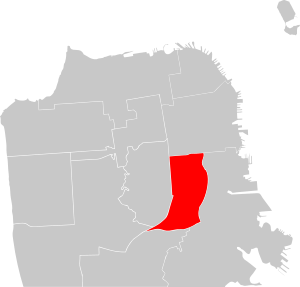
District 9 consists of Bernal Heights and the Inner Mission. Incumbent supervisor Tom Ammiano was reelected.
| Candidate | Votes | Percentage | |
|---|---|---|---|
| Tom Ammiano (incumbent) | 14,294 | 68.16% | |
| Maria Martinez | 2,972 | 14.17% | |
| Lucrecia Bermudez | 1,394 | 6.65% | |
| Ron Norlin | 1,156 | 5.51% | |
| Valerie Tulier | 1,112 | 5.30% | |
| Write-in | 44 | 0.21% | |
| Invalid or blank votes | 2,793 | 11.75% | |
| Total votes | 23,765 | 100.00% | |
| Voter turnout | 66.0% | ||
District 10
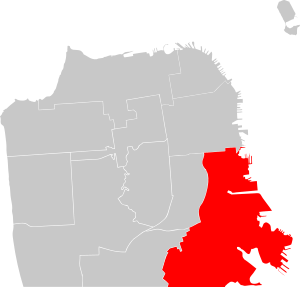
District 10 consists of Bayview-Hunters Point, McLaren Park, Portola, Potrero Hill, and Visitacion Valley. Sophie Maxwell won this open seat after a runoff against Linda Richardson.
| Candidate | Votes | Percentage | |
|---|---|---|---|
| Linda Richardson | 6,477 | 32.77% | |
| Sophie Maxwell | 4,086 | 20.67% | |
| Marie Harrison | 1,767 | 8.94% | |
| Espanola Jackson | 1,724 | 8.72% | |
| Robert H. Chan | 1,528 | 7.73% | |
| Jim Rodriguez | 961 | 4.86% | |
| Larry Shockey | 791 | 4.00% | |
| Hubert Yee | 784 | 3.97% | |
| Dwayne Jusino | 583 | 2.95% | |
| J. R. Manuel | 471 | 2.38% | |
| Hamp "Bubba" Banks | 342 | 1.73% | |
| Don Bertone | 196 | 0.99% | |
| Write-in | 54 | 0.27% | |
| Invalid or blank votes | 4,120 | 17.25% | |
| Total votes | 23,884 | 100.00% | |
| Voter turnout | 57.2% | ||
| Runoff election | |||
| Sophie Maxwell | 5,887 | 55.28% | |
| Linda Richardson | 4,762 | 44.72% | |
| Invalid or blank votes | 19 | 0.18% | |
| Total votes | 10,668 | 100.00% | |
| Voter turnout | 25.4% | ||
District 11
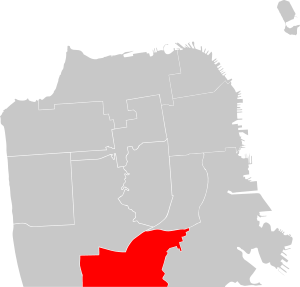
District 11 consists of the Excelsior District, Ingleside, Oceanview, and Outer Mission. Incumbent supervisor Amos Brown was defeated in the runoff against Gerardo Sandoval.
| Candidate | Votes | Percentage | |
|---|---|---|---|
| Gerardo Sandoval | 6,290 | 29.38% | |
| Amos Brown (incumbent) | 5,704 | 26.64% | |
| Myrna Viray Lim | 4,142 | 19.35% | |
| Rebecca Reynolds Silverberg | 2,228 | 10.41% | |
| Steven R. Currier | 915 | 4.27% | |
| Kathleen McConnell | 852 | 3.98% | |
| Carlos Petroni | 499 | 2.33% | |
| John Huber | 376 | 1.76% | |
| Douglan Moran | 367 | 1.71% | |
| Write-in | 36 | 0.17% | |
| Invalid or blank votes | 3,614 | 14.44% | |
| Total votes | 25,023 | 100.00% | |
| Voter turnout | 65.9% | ||
| Runoff election | |||
| Gerardo Sandoval | 8,345 | 60.88% | |
| Amos Brown (incumbent) | 5,363 | 39.12% | |
| Invalid or blank votes | 36 | 0.26% | |
| Total votes | 13,744 | 100.00% | |
| Voter turnout | 35.9% | ||
References
- 1 2 3 4 5 6 7 8 9 10 11 "November 7, 2000 Consolidated Presidential General Election Statement of Votes". San Francisco Department of Elections. Retrieved March 6, 2009.
- 1 2 3 4 5 6 7 8 9 "December 12, 2000 Municipal Run-Off Election Statement of Votes". San Francisco Department of Elections. Retrieved March 6, 2009.