St Helens North (UK Parliament constituency)
Coordinates: 53°29′10″N 2°42′50″W / 53.486°N 2.714°W
| St. Helens North | |
|---|---|
|
Borough constituency for the House of Commons | |
|
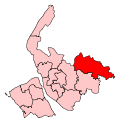
Boundary of St. Helens North in Merseyside. | |
|
Location of Merseyside within England. | |
| County | Merseyside |
| Electorate | 75,688 (December 2010)[1] |
| Major settlements | St Helens, Billinge, Earlestown, Haydock, Newton-le-Willows and Rainford |
| Current constituency | |
| Created | 1983 |
| Member of parliament | Conor McGinn (Labour) |
| Number of members | One |
| Created from | St Helens, Newton, Ince, Ormskirk and Huyton[2] |
| Overlaps | |
| European Parliament constituency | North West England |

St. Helens North is a constituency[n 1] represented in the House of Commons of the UK Parliament since 2015 by the Labour Party's Conor McGinn. Between 1997 and 2015 the MP was Labour's David Watts.[n 2]
Boundaries
The constituency is one of two covering the Metropolitan Borough, the other being St Helens South and Whiston. It includes the north of the town of St Helens, and Billinge, Seneley Green, Earlestown, Blackbrook, Haydock, Newton-le-Willows and Rainford.
Following the Fifth Periodic Review of Westminster constituencies by the Boundary Commission for the 2010 general election the constituency underwent small boundary changes, in order to match the modified ward boundaries introduced in the borough in 2004.
The seat has electoral wards:
- Billinge and Seneley Green, Blackbrook, Earlestown, Haydock, Moss Bank, Newton, Parr, Rainford, and Windle in the Metropolitan Borough of St Helens.[3]
History
The constituency was created in 1983, primarily replacing parts of the St Helens and Newton constituencies. It has to date been safe seat for the Labour Party, having been held by a member of the party since its creation, first by the former Newton MP John Evans, then from 1997 by David Watts, a former leader of St Helens council.
Constituency profile
The seat includes the large town of St Helens noted by visitors for Rugby League, Football and the nearby horseracing racecourse at Haydock Park. Despite these prominent sports venues, workless claimants, registered jobseekers, were in November 2012 higher than the national average of 3.8%, at 4.7% of the population based on a statistical compilation by The Guardian, which was close to the Greater Manchester and Merseyside average but higher than the regional average of 4.4%.[4] With the exception of the Conservative area of Rainford, virtually every other ward in the seat is safely Labour.
Members of Parliament
| Election | Member[5] | Party | |
|---|---|---|---|
| 1983 | John Evans | Labour | |
| 1997 | Dave Watts | Labour | |
| 2015 | Conor McGinn | Labour | |
Elections
Elections in the 2010s
| Party | Candidate | Votes | % | ± | |
|---|---|---|---|---|---|
| Labour | Conor McGinn | 26,378 | 57.0 | +5.3 | |
| Conservative | Paul Richardson | 9,087 | 19.6 | −2.7 | |
| UKIP | Ian Smith | 6,983 | 15.1 | +10.4 | |
| Liberal Democrat | Denise Aspinall | 2,046 | 4.4 | −15.8 | |
| Green | Elizabeth Ward | 1,762 | 3.8 | +3.8 | |
| Majority | 17,291 | 37.4 | +8.0 | ||
| Turnout | 46,256 | 61.5 | +1.7 | ||
| Labour hold | Swing | +4.0 | |||
| |-
| Party | Candidate | Votes | % | ± | |
|---|---|---|---|---|---|
| Labour | David Watts | 23,041 | 51.7 | −8.2 | |
| Conservative | Paul V. Greenall | 9,940 | 22.3 | +3.4 | |
| Liberal Democrat | John L. Beirne | 8,992 | 20.2 | −1.1 | |
| UKIP | Gary Robinson | 2,100 | 4.7 | +1.7 | |
| Socialist Labour | Stephen Benjamin Whatham | 483 | 1.0 | N/A | |
| Majority | 13,101 | 29.4 | |||
| Turnout | 44,556 | 59.8 | +2.0 | ||
| Labour hold | Swing | −6.2 | |||
Elections in the 2000s
| Party | Candidate | Votes | % | ± | |
|---|---|---|---|---|---|
| Labour | David Watts | 22,329 | 56.9 | −4.2 | |
| Liberal Democrat | John L. Beirne | 8,367 | 21.3 | +3.7 | |
| Conservative | Paul J. Oakley | 7,410 | 18.9 | +0.1 | |
| UKIP | Mrs. Sylvia Hall | 1,165 | 3.0 | N/A | |
| Majority | 13,962 | 35.6 | |||
| Turnout | 39,271 | 57.8 | +5.1 | ||
| Labour hold | Swing | −4.0 | |||
| Party | Candidate | Votes | % | ± | |
|---|---|---|---|---|---|
| Labour | David Watts | 22,977 | 61.1 | −3.8 | |
| Conservative | Simon Nicholas Charles Pearce | 7,076 | 18.8 | +1.5 | |
| Liberal Democrat | John L. Beirne | 6,609 | 17.6 | +4.8 | |
| Socialist Labour | Stephen Benjamin Whatham | 939 | 2.5 | +0.8 | |
| Majority | 15,901 | 42.3 | |||
| Turnout | 37,601 | 52.7 | −16.2 | ||
| Labour hold | Swing | ||||
Elections in the 1990s
| Party | Candidate | Votes | % | ± | |
|---|---|---|---|---|---|
| Labour | David Watts | 31,953 | 64.9 | +11.3 | |
| Conservative | Pelham J.C. Walker | 8,536 | 17.3 | −11.2 | |
| Liberal Democrat | John L. Beirne | 6,270 | 12.7 | −0.4 | |
| Referendum | David Johnson | 1,276 | 2.6 | N/A | |
| Socialist Labour | Ron Waugh | 833 | 1.7 | N/A | |
| UKIP | Richard D. Rubin | 363 | 0.7 | N/A | |
| Majority | 23,417 | 47.6 | |||
| Turnout | 49,231 | 68.9 | |||
| Labour hold | Swing | ||||
| Party | Candidate | Votes | % | ± | |
|---|---|---|---|---|---|
| Labour | John Evans | 31,930 | 57.9 | +4.3 | |
| Conservative | Brendan John Anderson | 15,686 | 28.5 | +1.2 | |
| Liberal Democrat | John L. Beirne | 7,224 | 13.1 | −6.0 | |
| Natural Law | Mrs Anne Marion Lynch | 287 | 0.5 | N/A | |
| Majority | 16,244 | 29.5 | +3.1 | ||
| Turnout | 55,127 | 77.4 | +1.1 | ||
| Labour hold | Swing | +1.5 | |||
Elections in the 1980s
| Party | Candidate | Votes | % | ± | |
|---|---|---|---|---|---|
| Labour | John Evans | 28,989 | 53.7 | +5.7 | |
| Conservative | Miss Melinda Jane Libby | 14,729 | 27.3 | −3.1 | |
| Liberal | Neil Philip Derbyshire | 10,300 | 19.1 | −2.6 | |
| Majority | 14,260 | 26.4 | |||
| Turnout | 54,018 | 76.3 | +4.0 | ||
| Labour hold | Swing | +4.4 | |||
| Party | Candidate | Votes | % | ± | |
|---|---|---|---|---|---|
| Labour | John Evans | 25,334 | 47.9 | N/A | |
| Conservative | Anthony Rhodes | 16,075 | 30.4 | N/A | |
| Liberal | Neil Philip Derbyshire | 11,525 | 21.7 | N/A | |
| Majority | 9,259 | 17.5 | N/A | ||
| Turnout | 52,934 | 74.5 | N/A | ||
| Labour win (new seat) | |||||
See also
Notes and references
- Notes
- ↑ A borough constituency (for the purposes of election expenses and type of returning officer)
- ↑ As with all constituencies, the constituency elects one Member of Parliament (MP) by the first past the post system of election at least every five years.
- References
- ↑ "Electorate Figures - Boundary Commission for England". 2011 Electorate Figures. Boundary Commission for England. 4 March 2011. Retrieved 13 March 2011.
- ↑ "'St Helens North', June 1983 up to May 1997". ElectionWeb Project. Cognitive Computing Limited. Retrieved 14 March 2016.
- ↑ 2010 post-revision map Greater London and metropolitan areas of England
- ↑ Unemployment claimants by constituency The Guardian
- ↑ Leigh Rayment's Historical List of MPs – Constituencies beginning with "S" (part 1)
- ↑ "Election Data 2015". Electoral Calculus. Archived from the original on 17 October 2015. Retrieved 17 October 2015.
- ↑ "St Helens North". BBC News. Retrieved 10 May 2015.
- ↑ "Election Data 2010". Electoral Calculus. Archived from the original on 17 October 2015. Retrieved 17 October 2015.
- ↑ "Election Data 2005". Electoral Calculus. Archived from the original on 15 October 2011. Retrieved 18 October 2015.
- ↑ "Election Data 2001". Electoral Calculus. Archived from the original on 15 October 2011. Retrieved 18 October 2015.
- ↑ "Election Data 1997". Electoral Calculus. Archived from the original on 15 October 2011. Retrieved 18 October 2015.
- ↑ "Election Data 1992". Electoral Calculus. Archived from the original on 15 October 2011. Retrieved 18 October 2015.
- ↑ "UK General Election results April 1992". Richard Kimber's Political Science Resources. Politics Resources. 9 April 1992. Retrieved 2010-12-06.
- ↑ "Election Data 1987". Electoral Calculus. Archived from the original on 15 October 2011. Retrieved 18 October 2015.
- ↑ "Election Data 1983". Electoral Calculus. Archived from the original on 15 October 2011. Retrieved 18 October 2015.