Burnley (UK Parliament constituency)
Coordinates: 53°47′13″N 2°14′42″W / 53.787°N 2.245°W
| Burnley | |
|---|---|
|
Borough constituency for the House of Commons | |
|
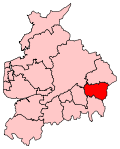
Boundary of Burnley in Lancashire. | |
|
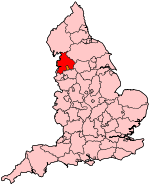
Location of Lancashire within England. | |
| County | Lancashire |
| Population | 87,059 (2011 census)[1] |
| Electorate | 67,003 (December 2010)[2] |
| Major settlements | Burnley |
| Current constituency | |
| Created | 1868 |
| Member of parliament | Julie Cooper (Labour Party) |
| Number of members | One |
| Overlaps | |
| European Parliament constituency | North West England |
Burnley is a constituency[n 1] centred on the town of Burnley in Lancashire, which has been represented in the House of Commons of the UK Parliament since 2015 by Julie Cooper of the Labour Party.[n 2]
History
The seat was created in 1868. From World War II until 2010 it was won by Labour candidates, generally on safe, large majorities; even Ann Widdecombe could not snatch the seat from the former leading cotton town's close affinity with Labour Party values as they stood in 1979. The closest second place was to a Conservative Party candidate, Ian Bruce, who came 787 votes (1.6%) short of taking the seat in 1983.[3]
Burnley saw strong opposition support for the Liberal Democrats in 2005 who moved into second place, meanwhile a local independent pushed Yousuf Miah, a Conservative into fourth position. Following controversy regarding outgoing Labour MP Kitty Ussher's personal expenses, Gordon Birtwistle, who first contended the seat in 1992, gained the seat in 2010 with a heavy swing of 9.6%.
However, Birtwistle was one of the many casualties faced by the Liberal Democrats in the 2015 election, losing the seat to Julie Cooper, who had also stood as Labour's candidate in 2010, although the 6.2% swing away from Birtwistle was less than half the 15.2% national swing against his party. As in 2005, the Conservatives came fourth, behind UKIP as well as Labour and the Lib Dems this time.
The review of parliamentary representation in Lancashire by the Boundary Commission for England in the 2000s proposed no change to the boundaries of the Burnley seat. The seat remains coterminous with the boundaries of the borough of Burnley.[4]
Members of Parliament
Elections
Elections in the 2010s
| Party | Candidate | Votes | % | ± | |
|---|---|---|---|---|---|
| Labour | Julie Cooper | 14,951 | 37.6 | +6.3 | |
| Liberal Democrat | Gordon Birtwistle | 11,707 | 29.5 | −6.2 | |
| UKIP | Tom Commis | 6,864 | 17.3 | +15.0 | |
| Conservative | Sarah Cockburn-Price | 5,374 | 13.5 | −3.1 | |
| Green | Mike Hargreaves | 850 | 2.1 | N/A | |
| Majority | 3,244 | 8.2 | |||
| Turnout | 39,746 | 61.6 | |||
| Labour gain from Liberal Democrat | Swing | +6.3 | |||
| Party | Candidate | Votes | % | ± | |
|---|---|---|---|---|---|
| Liberal Democrat | Gordon Birtwistle | 14,932 | 35.7 | +12.0 | |
| Labour | Julie Cooper | 13,114 | 31.3 | −7.2 | |
| Conservative | Richard Ali | 6,950 | 16.6 | +5.8 | |
| BNP | Sharon Wilkinson | 3,747 | 9.0 | −1.3 | |
| Independent | Andrew Brown | 1,876 | 4.5 | N/A | |
| UKIP | John Wignall | 929 | 2.2 | +1.2 | |
| Independent | Andrew Hennessey | 287 | 0.7 | N/A | |
| Majority | 1,818 | 4.3 | |||
| Turnout | 41,845 | 62.8 | |||
| Liberal Democrat gain from Labour | Swing | +9.6 | |||
Elections in the 2000s
| Party | Candidate | Votes | % | ± | |
|---|---|---|---|---|---|
| Labour | Kitty Ussher | 14,999 | 38.5 | −10.8 | |
| Liberal Democrat | Gordon Birtwistle | 9,221 | 23.7 | +7.5 | |
| Burnley First Independent | Harry Brooks | 5,786 | 14.8 | N/A | |
| Conservative | Yousuf Miah | 4,206 | 10.8 | −10.1 | |
| BNP | Len Starr | 4,003 | 10.3 | −1.0 | |
| Independent | Jeff Slater | 392 | 1.0 | N/A | |
| UKIP | Robert McDowell | 376 | 1.0 | −1.3 | |
| Majority | 5,778 | 14.8 | |||
| Turnout | 38,983 | 59.2 | +3.5 | ||
| Labour hold | Swing | −9.15[n 3] | |||
| Party | Candidate | Votes | % | ± | |
|---|---|---|---|---|---|
| Labour | Peter Pike | 18,195 | 49.3 | −8.6 | |
| Conservative | Robert Frost | 7,697 | 20.9 | +0.6 | |
| Liberal Democrat | Paul Wright | 5,975 | 16.2 | −1.2 | |
| BNP | Steve Smith | 4,151 | 11.3 | N/A | |
| UKIP | Richard Buttrey | 866 | 2.3 | N/A | |
| Majority | 10,498 | 28.4 | |||
| Turnout | 36,884 | 55.7 | −11.3 | ||
| Labour hold | Swing | −4.6 | |||
Elections in the 1990s
| Party | Candidate | Votes | % | ± | |
|---|---|---|---|---|---|
| Labour | Peter Pike | 26,210 | 57.9 | +4.9 | |
| Conservative | Bill Wiggin | 9,148 | 20.2 | −10.4 | |
| Liberal Democrat | Gordon Birtwistle | 7,877 | 17.4 | +1.0 | |
| Referendum | Richard Oakley | 2,010 | 4.4 | N/A | |
| Majority | 17,062 | 37.7 | |||
| Turnout | 45,245 | 66.9 | −7.5 | ||
| Labour hold | Swing | +7.65 | |||
| Party | Candidate | Votes | % | ± | |
|---|---|---|---|---|---|
| Labour | Peter Pike | 27,184 | 53.0 | +4.6 | |
| Conservative | Mrs. Brenda Binge | 15,693 | 30.6 | −3.2 | |
| Liberal Democrat | Gordon Birtwistle | 8,414 | 16.4 | −1.4 | |
| Majority | 11,491 | 22.4 | +7.9 | ||
| Turnout | 51,291 | 74.2 | −4.6 | ||
| Labour hold | Swing | +3.9 | |||
Elections in the 1980s
| Party | Candidate | Votes | % | ± | |
|---|---|---|---|---|---|
| Labour | Peter Pike | 25,140 | 48.4 | +8.6 | |
| Conservative | Harold Elletson | 17,583 | 33.8 | −4.4 | |
| Social Democratic | Ronals Hubert Baker | 9,241 | 17.8 | −2.2 | |
| Majority | 7,557 | 14.5 | |||
| Turnout | 51,964 | 78.8 | |||
| Labour hold | Swing | +6.5 | |||
| Party | Candidate | Votes | % | ± | |
|---|---|---|---|---|---|
| Labour | Peter Pike | 20,178 | 39.8 | −11.0 | |
| Conservative | Ian Bruce | 19,391 | 38.2 | +2.8 | |
| Liberal | Michael Steed | 11,191 | 20.0 | +7.2 | |
| Majority | 787 | 1.6 | |||
| Turnout | 50,760 | 76.3 | |||
| Labour hold | Swing | −6.9 | |||
Elections in the 1970s
| Party | Candidate | Votes | % | ± | |
|---|---|---|---|---|---|
| Labour | Daniel Jones | 20,172 | 50.8 | −4.0 | |
| Conservative | Ann Widdecombe | 14,062 | 35.4 | +8.7 | |
| Liberal | Michael Steed | 5,091 | 12.8 | ||
| Independent Democrat | F Tyrrall | 352 | 0.9 | ||
| Majority | 6,110 | 15.4 | |||
| Turnout | |||||
| Labour hold | Swing | ||||
| Party | Candidate | Votes | % | ± | |
|---|---|---|---|---|---|
| Labour | Daniel Jones | 21,642 | 54.8 | ||
| Conservative | A Pickup | 9,766 | 24.7 | ||
| Liberal | SP Mews | 8,119 | 20.5 | ||
| Majority | 11,876 | 30.1 | |||
| Turnout | 79.7 | ||||
| Labour hold | Swing | ||||
| Party | Candidate | Votes | % | ± | |
|---|---|---|---|---|---|
| Labour | Daniel Jones | 21,108 | 50.4 | ||
| Conservative | A. Pickup | 11,268 | 27.0 | ||
| Liberal | S. Mews | 9,471 | 22.6 | ||
| Majority | 9,840 | 23.5 | |||
| Turnout | 79.7 | ||||
| Labour hold | Swing | ||||
| Party | Candidate | Votes | % | ± | |
|---|---|---|---|---|---|
| Labour | Daniel Jones | 24,200 | 57.0 | ||
| Conservative | J Birch | 14,846 | 34.9 | ||
| Liberal | G Brownbill | 3,446 | 8.11 | ||
| Majority | 9,354 | 22.0 | |||
| Turnout | 75.7 | ||||
| Labour hold | Swing | ||||
Elections in the 1960s
| Party | Candidate | Votes | % | ± | |
|---|---|---|---|---|---|
| Labour | Daniel Jones | 25,583 | 60.43 | ||
| Conservative | Albert S. Royse | 11,710 | 27.66 | ||
| Liberal | Miss Mary R. Mason | 5,045 | 11.92 | ||
| Majority | 13,873 | 32.77 | |||
| Turnout | 79.96 | ||||
| Labour hold | Swing | ||||
| Party | Candidate | Votes | % | ± | |
|---|---|---|---|---|---|
| Labour | Daniel Jones | 25,244 | 56.80 | ||
| Conservative | T. Mitchell | 12,365 | 27.82 | ||
| Liberal | M.R. Mason | 6,833 | 15.38 | ||
| Majority | 12,879 | 28.98 | |||
| Turnout | 81.68 | ||||
| Labour hold | Swing | ||||
Elections in the 1950s
| Party | Candidate | Votes | % | ± | |
|---|---|---|---|---|---|
| Labour | Daniel Jones | 27,675 | 56.97 | ||
| Conservative | E. Brooks | 20,902 | 43.03 | ||
| Majority | 6,773 | 13.94 | |||
| Turnout | 83.77 | ||||
| Labour hold | Swing | ||||
| Party | Candidate | Votes | % | ± | |
|---|---|---|---|---|---|
| Labour | Wilfrid Andrew Burke | 27,865 | 55.63 | ||
| Conservative | E. Brooks | 22,229 | 44.37 | ||
| Majority | 5,636 | 11.25 | |||
| Turnout | 83.46 | ||||
| Labour hold | Swing | ||||
| Party | Candidate | Votes | % | ± | |
|---|---|---|---|---|---|
| Labour | Wilfrid Andrew Burke | 31,261 | 56.53 | ||
| Conservative | D.P. Dunkley | 24,034 | 43.37 | ||
| Majority | 7,227 | 13.07 | |||
| Turnout | 88.86 | ||||
| Labour hold | Swing | ||||
| Party | Candidate | Votes | % | ± | |
|---|---|---|---|---|---|
| Labour | Wilfrid Andrew Burke | 30,685 | 55.65 | ||
| Conservative | F.H. Wilson | 23,636 | 42.86 | ||
| Communist | W. Whitaker | 526 | 0.95 | ||
| Ind. Labour Party | D. Carradice | 295 | 0.53 | ||
| Majority | 7,049 | 12.78 | |||
| Turnout | 89.56 | ||||
| Labour hold | Swing | ||||
Election in the 1940s
| Party | Candidate | Votes | % | ± | |
|---|---|---|---|---|---|
| Labour | Wilfrid Andrew Burke | 32,122 | 63.54 | ||
| Liberal National | H.M. Milnes | 18,431 | 36.46 | ||
| Majority | 13,691 | 27.08 | |||
| Turnout | 80.44 | ||||
| Labour hold | Swing | ||||
Elections in the 1930s
| Party | Candidate | Votes | % | ± | |
|---|---|---|---|---|---|
| Labour | Wilfrid Andrew Burke | 31,160 | 53.61 | ||
| Liberal National | Gordon Campbell | 26,965 | 46.39 | ||
| Majority | 4,195 | 7.22 | |||
| Turnout | 87.36 | ||||
| Labour gain from Liberal National | Swing | ||||
| Party | Candidate | Votes | % | ± | |
|---|---|---|---|---|---|
| Liberal National | Gordon Campbell | 35,126 | 56.15 | ||
| Labour | Rt Hon. Arthur Henderson | 26,917 | 43.03 | ||
| Communist | J. Rushton | 512 | 0.82 | ||
| Majority | 8,209 | 13.12 | |||
| Turnout | 91.85 | ||||
| Liberal National gain from Labour | Swing | ||||
Elections in the 1920s
| Party | Candidate | Votes | % | ± | |
|---|---|---|---|---|---|
| Labour | Rt Hon. Arthur Henderson | 28,091 | 46.2 | ||
| Unionist | Stephen Ian Fairbairn | 20,137 | 33.2 | ||
| Liberal | Aneurin John Glyn Edwards | 12,502 | 20.6 | ||
| Majority | 7,954 | 13.0 | |||
| Turnout | 60,730 | ||||
| Labour hold | Swing | ||||
| Party | Candidate | Votes | % | ± | |
|---|---|---|---|---|---|
| Labour | Rt Hon. Arthur Henderson | 24,571 | 58.4 | ||
| Conservative | Harold Edward Joscelyn Camps | 17,534 | 41.6 | ||
| Majority | 7,037 | ||||
| Turnout | |||||
| Labour hold | Swing | ||||
| Party | Candidate | Votes | % | ± | |
|---|---|---|---|---|---|
| Labour | David Daniel Irving | 16,848 | 37.8 | -1.3 | |
| Unionist | Harold Edward Joscelyn Camps | 14,197 | 31.8 | -1.3 | |
| Liberal | James Whitehead | 13,543 | 30.4 | +2.6 | |
| Majority | 2,651 | 6.0 | 0.0 | ||
| Turnout | 87.3 | ||||
| Labour hold | Swing | 0.0 | |||
Elections in the 1910s
| Party | Candidate | Votes | % | ± | |
|---|---|---|---|---|---|
| Labour | David Daniel Irving | 15,217 | 41.9 | +18.1 | |
| Unionist | Henry George Hill Mulholland | 12,289 | 33.8 | -3.7 | |
| Liberal | John Howarth Grey | 8,825 | 24.3 | -14.3 | |
| Majority | 2,928 | 8.1 | |||
| Turnout | 71.4 | ||||
| Labour gain from Liberal | Swing | +16.2 | |||

| Party | Candidate | Votes | % | ± | |
|---|---|---|---|---|---|
| Liberal | Philip Edward Morrell | 6,177 | 38.6 | +4.0 | |
| Conservative | Gerald Archibald Arbuthnot | 6,004 | 37.5 | +2.3 | |
| Social Democratic Federation | Henry Mayers Hyndman | 3,810 | 23.8 | -6.4 | |
| Majority | |||||
| Turnout | |||||
| Liberal hold | Swing | +0.9 | |||

| Party | Candidate | Votes | % | ± | |
|---|---|---|---|---|---|
| Conservative | Gerald Archibald Arbuthnot | 5,776 | 35.2 | ||
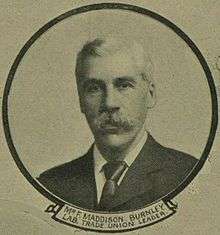
| Liberal | Frederick Maddison | 5,681 | 34.6 | ||
| Social Democratic Federation | Henry Mayers Hyndman | 4,948 | 30.2 | ||
| Majority | 95 | ||||
| Turnout | 16,405 | ||||
| Conservative gain from Liberal | Swing | ||||
Elections in the 1900s
| Party | Candidate | Votes | % | ± | |
|---|---|---|---|---|---|
| Liberal | Frederick Maddison | 5,288 | |||
| Conservative | Gerald Archibald Arbuthnot | 4,964 | |||
| Social Democratic Federation | Henry Mayers Hyndman | 4,932 | |||
| Majority | 324 | ||||
| Turnout | |||||
| Lib-Lab gain from Conservative | Swing | ||||
| Party | Candidate | Votes | % | ± | |
|---|---|---|---|---|---|
| Conservative | William Mitchell | 6,678 | |||
| Liberal | Philip James Stanhope | 6,173 | |||
| Majority | |||||
| Turnout | |||||
| Conservative gain from Liberal | Swing | ||||
Elections in the 1890s
| Party | Candidate | Votes | % | ± | |
|---|---|---|---|---|---|
| Liberal | Philip James Stanhope | 5,454 | |||
| Conservative | W. A. Lindsay | 5,133 | |||
| Social Democratic Federation | Henry Mayers Hyndman | 1,498 | |||
| Majority | 321 | ||||
| Turnout | |||||
| Liberal gain from Conservative | Swing | ||||
| Party | Candidate | Votes | % | ± | |
|---|---|---|---|---|---|
| Liberal | Philip James Stanhope | 6,199 | |||
| Conservative | W. A. Lindsay | 5,506 | |||
| Majority | |||||
| Turnout | |||||
| Liberal hold | Swing | ||||
| Party | Candidate | Votes | % | ± | |
|---|---|---|---|---|---|
| Liberal | Jabez Balfour | 6,450 | |||
| Liberal Unionist | Edwin Lawrence | 5,035 | |||
| Majority | 1,415 | ||||
| Turnout | |||||
| Liberal gain from Liberal Unionist | Swing | ||||
Elections in the 1880s
At the Burnley by-election, 1889, Jabez Balfour was elected unopposed.[20]
| Party | Candidate | Votes | % | ± | |
|---|---|---|---|---|---|
| Liberal | John Slagg | 5,021 | |||
| Conservative | J. O. S. Thursby | 4,481 | |||
| Social Democratic Federation | Henry Mayers Hyndman | 1,498 | 12.4 | ||
| Majority | 540 | ||||
| Turnout | |||||
| Liberal gain from Liberal Unionist | Swing | ||||
| Party | Candidate | Votes | % | ± | |
|---|---|---|---|---|---|
| Liberal Unionist | Peter Rylands | 4,209 | |||
| Liberal | J. Greenwood | 5,035 | |||
| Majority | |||||
| Turnout | |||||
| Liberal Unionist gain from Liberal | Swing | ||||
| Party | Candidate | Votes | % | ± | |
|---|---|---|---|---|---|
| Liberal | Peter Rylands | 4,866 | |||
| Conservative | Henry Herbert Wainwright | 5,035 | |||
| Majority | |||||
| Turnout | |||||
| Liberal hold | Swing | ||||
Elections in the 1870s
| Party | Candidate | Votes | % | ± | |
|---|---|---|---|---|---|
| Liberal | Peter Rylands | 3,520 | |||
| Conservative | Mr. Lindsay | 3,077 | |||
| Majority | 433 | ||||
| Turnout | |||||
| Liberal hold | Swing | ||||
See also
Notes and references
- Notes
- ↑ A borough constituency (for the purposes of election expenses and type of returning officer)
- ↑ As with all constituencies, the constituency elects one Member of Parliament (MP) by the first past the post system of election at least every five years.
- ↑ Labour to Liberal Democrat
- References
- ↑ "Burnley: Usual Resident Population, 2011". Neighbourhood Statistics. Office for National Statistics. Retrieved 7 February 2015.
- ↑ "Electorate Figures - Boundary Commission for England". 2011 Electorate Figures. Boundary Commission for England. 4 March 2011. Archived from the original on 6 November 2010. Retrieved 13 March 2011.
- ↑ "VOTE 2001 | RESULTS & CONSTITUENCIES | Burnley". BBC News. Retrieved 2010-06-08.
- ↑ Boundary Commission for England Fifth Periodical Report. Retrieved 31 October 2007.
- ↑ "Burnley 1868-". Hansard 1803-2005. UK Parliament. Retrieved 2 February 2015.
- ↑ Leigh Rayment's Historical List of MPs – Constituencies beginning with "B" (part 6)
- ↑ "Election Data 2015". Electoral Calculus. Archived from the original on 17 October 2015. Retrieved 17 October 2015.
- ↑ "Burnley". BBC News. Retrieved 11 May 2015.
- ↑ "Election Data 2010". Electoral Calculus. Archived from the original on 26 July 2013. Retrieved 17 October 2015.
- ↑ "Election 2010 | Constituency | Burnley". BBC News. Retrieved 2010-06-08.
- ↑ "Election Data 2005". Electoral Calculus. Archived from the original on 15 October 2011. Retrieved 18 October 2015.
- ↑ "Election Data 2001". Electoral Calculus. Archived from the original on 15 October 2011. Retrieved 18 October 2015.
- ↑ "Election Data 1997". Electoral Calculus. Archived from the original on 15 October 2011. Retrieved 18 October 2015.
- ↑ "Election Data 1992". Electoral Calculus. Archived from the original on 15 October 2011. Retrieved 18 October 2015.
- ↑ "UK General Election results April 1992". Richard Kimber's Political Science Resources. Politics Resources. 9 April 1992. Retrieved 2010-12-06.
- ↑ "Election Data 1987". Electoral Calculus. Archived from the original on 15 October 2011. Retrieved 18 October 2015.
- ↑ "Election Data 1983". Electoral Calculus. Archived from the original on 15 October 2011. Retrieved 18 October 2015.
- 1 2 British Parliamentary Election Results 1918-1949, FWS Craig
- ↑ http://trove.nla.gov.au/ndp/del/article/64216744
- 1 2 3 4 5 6 7 8 9 10 The Constitutional Year Book, National Unionist Association of Conservative and Liberal Unionist Organizations (1916)
- ↑ Debrett's House of Commons & Judicial Bench, 1886
- ↑ "Burnley Election". Sheffield Daily Telegraph. 14 February 1876. Retrieved 5 October 2016 – via British Newspaper Archive. (subscription required (help)).
External links
- nomis Constituency Profile for Burnley — presenting data from the ONS annual population survey and other official statistics.