Sunderland South (UK Parliament constituency)
Coordinates: 54°53′24″N 1°22′41″W / 54.890°N 1.378°W
| Sunderland South | |
|---|---|
|
Former Borough constituency for the House of Commons | |
|
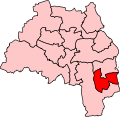
Boundary of Sunderland South in Tyne and Wear for the 2005 general election. | |
|
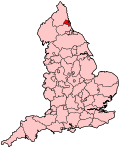
Location of Tyne and Wear within England. | |
| County | Tyne and Wear |
| 1950–2010 | |
| Number of members | One |
| Replaced by | Houghton and Sunderland South, Sunderland Central |
Sunderland South was, from 1950 until 2010, a constituency represented in the House of Commons of the Parliament of the United Kingdom. It elected one Member of Parliament (MP) by the first past the post system of election.
The constituency was well known for trying to be the first seat to declare its results, doing so in the general elections of 1992, 1997, 2001 and 2005.[1]
History
Having been a Labour-Conservative marginal in the 1950s and 60s, Sunderland South was held by the Labour Party from 1964 until 2010, being represented by the politician and author Chris Mullin from 1987 until its abolition in 2010. Mullin did not contest the 2010 general election.
The constituency was well known for trying to be the first seat to declare its results, doing so in the general elections of 1992, 1997, 2001, 2005[1] and 2015.
Boundaries
1950-1955: The County Borough of Sunderland wards of Bishopwearmouth, Hendon, Humbledon, Pallion, Park, St Michael's, Sunderland East, Thornhill, and West.
1955-1974: The County Borough of Sunderland wards of Bishopwearmouth, Hendon, Humbledon, Pallion, Park, Pennywell, St Michael's, Thorney Close, and Thornhill.
1974-1983: The County Borough of Sunderland wards of Bishopwearmouth, Hendon, Humbledon, Pennywell, Ryhope, St Chad's, St Michael's, Silksworth, Thorney Close, and Thornhill.
1983-1997: The Metropolitan Borough of Sunderland wards of Grindon, Hendon, Ryhope, St Chad's, St Michael's, Silksworth, Thorney Close, and Thornholme.
1997-2010: The City of Sunderland wards of Grindon, Hendon, St Chad's, St Michael's, Silksworth, South Hylton, Thorney Close, and Thornholme.
The constituency, as can be inferred from the name, formed the southern part of the City of Sunderland.
Boundary review
Following their review of parliamentary representation in Tyne and Wear, the Boundary Commission for England divided Sunderland South between two new constituencies, Houghton and Sunderland South and Sunderland Central. These new constituencies were first contested in 2010.
Members of Parliament
| Election | Member[2] | Party | |
|---|---|---|---|
| 1950 | Richard Ewart | Labour | |
| 1953 | Paul Williams | Conservative | |
| 1964 | Gordon Bagier | Labour | |
| 1987 | Chris Mullin | Labour | |
| 2010 | constituency abolished: see Houghton and Sunderland South & Sunderland Central | ||
Elections
Elections in the 1950s
| Party | Candidate | Votes | % | ± | |
|---|---|---|---|---|---|
| Labour | Richard Ewart | 27,192 | 49.6 | N/A | |
| Conservative | H. Wilkinson | 22,012 | 40.2 | N/A | |
| Liberal | Charles Jonathan Kitchell | 5,604 | 10.2 | N/A | |
| Majority | 5,180 | 9.5 | N/A | ||
| Turnout | 54,808 | 83.3 | N/A | ||
| Labour win (new seat) | |||||
| Party | Candidate | Votes | % | ± | |
|---|---|---|---|---|---|
| Labour | Richard Ewart | 27,257 | 50.3 | +0.7 | |
| Conservative | Paul Glyn Williams | 26,951 | 49.7 | +9.5 | |
| Majority | 306 | 0.6 | |||
| Turnout | 54,208 | 94.1 | |||
| Labour hold | Swing | ||||
| Party | Candidate | Votes | % | ± | |
|---|---|---|---|---|---|
| Conservative | Paul Glyn Williams | 23,114 | 48.6 | −1.1 | |
| Labour | Alexander G.S. Whipp | 21,939 | 46.1 | −4.2 | |
| Liberal | Roy Francis Leslie | 2,524 | 5.3 | N/A | |
| Majority | 1,175 | 2.5 | |||
| Turnout | 47,557 | ||||
| Conservative gain from Labour | Swing | ||||
| Party | Candidate | Votes | % | ± | |
|---|---|---|---|---|---|
| Conservative | Paul Glyn Williams | 24,727 | 51.9 | ||
| Labour | Ernest Armstrong | 22,953 | 48.1 | ||
| Majority | 1,774 | 3.7 | |||
| Turnout | 77.4 | ||||
| Conservative hold | Swing | ||||
| Party | Candidate | Votes | % | ± | |
|---|---|---|---|---|---|
| Conservative | Paul Glyn Williams | 27,825 | 50.9 | ||
| Labour | Ernest Armstrong | 26,835 | 49.1 | ||
| Majority | 990 | 1.8 | |||
| Turnout | 80.3 | ||||
| Conservative hold | Swing | ||||
Elections in the 1960s
| Party | Candidate | Votes | % | ± | |
|---|---|---|---|---|---|
| Labour | Gordon Alexander Thomas Bagier | 25,900 | 51.6 | ||
| Conservative | Paul Glyn Williams | 24,334 | 48.4 | ||
| Majority | 1,566 | 3.1 | |||
| Turnout | 50,234 | 75.8 | |||
| Labour gain from Conservative | Swing | ||||
| Party | Candidate | Votes | % | ± | |
|---|---|---|---|---|---|
| Labour | Gordon Alexander Thomas Bagier | 27,567 | 57.5 | ||
| Conservative | Philip Edwin Heselton | 20,398 | 42.5 | ||
| Majority | 7,169 | 15.0 | |||
| Turnout | 47,965 | 75.5 | |||
| Labour hold | Swing | ||||
Elections in the 1970s
| Party | Candidate | Votes | % | ± | |
|---|---|---|---|---|---|
| Labour | Gordon Alexander Thomas Bagier | 26,840 | 56.4 | ||
| Conservative | Denis Alan Orde | 20,722 | 43.6 | ||
| Majority | 6,118 | 12.9 | |||
| Turnout | 47,562 | 70.1 | |||
| Labour hold | Swing | ||||
| Party | Candidate | Votes | % | ± | |
|---|---|---|---|---|---|
| Labour | Gordon Alexander Thomas Bagier | 28,296 | 49.6 | ||
| Conservative | Mark Thorpe Wright | 19,700 | 34.5 | ||
| Liberal | Wilfred John Nicholson | 9,098 | 15.9 | N/A | |
| Majority | 8,596 | 15.1 | |||
| Turnout | 57,094 | 75.2 | |||
| Labour hold | Swing | ||||
| Party | Candidate | Votes | % | ± | |
|---|---|---|---|---|---|
| Labour | Gordon Alexander Thomas Bagier | 28,623 | 55.0 | +5.4 | |
| Conservative | John Charles Buchanan Riddell | 15,593 | 30.0 | −4.5 | |
| Liberal | Wilfred John Nicholson | 7,828 | 15.0 | −0.9 | |
| Majority | 13,030 | 25.0 | |||
| Turnout | 52,044 | 68.1 | |||
| Labour hold | Swing | ||||
| Party | Candidate | Votes | % | ± | |
|---|---|---|---|---|---|
| Labour | Gordon Alexander Thomas Bagier | 29,403 | 53.1 | −1.9 | |
| Conservative | James Richard Harris | 21,002 | 37.9 | +7.9 | |
| Liberal | Paul Macdonald Barker | 4,984 | 9.0 | −6.0 | |
| Majority | 8,401 | 15.2 | |||
| Turnout | 55,389 | 70.0 | |||
| Labour hold | Swing | −4.9 | |||
Elections in the 1980s
| Party | Candidate | Votes | % | ± | |
|---|---|---|---|---|---|
| Labour | Gordon Alexander Thomas Bagier | 22,869 | 45.7 | −7.4 | |
| Conservative | Andrew John Bower Mitchell | 17,321 | 34.6 | −3.3 | |
| Social Democratic | John Robert Anderson | 9,865 | 19.7 | ||
| Majority | 5,548 | 11.1 | |||
| Turnout | 50,055 | 66.6 | |||
| Labour hold | Swing | ||||
| Party | Candidate | Votes | % | ± | |
|---|---|---|---|---|---|
| Labour | Christopher John Mullin | 28,823 | 54.0 | +8.3 | |
| Conservative | George Edward Howe | 16,210 | 30.4 | −4.2 | |
| Social Democratic | Keith Howard Hudson | 7,768 | 14.6 | −5.1 | |
| Green | Douglas Neil Jacques | 516 | 1.0 | N/A | |
| Majority | 12,613 | 23.7 | |||
| Turnout | 53,317 | 71.1 | |||
| Labour hold | Swing | +6.3 | |||
Elections in the 1990s
| Party | Candidate | Votes | % | ± | |
|---|---|---|---|---|---|
| Labour | Christopher John Mullin | 29,399 | 57.9 | +3.9 | |
| Conservative | George Edward Howe | 14,898 | 29.4 | −1.0 | |
| Liberal Democrat | John Anthony Lennox | 5,844 | 11.5 | −3.1 | |
| Green | Terence Scouler | 596 | 1.2 | +0.2 | |
| Majority | 14,501 | 28.6 | +4.9 | ||
| Turnout | 50,737 | 69.9 | −1.3 | ||
| Labour hold | Swing | +2.5 | |||
| Party | Candidate | Votes | % | ± | |
|---|---|---|---|---|---|
| Labour | Christopher John Mullin | 27,174 | 68.1 | +10.2 | |
| Conservative | Timothy John Schofield | 7,536 | 18.9 | −10.5 | |
| Liberal Democrat | John Anthony Lennox | 4,606 | 11.5 | +0.0 | |
| UKIP | Margaret Anne Mcquillan Wilkinson | 609 | 1.5 | N/A | |
| Majority | 19,638 | 49.2 | |||
| Turnout | 39,925 | 58.8 | −11.1 | ||
| Labour hold | Swing | +10.4 | |||
Elections in the 2000s
| Party | Candidate | Votes | % | ± | |
|---|---|---|---|---|---|
| Labour | Christopher John Mullin | 19,921 | 63.9 | −4.2 | |
| Conservative | James William Murdoch Boyd | 6,254 | 20.1 | +1.2 | |
| Liberal Democrat | Mark Greenfield | 3,675 | 11.8 | +0.2 | |
| BNP | Joseph Dobbie | 576 | 1.8 | N/A | |
| UKIP | Joseph Duncan Moore | 470 | 1.5 | N/A | |
| Monster Raving Loony | Rosalyn Warner | 291 | 0.9 | N/A | |
| Majority | 13,667 | 43.8 | |||
| Turnout | 31,187 | 48.3 | −10.5 | ||
| Labour hold | Swing | −2.7 | |||
| Party | Candidate | Votes | % | ± | |
|---|---|---|---|---|---|
| Labour | Christopher John Mullin | 17,982 | 58.6 | −5.3 | |
| Conservative | Robert Geoffrey Oliver | 6,923 | 22.5 | +2.4 | |
| Liberal Democrat | Gareth Kane | 4,492 | 14.6 | +2.8 | |
| BNP | David Edward Guynan | 1,166 | 3.8 | +2.0 | |
| Monster Raving Loony | Rosalyn Warner | 149 | 0.5 | −0.4 | |
| Majority | 11,059 | 36.0 | |||
| Turnout | 30,712 | 49.3 | −1.5 | ||
| Labour hold | Swing | −3.9 | |||
See also
Notes and references
- 1 2 Daily Record; May 6, 2005; Sunderland Leads the Way
- ↑ Leigh Rayment's Historical List of MPs – Constituencies beginning with "S" (part 6)
- ↑ "Politics Resources". Election 1992. Politics Resources. 9 April 1992. Retrieved 6 Dec 2010.
- ↑ "Sunderland South". politicsresources.net.