Total dissolved solids

Total dissolved solids (TDS) is a measure of the combined content of all inorganic and organic substances contained in a liquid in molecular, ionized or micro-granular (colloidal sol) suspended form. Generally the operational definition is that the solids must be small enough to survive filtration through a filter with two-micrometer (nominal size, or smaller) pores. Total dissolved solids are normally discussed only for freshwater systems, as salinity includes some of the ions constituting the definition of TDS. The principal application of TDS is in the study of water quality for streams, rivers and lakes, although TDS is not generally considered a primary pollutant (e.g. it is not deemed to be associated with health effects) it is used as an indication of aesthetic characteristics of drinking water and as an aggregate indicator of the presence of a broad array of chemical contaminants.
Primary sources for TDS in receiving waters are agricultural and residential runoff, clay rich mountain waters, leaching of soil contamination and point source water pollution discharge from industrial or sewage treatment plants. The most common chemical constituents are calcium, phosphates, nitrates, sodium, potassium and chloride, which are found in nutrient runoff, general stormwater runoff and runoff from snowy climates where road de-icing salts are applied. The chemicals may be cations, anions, molecules or agglomerations on the order of one thousand or fewer molecules, so long as a soluble micro-granule is formed. More exotic and harmful elements of TDS are pesticides arising from surface runoff. Certain naturally occurring total dissolved solids arise from the weathering and dissolution of rocks and soils. The United States has established a secondary water quality standard of 500 mg/l to provide for palatability of drinking water.
Total dissolved solids are differentiated from total suspended solids (TSS), in that the latter cannot pass through a sieve of two micrometers and yet are indefinitely suspended in solution. The term "settleable solids" refers to material of any size that will not remain suspended or dissolved in a holding tank not subject to motion, and excludes both TDS and TSS.[1] Settleable solids may include larger particulate matter or insoluble molecules.
Measurement
The two principal methods of measuring total dissolved solids are gravimetric analysis and conductivity.[2] Gravimetric methods are the most accurate and involve evaporating the liquid solvent and measuring the mass of residues left. This method is generally the best, although it is time-consuming. If inorganic salts comprise the great majority of TDS, gravimetric methods are appropriate.
Electrical conductivity of water is directly related to the concentration of dissolved ionized solids in the water. Ions from the dissolved solids in water create the ability for that water to conduct an electric current, which can be measured using a conventional conductivity meter or TDS meter. When correlated with laboratory TDS measurements, conductivity provides an approximate value for the TDS concentration, usually to within ten-percent accuracy.
The relationship of TDS and specific conductance of groundwater can be approximated by the following equation:
- TDS = keEC
where TDS is expressed in mg/L and EC is the electrical conductivity in microsiemens per centimeter at 25 °C. The correlation factor ke varies between 0.55 and 0.8.[3]
Hydrological simulation

Hydrologic transport models are used to mathematically analyze movement of TDS within river systems. The most common models address surface runoff, allowing variation in land use type, topography, soil type, vegetative cover, precipitation, and land management practice (e.g. the application rate of a fertilizer). Runoff models have evolved to a good degree of accuracy and permit the evaluation of alternative land management practices upon impacts to stream water quality.
Basin models are used to more comprehensively evaluate total dissolved solids within a catchment basin and dynamically along various stream reaches. The DSSAM model was developed by the U.S. Environmental Protection Agency (EPA).[4] This hydrology transport model is actually based upon the pollutant-loading metric called "Total Maximum Daily Load" (TMDL), which addresses TDS and other specific chemical pollutants. The success of this model contributed to the Agency’s broadened commitment to the use of the underlying TMDL protocol in its national policy for management of many river systems in the United States.[5]
Practical implications

High levels of total dissolved solids do not correlate to hard water, as water softeners do not reduce TDS. Water softners remove magnesium and calcium ions, which cause hard water, but these ions are replaced with an equal number of sodium or potassium ions. This leaves overall TDS unchanged.[6] Hard water can cause scale buildup in pipes, valves, and filters, reducing performance and adding to system maintenance costs. These effects can be seen in aquariums, spas, swimming pools, and reverse osmosis water treatment systems. Typically, in these applications, total dissolved solids are tested frequently, and filtration membranes are checked in order to prevent adverse effects.
In the case of hydroponics and aquaculture, TDS is often monitored in order to create a water quality environment favorable for organism productivity. For freshwater oysters, trouts, and other high value seafood, highest productivity and economic returns are achieved by mimicking the TDS and pH levels of each species' native environment. For hydroponic uses, total dissolved solids is considered one of the best indices of nutrient availability for the aquatic plants being grown.
Because the threshold of acceptable aesthetic criteria for human drinking water is 500 mg/l, there is no general concern for odor, taste, and color at a level much lower than is required for harm. A number of studies have been conducted and indicate various species' reactions range from intolerance to outright toxicity due to elevated TDS. The numerical results must be interpreted cautiously, as true toxicity outcomes will relate to specific chemical constituents. Nevertheless, some numerical information is a useful guide to the nature of risks in exposing aquatic organisms or terrestrial animals to high TDS levels. Most aquatic ecosystems involving mixed fish fauna can tolerate TDS levels of 1000 mg/l.[7]

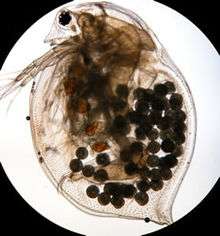
The Fathead minnow (Pimephales promelas), for example, realizes an LD50 concentration of 5600 ppm based upon a 96-hour exposure. LD50 is the concentration required to produce a lethal effect on 50 percent of the exposed population. Daphnia magna, a good example of a primary member of the food chain, is a small planktonic crustacean, about 0.5 mm in length, having an LD50 of about 10,000 ppm TDS for a 96 hour exposure.[8]
Spawning fishes and juveniles appear to be more sensitive to high TDS levels. For example, it was found that concentrations of 350 mg/l TDS reduced spawning of Striped bass (Morone saxatilis) in the San Francisco Bay-Delta region, and that concentrations below 200 mg/l promoted even healthier spawning conditions.[9] In the Truckee River, EPA found that juvenile Lahontan cutthroat trout were subject to higher mortality when exposed to thermal pollution stress combined with high total dissolved solids concentrations.[4]
For terrestrial animals, poultry typically possess a safe upper limit of TDS exposure of approximately 2900 mg/l, whereas dairy cattle are measured to have a safe upper limit of about 7100 mg/l. Research has shown that exposure to TDS is compounded in toxicity when other stressors are present, such as abnormal pH, high turbidity, or reduced dissolved oxygen with the latter stressor acting only in the case of animalia.[10]
In countries with often-unsafe/unclean tap water supplies, such as much of India, the TDS of drinking water is often checked by technicians to gauge how effectively their RO/Water Filtration devices are working. While TDS readings will not give an answer as to the amount of microorganisms present in a sample of water, they can get a good idea as to the efficiency of the filter by how much TDS is present.
Water classification
Water can be classified by the level of TDS in the water:
- Fresh water: less than 500 mg/L TDS=0.5ppt
- Brackish water: 500 to 30,000 mg/L TDS=0.5-30ppt
- Saline water: 30,000 to 40,000 mg/L TDS=30-40ppt
- Hypersaline: greater than 40,000 mg/L TDS>=40ppt
See also
References
- ↑ DeZuane, John (1997). Handbook of Drinking Water Quality (2nd ed.). John Wiley and Sons. ISBN 0-471-28789-X.
- ↑ "Total Dissolved Solids (TDS): EPA Method 160.1 (Gravimetric, Dried at 180 deg. C)". Washington, D.C.: U.S. Environmental Protection Agency (EPA). 1999-11-16.
- ↑ Atekwanaa, Eliot A.; Atekwanaa, Estella A.; Roweb, Rebecca S.; Werkema Jr., D. Dale; Legalld, Franklyn D. (2004). "The relationship of total dissolved solids measurements to bulk electrical conductivity in an aquifer contaminated with hydrocarbon" (PDF). Journal of Applied Geophysics. Elsevier. 56 (4): 281–294. doi:10.1016/j.jappgeo.2004.08.003. Retrieved 15 February 2016.
- 1 2 C.M. Hogan, Marc Papineau et al. Development of a dynamic water quality simulation model for the Truckee River, Earth Metrics Inc., Environmental Protection Agency Technology Series, Washington D.C. (1987)
- ↑ EPA. "Guidance for Water Quality-Based Decisions: The TMDL Process." Doc. No. EPA 440/4-91-001. April 1991.
- ↑ W. Adam Sigler, Jim Bauder. "TDS Fact Sheet". Montana State University. Archived from the original on 2015-04-29. Retrieved 23 January 2015.
- ↑ Boyd, Claude E. (1999). Water Quality: An Introduction. The Netherlands: Kluwer Academic Publishers Group. ISBN 0-7923-7853-9.
- ↑ Position Paper on Total Dissolved Solids, State of Iowa, IAC 567 61.3 (2)g et sequitur updated March 27, 2003
- ↑ Kaiser Engineers, California, Final Report to the State of California, San Francisco Bay-Delta Water Quality Control Program, State of California, Sacramento, CA (1969)
- ↑ Hogan, C. Michael; Patmore, Leda C.; Seidman, Harry (August 1973). "Statistical Prediction of Dynamic Thermal Equilibrium Temperatures using Standard Meteorological Data Bases". EPA. Retrieved 2016-02-15. Environmental Protection Technology Series. Document No. EPA-660/2-73-003.