Vavuniya District
| Vavuniya District வவுனியா மாவட்டம் වවුනියා දිස්ත්රික්කය | |
|---|---|
| Administrative District | |
|
| |
 Location within Sri Lanka | |
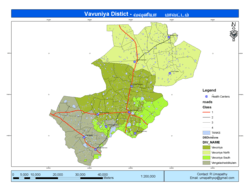
 DS and GN Divisions of Vavuniya District, 2006 | |
| Coordinates: 08°50′N 80°30′E / 8.833°N 80.500°ECoordinates: 08°50′N 80°30′E / 8.833°N 80.500°E | |
| Country | Sri Lanka |
| Province | Northern |
| Capital | Vavuniya |
| DS Division | |
| Government | |
| • District Secretary | M. K. Bandula Harischandra |
| • MPs |
List
|
| • MPCs |
List
|
| Area[1] | |
| • Total | 1,967 km2 (759 sq mi) |
| • Land | 1,861 km2 (719 sq mi) |
| • Water | 106 km2 (41 sq mi) 5.39% |
| Area rank | 15th (3.00% of total area) |
| Population (2012 census)[2] | |
| • Total | 171,511 |
| • Rank | 22nd (0.85% of total pop.) |
| • Density | 87/km2 (230/sq mi) |
| Ethnicity(2012 census)[2] | |
| • Sri Lankan Tamil | 141,269 (82.37%) |
| • Sinhalese | 17,191 (10.02%) |
| • Sri Lankan Moors | 11,700 (6.82%) |
| • Indian Tamil | 1,292 (0.75%) |
| • Other | 59 (0.03%) |
| Religion(2012 census)[3] | |
| • Hindu | 119,286 (69.55%) |
| • Christian | 22,820 (13.31%) |
| • Buddhist | 16,688 (9.73%) |
| • Muslim | 12,341 (7.20%) |
| • Other | 376 (0.22%) |
| Time zone | Sri Lanka (UTC+05:30) |
| Post Codes | 43000-43999 |
| Telephone Codes | 024 |
| ISO 3166 code | LK-44 |
| Vehicle registration | NP |
| Official Languages | Tamil, Sinhala |
| Website | Vavuniya District Secretariat |
Vavuniya District (Tamil: வவுனியா மாவட்டம் Vavuṉiyā Māvaṭṭam; Sinhalese: වවුනියා දිස්ත්රික්කය) is one of the 25 districts of Sri Lanka, the second level administrative division of the country. The district is administered by a District Secretariat headed by a District Secretary (previously known as a Government Agent) appointed by the central government of Sri Lanka. The capital of the district is the city of Vavuniya.
History
Between 5th century BC and 13th century AD present day Vavuniya District was part of Rajarata. Vavuniya District was thereafter ruled by Vanniar Chieftains who paid tribute to the pre-colonial Jaffna kingdom.[4] The district then came under Portuguese, Dutch and British control. In 1815 the British gained control of the entire island of Ceylon. They divided the island into three ethnic based administrative structures: Low Country Sinhalese, Kandyan Sinhalese and Tamil. The district, which was then called Vanni District, was part of the Tamil administration. In 1833, in accordance with the recommendations of the Colebrooke-Cameron Commission, the ethnic based administrative structures were unified into a single administration divided into five geographic provinces.[5] Vanni District, together with Jaffna District and Mannar District, formed the new Northern Province.[6]
Vanni District was later renamed Mullaitivu District and then Vavuniya District. At the time that Ceylon gained independence, Vavuniya was one of the three districts located in the Northern Province. Mullaitivu District was carved out of the northern part of Vavuniya District in September 1978.
Parts of Vavuniya District were under the control of rebel Liberation Tigers of Tamil Eelam for many years during the civil war. The entire district was recaptured by the Sri Lankan military in 2008.
Geography
Vavuniya District is located in the north of Sri Lanka in the Northern Province. It has an area of 1,967 square kilometres (759 sq mi).[1]
Administrative units
Vavuniya District is divided into 4 Divisional Secretary's Division (DS Divisions), each headed by a Divisional Secretary (previously known as an Assistant Government Agent).[7] The DS Divisions are further sub-divided into 102 Grama Niladhari Divisions (GN Divisions).[7]
| DS Division | Main Town | Divisional Secretary | GN Divisions [7] |
Area (km2) [8] |
Population (2012 Census)[9] | Population Density (/km2) | |||||
|---|---|---|---|---|---|---|---|---|---|---|---|
| Sri Lankan Tamil | Sinhalese | Sri Lankan Moors | Indian Tamil | Other | Total | ||||||
| Vavuniya | Vavuniya | K. Uthayarajah | 42 | 614 | 107,668 | 3,424 | 4,868 | 1,167 | 26 | 117,153 | 191 |
| Vavuniya North | Nedunkeni | K. Paranthaman | 20 | 745 | 10,830 | 554 | 7 | 103 | 24 | 11,518 | 15 |
| Vavuniya South | M. S. Janaka | 20 | 200 | 518 | 12,546 | 3 | 2 | 1 | 13,070 | 65 | |
| Venkalacheddikulam | Cheddikulam | N. Kamalathasan | 20 | 408 | 22,253 | 667 | 6,822 | 20 | 8 | 29,770 | 73 |
| Total | 102 | 1,967 | 141,269 | 17,191 | 11,700 | 1,292 | 59 | 171,511 | 87 | ||
Demographics
Population
Vavuniya District's population was 171,511 in 2012.[2] The population of the district is mostly Sri Lankan Tamil.
The population of the district, like the rest of the north and east of Sri Lanka, has been heavily affected by the civil war. The war killed an estimated 100,000 people.[10] Several hundred thousand Sri Lankan Tamils, possibly as much as one million, emigrated to the West during the war.[11] Many Sri Lankan Tamils also moved to the relative safety of the capital Colombo. Most of the Sri Lankan Moors and Sinhalese who lived in the district fled to other parts of Sri Lanka or were forcibly expelled by the rebel Liberation Tigers of Tamil Eelam, though most of them have returned to the district since the end of the civil war.
Ethnicity
| Year | Tamil[lower-alpha 1] | Sinhalese | Muslim[lower-alpha 2] | Other | Total No. | ||||
|---|---|---|---|---|---|---|---|---|---|
| No. | % | No. | % | No. | % | No. | % | ||
| 1881 Census | 13,164 | 84.55% | 1,157 | 7.43% | 1,133 | 7.28% | 115 | 0.74% | 15,569 |
| 1891 Census | 13,030 | 84.06% | 1,199 | 7.73% | 1,139 | 7.35% | 133 | 0.86% | 15,501 |
| 1901 Census | 12,726 | 83.95% | 1,128 | 7.44% | 1,069 | 7.05% | 236 | 1.56% | 15,159 |
| 1911 Census | 14,059 | 81.10% | 1,848 | 10.66% | 1,241 | 7.16% | 188 | 1.08% | 17,336 |
| 1921 Census | 14,978 | 80.07% | 2,215 | 11.84% | 1,345 | 7.19% | 168 | 0.90% | 18,706 |
| 1946 Census | 17,071 | 73.44% | 3,870 | 16.65% | 2,153 | 9.26% | 152 | 0.65% | 23,246 |
| 1963 Census | 51,410 | 75.05% | 12,020 | 17.55% | 4,900 | 7.15% | 170 | 0.25% | 68,500 |
| 1971 Census | 73,010 | 76.42% | 15,541 | 16.27% | 6,665 | 6.98% | 320 | 0.33% | 95,536 |
| 1981 Census | 73,133 | 76.26% | 15,876 | 16.55% | 6,640 | 6.92% | 255 | 0.27% | 95,904 |
| 1990 Estimate | n/a | n/a | n/a | n/a | n/a | n/a | n/a | n/a | 129,895 |
| 1998 Estimate | n/a | n/a | n/a | n/a | n/a | n/a | n/a | n/a | 129,655 |
| 1999 Estimate | n/a | n/a | n/a | n/a | n/a | n/a | n/a | n/a | 132,737 |
| 2000 Estimate | n/a | n/a | n/a | n/a | n/a | n/a | n/a | n/a | 145,159 |
| 2001 Estimate[lower-alpha 3] | 123,268 | 88.64% | 12,159 | 8.45% | 8,471 | 5.89% | 42 | 0.03% | 143,940 |
| 2002 Estimate | 121,635 | 84.34% | 13,196 | 9.15% | 9,389 | 6.51% | 0 | 0.00% | 144,220 |
| 2003 Estimate | 123,704 | 83.99% | 14,386 | 9.77% | 9,192 | 6.24% | 0 | 0.00% | 147,292 |
| 2004 Estimate | 127,604 | 84.43% | 14,699 | 9.73% | 8,839 | 5.85% | 0 | 0.00% | 151,142 |
| 2005 Estimate | n/a | n/a | n/a | n/a | n/a | n/a | n/a | n/a | 180,949 |
| 2006 Estimate | n/a | n/a | n/a | n/a | n/a | n/a | n/a | n/a | 182,808 |
| 2007 Estimate | 157,917 | 86.27% | 13,535 | 7.39% | 11,594 | 6.33% | 0 | 0.00% | 183,046 |
| 2008 Estimate | 152,927 | 86.67% | 13,423 | 7.61% | 10,090 | 5.72% | 0 | 0.00% | 176,440 |
| 2009 Estimate | 179,850 | 86.93% | 16,177 | 7.82% | 10,858 | 5.25% | 0 | 0.00% | 206,885 |
| 2011 Enumeration | 136,665 | 82.90% | 16,555 | 10.04% | 11,491 | 6.97% | 141 | 0.09% | 164,852 |
| 2012 Census | 142,561 | 83.12% | 17,191 | 10.02% | 11,700 | 6.82% | 59 | 0.03% | 171,511 |
Religion
| Year | Hindu | Christian[lower-alpha 4] | Buddhist | Muslim | Others | Total No. | |||||
|---|---|---|---|---|---|---|---|---|---|---|---|
| No. | % | No. | % | No. | % | No. | % | No. | % | ||
| 1981 Census | 65,574 | 68.72% | 7,338 | 7.69% | 15,754 | 16.51% | 6,740 | 7.06% | 22 | 0.02% | 95,428 |
| 2012 Census | 119,286 | 69.55% | 22,820 | 13.31% | 16,688 | 9.73% | 12,341 | 7.20% | 376 | 0.22% | 171,511 |
Politics and government
Local government
Vavuniya District has 5 local authorities of which one is an Urban Council and the remaining 4 are Divisional Councils (Pradesha Sabhai or Pradeshiya Sabha).[7]
| Local Authority | Area (km2) [7] |
Population (2011) [13] |
Registered Electors (2011)[lower-alpha 5] |
Elected Members (2011)[lower-alpha 6] | |||||
|---|---|---|---|---|---|---|---|---|---|
| TNA[lower-alpha 7] | UPFA | UNP | SLMC | Other | Total | ||||
| Vavuniya North Divisional Council | 769.60 | 10,392 | 10,955 | 8 | 4 | 1 | 0 | 0 | 13 |
| Vavuniya South Sinhala Divisional Council | 188.50 | 12,382 | 9,633 | 0 | 7 | 1 | 0 | 1 | 9 |
| Vavuniya South Tamil Divisional Council | 588.20 | 76,242 | 48,477 | 7 | 2 | 1 | 0 | 0 | 10 |
| Vavuniya Urban Council | 23.50 | 31,699 | 24,626 | 8 | 2 | 0 | 1 | 0 | 11 |
| Venkalacheddikulam Divisional Council | 412.98 | 30,609 | 18,925 | 5 | 2 | 0 | 2 | 0 | 9 |
| Total | 1,982.78 | 161,324 | 28 | 17 | 3 | 3 | 1 | 52 | |
Notes
- ↑ Sri Lankan Tamil and Indian Tamil.
- ↑ Sri Lankan Moors and Indian Moors.
- ↑ 2001 Census was not carried out in Vavuniya District.
- ↑ Roman Catholic and Other Christian.
- ↑ 2009 for Vavuniya Urban Council.
- ↑ 2009 for Vavuniya Urban Council.
- ↑ Includes DPLF.
References
- 1 2 "Area of Sri Lanka by province and district" (PDF). Statistical Abstract 2011. Department of Census & Statistics, Sri Lanka.
- 1 2 3 4 "A2 : Population by ethnic group according to districts, 2012". Census of Population & Housing, 2011. Department of Census & Statistics, Sri Lanka.
- 1 2 "A3 : Population by religion according to districts, 2012". Census of Population & Housing, 2011. Department of Census & Statistics, Sri Lanka.
- ↑ de Silva, K. M. (1981). A History of Sri Lanka. New Delhi: Oxford University Press. pp. xvii.
- ↑ Mills, Lennox A. (1933). Ceylon Under British Rule (1795 - 1932). London: Oxford University Press. pp. 67–68.
- ↑ Medis, G. C. (1946). Ceylon Under the British (2nd (revised) ed.). Colombo: The Colombo Apothecaries Co. pp. 39–40.
- 1 2 3 4 5 "Statistical Information 2012". Northern Provincial Council.
- ↑ "Land area by province, district and divisional secretariat division" (PDF). Statistical Abstract 2011. Department of Census & Statistics, Sri Lanka.
- ↑ "A6 : Population by ethnicity and district according to Divisional Secretary's Division, 2012". Census of Population & Housing, 2011. Department of Census & Statistics, Sri Lanka.
- ↑ "Up to 100,000 killed in Sri Lanka's civil war: UN". ABC News (Australia). 20 May 2009.
- ↑ Harrison, Frances (23 July 2003). "Twenty years on - riots that led to war". BBC News.
- ↑ "Statistical Information 2010" (PDF). Northern Provincial Council.
- 1 2 "Enumeration of Vital Events 2011 - Northern Province" (PDF). Department of Census & Statistics, Sri Lanka.
- ↑ "Population by religion and district, Census 1981, 2001" (PDF). Statistical Abstract 2011. Department of Census & Statistics, Sri Lanka.
External links
| Wikimedia Commons has media related to Vavuniya District. |
| ||
| History | 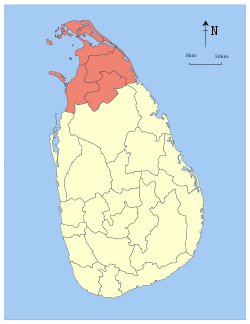 | ||||||||||||||||||
|---|---|---|---|---|---|---|---|---|---|---|---|---|---|---|---|---|---|---|---|
| Geography |
| ||||||||||||||||||
| Politics | |||||||||||||||||||
| Economy |
| ||||||||||||||||||
| Society |
| ||||||||||||||||||
| Symbols |
| ||||||||||||||||||