Virginia's 10th congressional district
| Virginia's 10th congressional district | |
|---|---|
|
Virginia's 10th congressional district - since January 3, 2013. | |
| Current Representative | Barbara Comstock (R) |
| Distribution |
|
| Population (2014) | 802,127 |
| Median income | 115,291 (2014) [1] |
| Ethnicity |
|
| Occupation | |
| Cook PVI | R+2[2] |
| Created | [[{{{created}}} United_States_Census|{{{created}}} Census]] |
| Eliminated | [[{{{eliminated}}} United_States_Census|{{{eliminated}}} Census]] |
.tif.png)
Virginia's Tenth Congressional District is a U.S. congressional district in the Commonwealth of Virginia. The 10th District is represented by Republican Congresswoman Barbara Comstock, first elected to the 10th's seat in the U.S. House of Representatives in 2014.
The district includes all of Clarke, Frederick,and Loudoun and the Independent Cities of Manassas, Manassas Park, Winchester, along with portions of Fairfax, and Prince William counties. The district closely matches Virginia's voting patterns in statewide races with nearly identical margins as the final statewide results.
According to Larry Sabato's Crystal Ball, this district has many "wealthy and highly-educated voters" as of 14 April 2016.[3]
History
The modern 10th congressional district was formed in 1952. In the 1960s it consisted of Arlington, Alexandria and most of Fairfax County.
Voting
| Election results from statewide races | ||
|---|---|---|
| Year | Office | Results |
| 1996 | President | Dole 54–38% |
| Senator | Warner 60–40% | |
| 1997 | Governor | Gilmore 62–37% |
| Lieutenant Governor | Hager 59–37% | |
| Attorney General | Earley 62–38% | |
| 2000 | President | Bush 56–41%[4] |
| Senator | Allen 59–41% | |
| 2001 | Governor | Earley 54–45% |
| Lieutenant Governor | Katzen 57–41% | |
| Attorney General | Kilgore 65–35% | |
| 2004 | President | Bush 55–44%[4] |
| 2008 | President | Obama 51–48.2%[5] |
| 2012 | President | Romney 49.9–48.8%[6] |
| 2013 | Governor | Cuccinelli 47.9-47.0%[7] |
Recent election results
1970 election
| Party | Candidate | Votes | % | |
|---|---|---|---|---|
| Republican | Joel T. Broyhill (inc.) | 67,468 | 54.53 | |
| Democratic | Harold O. Miller | 56,255 | 45.47 | |
| Total votes | 123,723 | 100.00 | ||
| Republican hold | ||||
Source:[8]
1972 election
| Party | Candidate | Votes | % | |
|---|---|---|---|---|
| Republican | Joel T. Broyhill (inc.) | 101,138 | 56.26 | |
| Democratic | Harold O. Miller | 78,638 | 43.74 | |
| Write-ins | 2 | <0.01 | ||
| Total votes | 179,778 | 100.00 | ||
| Republican hold | ||||
Source:[9]
1974 election
| Party | Candidate | Votes | % | |||
|---|---|---|---|---|---|---|
| Democratic | Joseph L. Fisher | 67,184 | 53.62 | |||
| Republican | Joel T. Broyhill (inc.) | 56,649 | 45.21 | |||
| Independent | Francis J. Speh | 1,465 | 1.17 | |||
| Write-ins | 6 | <0.01 | ||||
| Total votes | 125,304 | 100.00 | ||||
| Democratic gain from Republican | ||||||
Source:[10]
1976 election
| Party | Candidate | Votes | % | |
|---|---|---|---|---|
| Democratic | Joseph L. Fisher (inc.) | 103,689 | 54.72 | |
| Republican | Vincent F. Callahan, Jr. | 73,616 | 38.85 | |
| Independent | E. Stanley Rittenhouse | 12,124 | 6.40 | |
| Write-ins | 60 | 0.03 | ||
| Total votes | 189,489 | 100.00 | ||
| Democratic hold | ||||
Source:[11]
1978 election
| Party | Candidate | Votes | % | |
|---|---|---|---|---|
| Democratic | Joseph L. Fisher (inc.) | 70,892 | 53.35 | |
| Republican | Frank Wolf | 61,981 | 46.64 | |
| Write-ins | 9 | 0.01 | ||
| Total votes | 132,882 | 100.00 | ||
| Democratic hold | ||||
Source:[12]
1980 election
| Party | Candidate | Votes | % | |||
|---|---|---|---|---|---|---|
| Republican | Frank Wolf | 110,840 | 51.14 | |||
| Democratic | Joseph L. Fisher (inc.) | 105,883 | 48.85 | |||
| Write-ins | 21 | 0.01 | ||||
| Total votes | 216,744 | 100.00 | ||||
| Republican gain from Democratic | ||||||
Source:[13]
1982 election
| Party | Candidate | Votes | % | |
|---|---|---|---|---|
| Republican | Frank Wolf (inc.) | 86,506 | 52.74 | |
| Democratic | Ira M. Lechner | 75,361 | 45.94 | |
| Independent | Scott R. Bowden | 2,162 | 1.32 | |
| Write-ins | 6 | <0.01 | ||
| Total votes | 164,035 | 100.00 | ||
| Republican hold | ||||
Source:[14]
1984 election
| Party | Candidate | Votes | % | |
|---|---|---|---|---|
| Republican | Frank Wolf (inc.) | 158,528 | 62.50 | |
| Democratic | John P. Flannery II | 95,074 | 37.49 | |
| Write-ins | 23 | <0.01 | ||
| Total votes | 253,625 | 100.00 | ||
| Republican hold | ||||
Source:[15]
1986 election
| Party | Candidate | Votes | % | |
|---|---|---|---|---|
| Republican | Frank Wolf (inc.) | 95,724 | 60.20 | |
| Democratic | John G. Milliken | 63,292 | 39.80 | |
| Write-ins | 7 | <0.01 | ||
| Total votes | 159,023 | 100.00 | ||
| Republican hold | ||||
Source:[16]
1988 election
| Party | Candidate | Votes | % | |
|---|---|---|---|---|
| Republican | Frank Wolf (inc.) | 188,550 | 68.09 | |
| Democratic | Bob L. Weinberg | 88,284 | 31.88 | |
| Write-ins | 74 | 0.03 | ||
| Total votes | 276,908 | 100.00 | ||
| Republican hold | ||||
Source:[17]
1990 election
| Party | Candidate | Votes | % | |
|---|---|---|---|---|
| Republican | Frank Wolf (inc.) | 103,761 | 61.46 | |
| Democratic | N. MacKenzie Canter III | 57,249 | 33.91 | |
| Independent | Barbara S. Minnich | 5,273 | 3.12 | |
| Independent | Lyndon LaRouche | 2,293 | 1.36 | |
| Write-ins | 249 | 0.15 | ||
| Total votes | 168,825 | 100.00 | ||
| Republican hold | ||||
Source:[18]
1992 election
| Party | Candidate | Votes | % | |
|---|---|---|---|---|
| Republican | Frank Wolf (inc.) | 144,471 | 63.59 | |
| Democratic | Raymond E. Vickery, Jr. | 75,775 | 33.35 | |
| Independent | Alan R. Ogden | 6,874 | 3.03 | |
| Write-ins | 71 | 0.03 | ||
| Total votes | 227,191 | 100.00 | ||
| Republican hold | ||||
Source:[19]
1994 election
| Party | Candidate | Votes | % | |
|---|---|---|---|---|
| Republican | Frank Wolf (inc.) | 153,311 | 87.34 | |
| Independent | Alan R. Ogden | 13,687 | 7.80 | |
| Independent | Robert L. Rilee | 8,267 | 4.71 | |
| Write-ins | 266 | 0.15 | ||
| Total votes | 175,531 | 100.00 | ||
| Republican hold | ||||
Source:[20]
1996 election
| Party | Candidate | Votes | % | |
|---|---|---|---|---|
| Republican | Frank Wolf (inc.) | 169,266 | 72.02 | |
| Democratic | Bob L. Weinberg | 59,145 | 25.17 | |
| Independent | Gary A. Reams | 6,500 | 2.77 | |
| Write-ins | 102 | 0.04 | ||
| Total votes | 235,013 | 100.00 | ||
| Republican hold | ||||
Source:[21]
1998 election
| Party | Candidate | Votes | % | |
|---|---|---|---|---|
| Republican | Frank Wolf (inc.) | 103,648 | 71.60 | |
| Democratic | Cornell W. Brooks | 36,476 | 25.20 | |
| Independent | Robert A. Buchanan | 4,506 | 3.11 | |
| Write-ins | 125 | 0.09 | ||
| Total votes | 144,755 | 100.00 | ||
| Republican hold | ||||
Source:[22]
2000 election
| Party | Candidate | Votes | % | |
|---|---|---|---|---|
| Republican | Frank Wolf (inc.) | 238,817 | 84.20 | |
| Independent | Brian M. Brown | 28,107 | 9.91 | |
| Independent | Marc A. Rossi | 16,031 | 5.65 | |
| Write-ins | 682 | 0.24 | ||
| Total votes | 283,637 | 100.00 | ||
| Republican hold | ||||
Source:[23]
2002 election
| Party | Candidate | Votes | % | |
|---|---|---|---|---|
| Republican | Frank Wolf (inc.) | 115,917 | 71.72 | |
| Democratic | John B. Stevens, Jr. | 45,464 | 28.13 | |
| Write-ins | 234 | 0.14 | ||
| Total votes | 161,615 | 100.00 | ||
| Republican hold | ||||
Source:[24]
2004 election
| Party | Candidate | Votes | % | |
|---|---|---|---|---|
| Republican | Frank Wolf (inc.) | 205,982 | 63.77 | |
| Democratic | James R. Socas | 116,654 | 36.11 | |
| Write-ins | 375 | 0.12 | ||
| Total votes | 323,011 | 100.00 | ||
| Republican hold | ||||
Source:[25]
2006 election
| Party | Candidate | Votes | % | |
|---|---|---|---|---|
| Republican | Frank Wolf (inc.) | 138,213 | 57.32 | |
| Democratic | Judy Feder | 98,769 | 40.96 | |
| Libertarian | Wilbur N. Wood III | 2,107 | 0.87 | |
| Independent | Neeraj C. Nigam | 1,851 | 0.77 | |
| Write-ins | 194 | 0.08 | ||
| Total votes | 241,134 | 100.00 | ||
| Republican hold | ||||
Source:[26]
2008 election
| Party | Candidate | Votes | % | |
|---|---|---|---|---|
| Republican | Frank Wolf (inc.) | 223,140 | 58.80 | |
| Democratic | Judy Feder | 147,357 | 38.83 | |
| Independent | Neeraj C. Nigam | 8,457 | 2.23 | |
| Write-ins | 526 | 0.14 | ||
| Total votes | 379,480 | 100.00 | ||
| Republican hold | ||||
Source:[27]
2010 election
| Party | Candidate | Votes | % | |
|---|---|---|---|---|
| Republican | Frank Wolf (inc.) | 131,116 | 62.87 | |
| Democratic | Jeff Barnett | 72,604 | 34.81 | |
| Libertarian | Bill Redpath | 4,607 | 2.21 | |
| Write-ins | 229 | 0.11 | ||
| Total votes | 208,556 | 100.00 | ||
| Republican hold | ||||
Source:[28]
2012 election
| Party | Candidate | Votes | % | |
|---|---|---|---|---|
| Republican | Frank Wolf (inc.) | 214,038 | 58.41 | |
| Democratic | Kristin Cabral | 142,024 | 38.76 | |
| Independent | Kevin Chisholm | 9,855 | 2.69 | |
| Write-in | 527 | 0.14 | ||
| Total votes | 366,444 | 100 | ||
| Republican hold | ||||
2014 election
| Party | Candidate | Votes | % | |
|---|---|---|---|---|
| Republican | Barbara Comstock | 125,914 | 56.49 | |
| Democratic | John Foust | 89,957 | 40.36 | |
| Libertarian | Bill Redpath | 3,393 | 1.52 | |
| Independent | Brad Eickholt | 2,442 | 1.10 | |
| Independent Greens | Dianne Blais | 946 | 0.42 | |
| Write-in | 258 | 0.12 | ||
| Total votes | 222,910 | 100 | ||
| Republican hold | ||||
List of representatives
| Representative | Party | Years | Electoral history |
|---|---|---|---|
| District created: March 4, 1789 | |||
 Samuel Griffin Samuel Griffin |
Pro-Administration | March 4, 1789 – March 3, 1791 |
[Data unknown/missing. You can help!] |
| Anti-Administration | March 4, 1791 – March 3, 1793 |
Redistricted to the 13th district | |
| Carter B. Harrison | Anti-Administration | March 4, 1793 – March 3, 1795 |
[Data unknown/missing. You can help!] |
| Democratic-Republican | March 4, 1795 – March 3, 1799 |
Retired | |
| Edwin Gray | Democratic-Republican | March 4, 1799 – March 3, 1803 |
Redistricted to the 19th district |
| John Dawson | Democratic-Republican | March 4, 1803 – March 3, 1813 |
Redistricted to the 11th district |
| Aylett Hawes | Democratic-Republican | March 4, 1813 – March 3, 1817 |
Retired |
| George F. Strother | Democratic-Republican | March 4, 1817 – February 10, 1820 |
Resigned |
| Vacant | February 11, 1820 – November 12, 1820 | ||
| Thomas L. Moore | Democratic-Republican | November 13, 1820 – March 3, 1823 |
Retired |
 William C. Rives William C. Rives |
Crawford D-R | March 4, 1823 – March 3, 1825 |
[Data unknown/missing. You can help!] |
| Jacksonian | March 4, 1825 – April 17, 1829 |
Appointed U.S. Minister to France | |
| Vacant | April 18, 1829 – January 24, 1830 | ||
| William F. Gordon | Jacksonian | January 25, 1830 – March 3, 1833 |
Redistricted to the 12th district |
| Joseph W. Chinn | Jacksonian | March 4, 1833 – March 3, 1835 |
Lost re-election |
| John Taliaferro | Anti-Jacksonian | March 4, 1835 – March 3, 1837 |
[Data unknown/missing. You can help!] |
| Whig | March 4, 1837 – March 3, 1843 |
Retired | |
| William Lucas | Democratic | March 4, 1843 – March 3, 1845 |
Lost re-election |
| Henry Bedinger III | Democratic | March 4, 1845 – March 3, 1849 |
Lost re-election |
| Richard Parker | Democratic | March 4, 1849 – March 3, 1851 |
Elected Virginia Circuit Court judge |
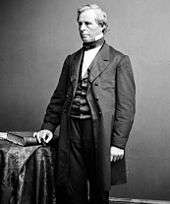
 Charles J. Faulkner Charles J. Faulkner |
Whig | March 4, 1851 – March 3, 1853 |
Redistricted to the 8th district |
 Zedekiah Kidwell Zedekiah Kidwell |
Democratic | March 4, 1853 – March 3, 1857 |
Retired |
| Sherrard Clemens | Democratic | March 4, 1857 – March 3, 1861 |
Retired |
 William G. Brown William G. Brown |
Unionist | March 4, 1861 – March 3, 1863 |
Retired |
| Vacant | March 4, 1863 – June 19, 1863 |
Civil War | |
| District eliminated June 20, 1863 | |||
| District recreated March 4, 1885 | |||
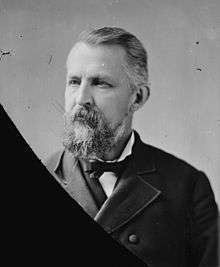 John R. Tucker John R. Tucker |
Democratic | March 4, 1885 – March 3, 1887 |
Retired |
| Jacob Yost | Republican | March 4, 1887 – March 3, 1889 |
Lost re-election |
 Henry S. Tucker III Henry S. Tucker III |
Democratic | March 4, 1889 – March 3, 1897 |
Retired |
| Jacob Yost | Republican | March 4, 1897 – March 3, 1899 |
Retired |
| Julian M. Quarles | Democratic | March 4, 1899 – March 3, 1901 |
Retired |
| Henry D. Flood | Democratic | March 4, 1901 – December 8, 1921 |
Died |
| Vacant | December 9, 1921 – March 20, 1922 | ||
| Henry S. Tucker III | Democratic | March 21, 1922 – July 23, 1932 |
Died |
| Vacant | July 24, 1932 – November 7, 1932 | ||
| Joel W. Flood | Democratic | November 8, 1932 – March 3, 1933 |
Retired |
| District eliminated March 4, 1933 | |||
| District re-created: January 3, 1953 | |||
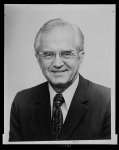
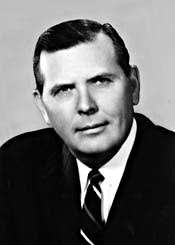 Joel T. Broyhill Joel T. Broyhill |
Republican | January 3, 1953 – December 31, 1974 |
Lost re-election |
| Vacant | December 31, 1974 – January 3, 1975 | ||
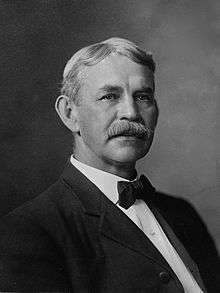
 Joseph L. Fisher Joseph L. Fisher |
Democratic | January 3, 1975 – January 3, 1981 |
Lost re-election |
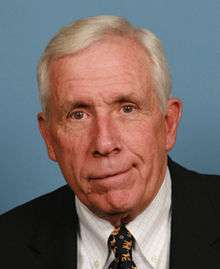 Frank R. Wolf Frank R. Wolf |
Republican | January 3, 1981 – January 3, 2015 |
Retired |
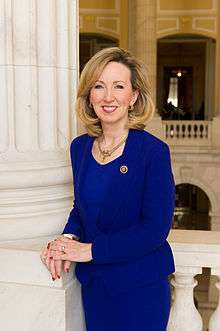 Barbara Comstock Barbara Comstock |
Republican | January 3, 2015 – |
|
Historical district boundaries
See also
References
- ↑ 2014 1-Year American Community Survey
- ↑ "Partisan Voting Index Districts of the 113th Congress: [prpvi2012_82cH~pspvi11~MC29] [82~PVIRANK~2B]" (PDF). The Cook Political Report. 2013. Retrieved April 27, 2013.
- ↑ Kondik, Kyle; Skelley, Geoffrey. "House 2016: How a Democratic Wave Could Happen". University of Virginia Center for Politics. Retrieved 20 April 2016.
- 1 2 "Presidential Results by Congressional District, 2000-2008".
- ↑ Virginia State Board of Elections: Results by District, 2008 Presidential election. Accessed February 11, 2015.
- ↑ Virginia State Board of Elections: Results by District, 2012 Presidential election. Accessed February 11, 2015.
- ↑ Daily Kos Virginia 2013 gubernatorial results by Congressional District . Accessed October 27, 2016.
- ↑ http://clerk.house.gov/member_info/electionInfo/1970election.pdf
- ↑ http://clerk.house.gov/member_info/electionInfo/1972election.pdf
- ↑ http://clerk.house.gov/member_info/electionInfo/1974election.pdf
- ↑ http://clerk.house.gov/member_info/electionInfo/1976election.pdf
- ↑ http://clerk.house.gov/member_info/electionInfo/1978election.pdf
- ↑ http://clerk.house.gov/member_info/electionInfo/1980election.pdf
- ↑ http://clerk.house.gov/member_info/electionInfo/1982election.pdf
- ↑ http://clerk.house.gov/member_info/electionInfo/1984election.pdf
- ↑ http://clerk.house.gov/member_info/electionInfo/1986election.pdf
- ↑ http://clerk.house.gov/member_info/electionInfo/1988election.pdf
- ↑ http://clerk.house.gov/member_info/electionInfo/1990election.pdf
- ↑ http://clerk.house.gov/member_info/electionInfo/1992election.pdf
- ↑ http://clerk.house.gov/member_info/electionInfo/1994election.pdf
- ↑ http://clerk.house.gov/member_info/electionInfo/1996election.pdf
- ↑ http://clerk.house.gov/member_info/electionInfo/1998election.pdf
- ↑ "2000 ELECTION STATISTICS".
- ↑ "2002 ELECTION STATISTICS".
- ↑ "2004 ELECTION STATISTICS".
- ↑ "2006 Election Statistics".
- ↑ https://www.voterinfo.sbe.virginia.gov/election/DATA/2008/07261AFC-9ED3-410F-B07D-84D014AB2C6B/Unofficial/6_s.shtml
- ↑ https://www.voterinfo.sbe.virginia.gov/election/DATA/2010/EB24720D-F5C6-4880-8DC5-12AE4D0C3772/official/6_s.shtml
- ↑ "November 6, 2012 General Election Official Results". Virginia State Board of Elections. Retrieved December 14, 2012.
- ↑ http://cms.sbe.virginia.gov/public/?p=election_summary&id=1&loc=true
- Martis, Kenneth C. (1989). The Historical Atlas of Political Parties in the United States Congress. New York: Macmillan Publishing Company.
- Martis, Kenneth C. (1982). The Historical Atlas of United States Congressional Districts. New York: Macmillan Publishing Company.
- Congressional Biographical Directory of the United States 1774–present
External links
Coordinates: 39°04′33″N 77°51′24″W / 39.07583°N 77.85667°W