United States presidential election, 2012
| | |||||||||||||||||||||||||||||||||||||||||||
| |||||||||||||||||||||||||||||||||||||||||||
| |||||||||||||||||||||||||||||||||||||||||||
 | |||||||||||||||||||||||||||||||||||||||||||
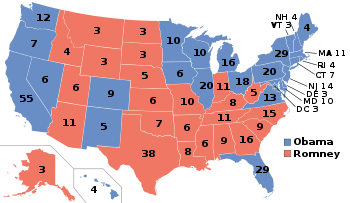
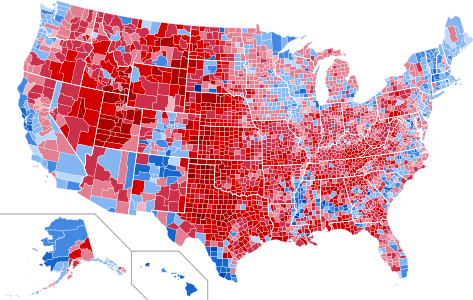
| Presidential election results map. Blue denotes those won by Obama/Biden, red denotes states won by Romney/Ryan. Numbers indicate electoral votes allotted to the winner of each state. | |||||||||||||||||||||||||||||||||||||||||||
| |||||||||||||||||||||||||||||||||||||||||||
2012 U.S. Presidential Election |
|---|
| Democratic Party |
| Republican Party |
|
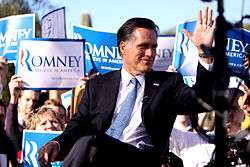
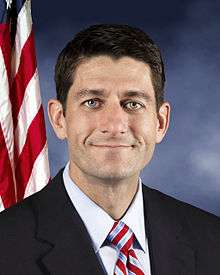
The United States presidential election of 2012 was the 57th quadrennial American presidential election. It was held on Tuesday, November 6, 2012. The Democratic nominee, incumbent President Barack Obama, and his running mate, Vice President Joe Biden, were elected to a second term, defeating the Republican nominee, former Governor of Massachusetts Mitt Romney and his running mate, Representative and eventual House Speaker Paul Ryan of Wisconsin.
As the incumbent president, Obama secured the Democratic nomination with no serious opposition. The Republican Party was more fractured; Mitt Romney was consistently competitive in the polls, but faced challenges from a number of more conservative contenders whose popularity each fluctuated, often besting Romney's. Romney effectively secured the nomination by early May as the economy improved, albeit at a persistently laggard rate. The campaign was marked by a sharp rise in fundraising, including from new nominally independent Super PACs. The campaigns focused heavily on domestic issues: debate centered largely around sound responses to the Great Recession in terms of economic recovery and job creation. Other issues included long-term federal budget issues, the future of social insurance programs, and the Affordable Care Act. Foreign policy was also discussed including the phase-out of the Iraq War, the size of and spending on the military, preventing Iran from obtaining nuclear weapons, and appropriate counteractions to terrorism.
Obama defeated Romney, winning both the popular vote and the electoral college, with 332 electoral votes to Romney's 206. He became the eleventh President and third Democrat to win a plurality of the popular vote more than once. Obama carried all states and districts (among states that allocate electoral votes by district) that he had won in the 2008 presidential election except North Carolina, Indiana, and Nebraska's 2nd congressional district. As such, his margin of victory decreased from 2008. Consequently, Obama became the first incumbent since Franklin D. Roosevelt in 1944 to win reelection with fewer electoral votes and a lower popular vote percentage. Not since 1820 had three consecutive American presidents succeeded in securing reelection.
Timeline

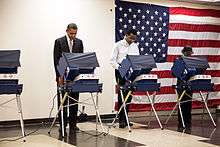
- September–October 2012: Early voting begins in some states and continue as late as November 5.[2]
- November 6, 2012: Election Day; at around 11:15 p.m. EST, the networks call Ohio for Obama, projecting him the winner of the election.
- November 7, 2012: Romney concedes the election to Obama at around 1:00 a.m. EST.
- November 10, 2012: The electoral outcomes of all 50 states and the District of Columbia have been definitively projected (the electoral outcome in Florida remained uncertain until November 10). Obama won 332 electoral votes while Romney won 206 electoral votes.
- December 17, 2012: The Electoral College formally re-elects President Obama and Vice President Biden.[3]
- January 3, 2013: The 113th Congress is sworn in.
- January 4, 2013: Electoral votes are formally counted before a joint session of Congress. The re-election of President Obama and Vice President Biden is certified.
- January 20, 2013: President Obama and Vice President Biden take the oaths of office; Obama's second presidential term begins at noon.
- January 21, 2013: The inauguration ceremonies are held.[4]
Electoral college changes
The 2010 Census changed the electoral vote apportionment for the presidential elections from 2012 to 2020 in the states listed below:
|
States won by Democrats
|
States won by Republicans
|
Swing states
|
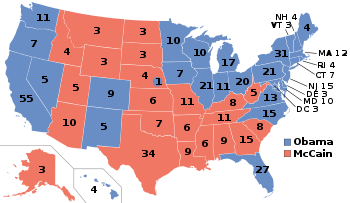 The electoral map in 2008. |
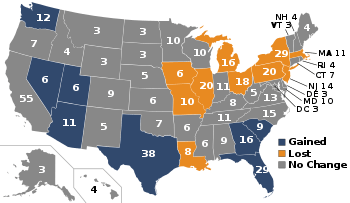 Changes in electoral vote apportionment following the 2010 census. |
Eight states (Arizona, Florida, Georgia, Nevada, South Carolina, Texas, Utah, and Washington) gained votes due to reapportionment based on the 2010 Census. Ten states (Illinois, Iowa, Louisiana, Massachusetts, Michigan, Missouri, New Jersey, New York, Ohio, and Pennsylvania) lost votes. This gave the Democratic Party a net loss of six electoral votes in states won by Democratic nominees in the previous three presidential elections, rendering the party a national total of 242 electoral votes. Conversely, the Republican Party achieved a net gain of six electoral votes in states won by Republican nominees in the previous three presidential elections, rendering the Republican Party a national total of 180 electoral votes.
State changes to voter registration and electoral rules
In 2011, several state legislatures passed new voting laws, especially pertaining to voter identification, with the stated purpose of combating voter fraud; the laws were attacked, however, by the Democratic Party as attempts to suppress voting among its supporters and to improve the Republican Party's presidential prospects. Florida, Georgia, Ohio,[6] Tennessee, and West Virginia's state legislatures approved measures to shorten early voting periods. Florida and Iowa barred all felons from voting. Kansas, South Carolina,[7] Tennessee, Texas[8] and Wisconsin[9] state legislatures passed laws requiring voters to have government-issued IDs before they could cast their ballots. This meant, typically, that people without driver's licenses or passports had to gain new forms of ID. Obama, the NAACP, and the Democratic Party fought against many of the new state laws.[10] Former President Bill Clinton denounced them, saying, "There has never been in my lifetime, since we got rid of the poll tax and all the Jim Crow burdens on voting, the determined effort to limit the franchise that we see today".[11] He was referring to Jim Crow laws passed in southern states near the turn of the twentieth century that disenfranchised most blacks from voting and excluded them from the political process for more than six decades. Clinton said the moves would effectively disenfranchise core voter blocs that trend liberal, including college students, Blacks, and Latinos.[12][13] Rolling Stone magazine criticized the American Legislative Exchange Council (ALEC) for lobbying in states to bring about these laws, to "solve" a problem that does not exist.[10] The Obama campaign fought against the Ohio law, pushing for a petition and statewide referendum to repeal it in time for the 2012 election.[14]
In addition, the Pennsylvania legislature proposed a plan to change its representation in the electoral college from the traditional winner-take-all model to a district-by-district model.[15] As the governorship and both houses of its legislature were Republican-controlled, the move was viewed by some as an attempt to reduce Democratic chances.[16][17][18]
Democratic Party
Primaries
With an incumbent president running for re-election against token opposition, the race for the Democratic nomination was largely uneventful. The nomination process consisted of primaries and caucuses, held by the 50 states, as well as Guam, Puerto Rico, Washington, D.C., U.S. Virgin Islands, American Samoa, and Democrats Abroad. Additionally, high-ranking party members known as superdelegates each received one vote in the convention. A few of the primary challengers surpassed the president's vote total in individual counties in several of the seven contested primaries, though none made a significant impact in the delegate count. Running unopposed everywhere else, President Obama cemented his status as the Democratic presumptive nominee on April 3, 2012, by securing the minimum number of pledged delegates needed to obtain the nomination.[19][20]
Candidate
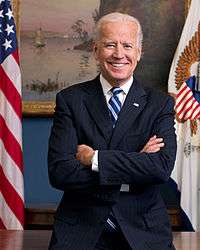
| Barack Obama | Joe Biden | ||||||||||||||||||||||||||||
|---|---|---|---|---|---|---|---|---|---|---|---|---|---|---|---|---|---|---|---|---|---|---|---|---|---|---|---|---|---|
| for President | for Vice President | ||||||||||||||||||||||||||||
 |
 | ||||||||||||||||||||||||||||
| 44th President of the United States (2009–present) |
47th Vice President of the United States (2009–present) | ||||||||||||||||||||||||||||
| Campaign | |||||||||||||||||||||||||||||
 | |||||||||||||||||||||||||||||
Republican Party
Primaries
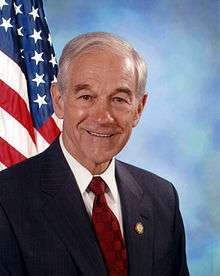
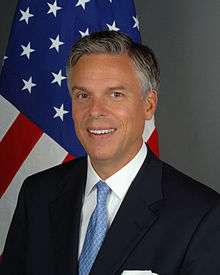
Candidates with considerable name recognition who entered the race for the Republican presidential nomination in the early stages of the primary campaign included Representative and former Libertarian nominee Ron Paul, former Minnesota Governor Tim Pawlenty, who co-chaired John McCain's campaign in 2008, former Massachusetts Governor Mitt Romney, the runner-up for the nomination in the 2008 cycle, and former Speaker of the House Newt Gingrich.
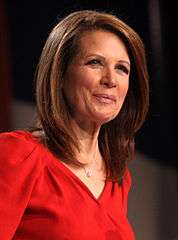
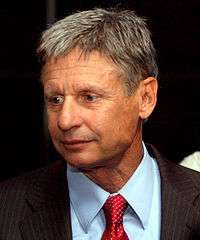
The first debate took place on May 5, 2011, in Greenville, South Carolina, with businessman Herman Cain, former New Mexico Governor Gary Johnson, Ron Paul, Tim Pawlenty, and former Pennsylvania Senator Rick Santorum participating. Another debate took place a month later, with Newt Gingrich, Mitt Romney, former Utah Governor Jon Huntsman, and Rep. Michele Bachmann participating, and Gary Johnson excluded. A total of thirteen debates were held before the Iowa caucuses.
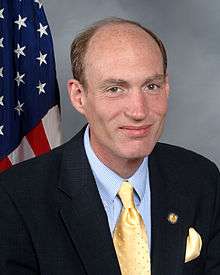
The first major event of the campaign was the Ames Straw Poll, which took place in Iowa on August 13, 2011. Michele Bachmann won the straw poll (this ultimately proved to be the acme of her campaign).[21] Pawlenty withdrew from the race after a poor showing in the straw poll, as did Thaddeus McCotter, the only candidate among those who qualified for the ballot who was refused entrance into the debate.[22]
It became clear at around this point in the nomination process that while Romney was considered to be the likely nominee by the Republican establishment, a large segment of the conservative primary electorate found him to be too moderate for their political views. As a result, a number of potential "anti-Romney" candidates were put forward,[23][24] including Donald Trump,[25] Sarah Palin,[26] Chris Christie,[27] and Texas Governor Rick Perry,[28] the last of whom decided to run in August 2011. Perry did poorly in the debates, however, and Herman Cain and then Newt Gingrich came into the fore in October and November.
Due to a number of scandals, Cain withdrew just before the end of the year, after having gotten on the ballot in several states.[29] Around the same time, Johnson, who had been able to get into only one other debate, withdrew to seek the Libertarian Party nomination.[30]
For the first time in modern Republican Party history, three different candidates won the first three state contests in January (the Iowa caucuses, the New Hampshire primary, and the South Carolina primary).[31] Although Romney had been expected to win in at least Iowa and New Hampshire, Rick Santorum won the non-binding poll at caucus sites in Iowa by 34 votes, as near as can be determined from the incomplete tally, earning him a declaration as winner by state party leaders, although vote totals were missing from eight precincts.[32][33] The election of county delegates at the caucuses would eventually lead to Ron Paul earning 22 of the 28 Iowa delegates to the Republican National Convention.[34] Newt Gingrich won South Carolina by a surprisingly large margin,[35] and Romney won only in New Hampshire.
Those who understood the dynamics of the Iowa caucus process realized after the Iowa caucuses that Paul could dominate the delegate selection process at the Iowa Republican Convention,[36] but national media significantly underestimated Paul's delegate count during the first half of 2012. The New York Times and the Associated Press projected until the Iowa Republican convention in June that Paul would only get one Iowa delegate at the national convention.[37]
An accurate delegate projection would have had Paul in the lead after the January 3 Iowa caucuses and after the January 10 New Hampshire primary, where Romney earned 8 delegates, Paul earned 3 delegates and Jon Huntsman earned 1 delegate.
A number of candidates dropped out at this point in the nomination process. Bachmann withdrew after finishing sixth in the Iowa caucuses,[38] Huntsman withdrew after coming in third in New Hampshire, and Perry withdrew when polls showed him drawing low numbers in South Carolina.[39]
Santorum, who had previously run an essentially one-state campaign in Iowa, was able to organize a national campaign after his surprising victory there. He unexpectedly carried three states in a row on February 7 and overtook Romney in nationwide opinion polls, becoming the only candidate in the race to effectively challenge the notion that Romney was the inevitable nominee.[40] However, Romney won all of the other contests between South Carolina and the Super Tuesday primaries, and regained his first-place status in nationwide opinion polls by the end of February.
The Super Tuesday primaries took place on March 6. Romney carried six states, Santorum carried three, and Gingrich won only in his home state of Georgia.[41] Throughout the rest of March, 266 delegates were allocated in 12 events, including the territorial contests and the first local conventions that allocated delegates (Wyoming's county conventions). Santorum won Kansas and three Southern primaries, but he was unable to make any substantial gain on Romney, who became a formidable frontrunner after securing more than half of the delegates allocated in March.
On April 10, Santorum suspended his campaign due to a variety of reasons, such as a low delegate count, unfavorable polls in his home state of Pennsylvania, and his daughter's health, leaving Mitt Romney as the undisputed front-runner for the presidential nomination and allowing Gingrich to claim that he was "the last conservative standing" in the campaign for the nomination.[42] After disappointing results in the April 24 primaries (finishing second in one state, third in three, and fourth in one), Gingrich dropped out on May 2 in a move that was seen as an effective end to the nomination contest.[43] After Gingrich's spokesman announced his upcoming withdrawal, the Republican National Committee declared Romney the party's presumptive nominee.[44] Ron Paul officially remained in the race, but he stopped campaigning on May 14 to focus on state conventions.
On May 29, after winning the Texas primary, Romney had received a sufficient number of delegates to clinch the party's nomination with the inclusion of unpledged delegates. After winning the June 5 primaries in California and several other states, Romney had received more than enough pledged delegates to clinch the nomination without counting unpledged delegates, making the June 26 Utah Primary, the last contest of the cycle, purely symbolic. CNN's final delegate estimate, released on July 27, 2012, put Romney at 1,462 pledged delegates and 62 unpledged delegates, for a total estimate of 1,524 delegates. No other candidate had unpledged delegates. The delegate estimates for the other candidates were Santorum at 261 delegates, Paul at 154, Gingrich at 142, Bachmann at 1, Huntsman at 1, and all others at 0.[45]
On August 28, 2012, delegates at the Republican National Convention officially named Romney the party's presidential nominee.[46] Romney formally accepted the delegates' nomination on August 30, 2012.[47]
Candidate
 | |||||||||||||||||||||||||||||
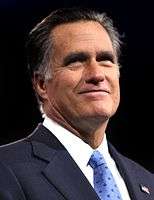
| Mitt Romney | Paul Ryan | ||||||||||||||||||||||||||||
|---|---|---|---|---|---|---|---|---|---|---|---|---|---|---|---|---|---|---|---|---|---|---|---|---|---|---|---|---|---|
| for President | for Vice President | ||||||||||||||||||||||||||||
 |
 | ||||||||||||||||||||||||||||
| 70th Governor of Massachusetts (2003–2007) |
U.S. Representative from Wisconsin (1999–present) | ||||||||||||||||||||||||||||
| Campaign | |||||||||||||||||||||||||||||
| [48][49] | |||||||||||||||||||||||||||||
Withdrawn candidates
- Ron Paul, U.S. Representative from Texas (ended active campaigning on May 14, 2012; no endorsement, continued to seek delegates from earlier primaries).[50]
- Fred Karger, Political consultant and gay rights activist from California (withdrew June 29, 2012).[51]
- Newt Gingrich, former U.S. Speaker of the House of Representatives, from Georgia[52][53] (withdrew on May 2, 2012, and endorsed Mitt Romney)[54]
- Rick Santorum, former senator from Pennsylvania (withdrew on April 10, 2012, and endorsed Mitt Romney)[55][56][57]
- Buddy Roemer, former governor of Louisiana[58][59] (withdrew on February 22, 2012, to run for the nominations of Americans Elect and the Reform Party, then endorsed Gary Johnson)
- Rick Perry, Governor of Texas (withdrew on January 19, 2012, and endorsed Newt Gingrich, then Mitt Romney after Gingrich withdrew)[60][61][62]
- Jon Huntsman, Jr., former U.S. ambassador to China and former governor of Utah (withdrew on January 16, 2012, and endorsed Mitt Romney)[63][64]
- Michele Bachmann, U.S. Representative from Minnesota (withdrew on January 4, 2012, and endorsed Mitt Romney)[65][66][67]
- Gary Johnson, former governor of New Mexico (withdrew on December 28, 2011, to run for the nomination of the Libertarian Party, endorsed Ron Paul)[68][69]
- Herman Cain, businessman from Georgia (withdrew on December 3, 2011, and endorsed Newt Gingrich, then Mitt Romney after Gingrich withdrew)[70][71]
- Thaddeus McCotter, U.S. Representative from Michigan (withdrew on September 22, 2011, and endorsed Mitt Romney)[72][73]
- Tim Pawlenty, former governor of Minnesota (withdrew on August 14, 2011, and endorsed Mitt Romney)[74][75]


.jpg)
Third party and other nominations
Four other parties nominated candidates that had ballot access or write-in access to at least 270 electoral votes, the minimum number of votes needed in the 2012 election to win the presidency through a majority of the electoral college.
Libertarian Party
- Gary Johnson, former governor of New Mexico.[76] Vice-presidential nominee: Jim Gray, retired state court judge, from California[77]
Green Party
- Jill Stein, medical doctor from Massachusetts.[78][79] Vice-presidential nominee: Cheri Honkala, social organizer, from Pennsylvania.[80]
Constitution Party
- Virgil Goode, former Representative from Virginia.[81] Vice-presidential nominee: Jim Clymer from Pennsylvania[82]
Justice Party
- Rocky Anderson, former mayor of Salt Lake City and founding member of the Justice Party, from Utah. Vice-presidential nominee: Luis J. Rodriguez from California.[83][84]
Candidates gallery
.jpg)
.jpg)

Campaigns
Ballot access
| Presidential ticket | Party | Ballot access[85] | Votes | Percentage | ||
|---|---|---|---|---|---|---|
| States | Electors | % of voters | ||||
| Obama / Biden | Democratic | 50 + DC | 538 | 100% | 65,915,795 | 51.19% |
| Romney / Ryan | Republican | 50 + DC | 538 | 100% | 60,933,504 | 47.32% |
| Johnson / Gray | Libertarian | 48 + DC | 515 | 95.1% | 1,275,971 | 0.99% |
| Stein / Honkala | Green | 36 + DC | 436 | 83.1% | 469,627 | 0.36% |
| Goode / Clymer | Constitution | 26 | 257 | 49.9% | 122,388 | 0.09% |
| Anderson / Rodriguez | Justice | 15 | 145 | 28.1% | 43,018 | 0.03% |
| Lindsay / Osorio | Socialism & Liberation | 13 | 115 | 28.6% | 7,791 | 0.006% |
Candidates in bold were on ballots representing 270 electoral votes.
All other candidates were on the ballots of fewer than 10 states, 100 electors, and less than 20% of voters nationwide.
Financing and advertising
The United States presidential election of 2012 broke new records in financing, fundraising, and negative campaigning. Through grassroots campaign contributions, online donations, and Super PACs, Obama and Romney raised a combined total of more than $2 billion.[86] Super PACs constituted nearly one-fourth of the total financing, with most coming from pro-Romney PACs.[87] Obama raised $690 million through online channels, beating his record of $500 million in 2008.[88] Most of the advertising in the 2012 presidential campaign was decidedly negative—80% of Obama's ads and 84% of Romney's ads were negative.[89] The tax-exempt non-profit Americans for Prosperity, a so-called "outside group", that is, a political advocacy group that is not a political action committee or super-PAC, ran a television advertising campaign opposing Obama described by The Washington Post as "early and relentless".[90][91] Americans for Prosperity spent $8.4 million in swing states on television advertisements denouncing the American Recovery and Reinvestment Act of 2009 loan guarantee to Solyndra, a manufacturer of solar panels that went bankrupt,[92] an advertising campaign described by The Wall Street Journal in November 2011 as "perhaps the biggest attack on Mr. Obama so far".[93][94]
Party conventions
- April 18–21, 2012: 2012 Constitution Party National Convention held in Nashville, Tennessee;[95] Virgil Goode won the nomination.
- May 3–6, 2012: 2012 Libertarian National Convention held in Las Vegas, Nevada;[96] Gary Johnson won the nomination.[97]
- July 13–15, 2012: 2012 Green National Convention held in Baltimore, Maryland;[98] Jill Stein won the nomination.[78]
- August 27–30, 2012: 2012 Republican National Convention held in Tampa, Florida;[99] Mitt Romney won the nomination.
- September 3–6, 2012: 2012 Democratic National Convention held in Charlotte, North Carolina;[100] Barack Obama won the nomination.
Debates
The Commission on Presidential Debates held four debates during the last weeks of the campaign: three presidential and one vice-presidential. The major issues debated were the economy and jobs, the federal budget deficit, taxation and spending, the future of Social Security, Medicare, and Medicaid, healthcare reform, education, social issues, immigration, and foreign policy.
Debate schedule:
- Wednesday, October 3: The first presidential debate took place at the University of Denver in Denver, Colorado,[101] moderated by Jim Lehrer.[102]
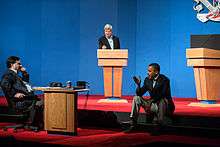
- Thursday, October 11: The vice-presidential debate took place at Centre College in Danville, Kentucky,[101] moderated by Martha Raddatz.[102]
- Tuesday, October 16: The second presidential debate took place at Hofstra University in Hempstead, New York,[101] moderated by Candy Crowley.[102] It had a town hall format.[103]
- Monday, October 22: The third presidential debate took place at Lynn University in Boca Raton, Florida,[101] moderated by Bob Schieffer.[102]
An independent presidential debate featuring minor party candidates took place on Tuesday, October 23 at the Hilton Hotel in Chicago, Illinois.[104][105] The debate was moderated by Larry King[106] and organized by the Free & Equal Elections Foundation.[105] The participants were Gary Johnson (Libertarian), Jill Stein (Green), Virgil Goode (Constitution), and Rocky Anderson (Justice).[105][106] A second debate between Stein and Johnson took place on Monday, November 5 in Washington, D.C.[107][108] It was hosted by RT and moderated by Thom Hartmann and Christina Tobin.[109]
Notable expressions, phrases, and statements
- Severely conservative – In a speech he made at the Conservative Political Action Conference in February 2012, Romney claimed that he had been a "severely conservative Republican governor". Romney's description of his record as "severely conservative" was widely criticized by political commentators as both rhetorically clumsy and factually inaccurate.[110][111][112] Later, the phrase "severely conservative" was frequently brought up by Democrats to make fun of Romney's willingness to associate himself with the far-right of the Republican Party as well as his apparent lack of sincerity while doing so.[113] Conservative radio host Rush Limbaugh, who played the clip on his radio show, said: "I have never heard anybody say, 'I'm severely conservative.' "[114]
- You didn't build that – A portion of a statement that Obama made in a July 2012 campaign speech in Roanoke, Virginia. Obama said that businesses depend on government-provided infrastructure to succeed, but critics of his remarks argued that he was underplaying the work of entrepreneurs and giving the government credit for individuals' success. The Romney campaign immediately jumped on the statement in an effort to drive a wedge between Obama and small business owners/employees. A major theme of the 2012 Republican National Convention was "We Built It".
- 47 percent – An expression Romney used at a private campaign fundraising event, which was secretly recorded and publicly released. At the private event, Romney said that 47 percent of the people would vote for Barack Obama no matter what Romney said or did because those people "...are dependent upon government... I'll never convince them they should take personal responsibility and care for their lives".
- Binders full of women – A phrase that Romney used in the second presidential debate to refer to the long list of female candidates that he considered when choosing his cabinet members as Governor of Massachusetts.
- Shovel-ready jobs – a phrase used to describe some stimulus projects promoted by the administration. During the debate on September 23, 2011, Gary Johnson quipped, "My next-door neighbor's two dogs have created more shovel-ready jobs than this president."[115]
- Romnesia – A term coined by a blogger in April 2011 and used by Obama late in the campaign to describe Romney's alleged inability to take responsibility for his past statements.[116][117]
- $10,000 bet – During a Republican debate, Romney facetiously bet Texas governor Rick Perry $10,000 that he (Perry) was wrong about Romney's position on the individual mandate under the Affordable Healthcare Act. The statement was vilified by Democrats as exemplary of Romney being out of touch with the average American.
- Romneyshambles – a phrase used by the British press after Romney criticized British preparations for the 2012 Summer Olympics, which was a play on omnishambles. The phrase became a popular hashtag on Twitter and was later chosen as one of Collins English Dictionary's words of the year.[118][119]
Results
Popular vote totals are from the official Federal Election Commission report. The results of the electoral vote were certified by Congress on January 4, 2013.[120]
| Presidential candidate | Party | Home state | Popular vote | Electoral vote |
Running mate | |||
|---|---|---|---|---|---|---|---|---|
| Count | Pct | Vice-presidential candidate | Home state | Elect. vote | ||||
| Barack Hussein Obama II (Incumbent) | Democratic | Illinois | 65,915,795 | 51.06% | 332 | Joseph Robinette Biden, Jr. | Delaware | 332 |
| Willard Mitt Romney | Republican | Massachusetts | 60,933,504 | 47.20% | 206 | Paul Davis Ryan | Wisconsin | 206 |
| Gary Earl Johnson | Libertarian | New Mexico | 1,275,971 | 0.99% | 0 | James Polin Gray | California | 0 |
| Jill Ellen Stein | Green | Massachusetts | 469,627 | 0.36% | 0 | Cheri Lynn Honkala | Pennsylvania | 0 |
| Virgil Hamlin Goode, Jr. | Constitution | Virginia | 122,389 | 0.09% | 0 | James N. Clymer | Pennsylvania | 0 |
| Roseanne Cherrie Barr | Peace and Freedom | Hawaii | 67,326 | 0.05% | 0 | Cindy Lee Miller Sheehan | California | 0 |
| Ross Carl "Rocky" Anderson | Justice | Utah | 43,018 | 0.03% | 0 | Luis Javier Rodriguez | California | 0 |
| Thomas Conrad Hoefling | America's | Iowa | 40,628 | 0.03% | 0 | Jonathan D. Ellis | Tennessee | 0 |
| Other | 217,152 | 0.19% | — | Other | — | |||
| Total | 129,085,409 | 100% | 538 | 538 | ||||
| Needed to win | 270 | 270 | ||||||
Results by state
The table below displays the official vote tallies by each state's Electoral College voting method. The source for the results of all states, except those that amended their official results, is the official Federal Election Commission report. The column labeled "Margin" shows Obama's margin of victory over Romney (the margin is negative for every state that Romney won).
| States/districts won by Obama/Biden |
| States/districts won by Romney/Ryan |
Electoral methods
- WTA – Winner-takes-all
- CD – Congressional district★
| Barack Obama Democratic |
Mitt Romney Republican |
Gary Johnson Libertarian |
Jill Stein Green |
Others | Margin | Total | ||||||||||||||
|---|---|---|---|---|---|---|---|---|---|---|---|---|---|---|---|---|---|---|---|---|
| State or district |
Electoral method |
# | % | Electoral votes |
# | % | Electoral votes |
# | % | Electoral votes |
# | % | Electoral votes |
# | % | Electoral votes |
# | % | # | |
| Alabama | WTA | 795,696 | 38.36% | – | 1,255,925 | 60.55% | 9 | 12,328 | 0.59% | – | 3,397 | 0.16% | – | 6,992 | 0.34% | – | −460,229 | −22.19% | 2,074,338 | AL |
| Alaska | WTA | 122,640 | 40.81% | – | 164,676 | 54.80% | 3 | 7,392 | 2.46% | – | 2,917 | 0.97% | – | 2,870 | 0.96% | – | −42,036 | −13.99% | 300,495 | AK |
| Arizona | WTA | 1,025,232 | 44.59% | – | 1,233,654 | 53.65% | 11 | 32,100 | 1.40% | – | 7,816 | 0.34% | – | 452 | 0.02% | – | −208,422 | −9.06% | 2,299,254 | AZ |
| Arkansas | WTA | 394,409 | 36.88% | – | 647,744 | 60.57% | 6 | 16,276 | 1.52% | – | 9,305 | 0.87% | – | 1,734 | 0.16% | – | −253,335 | −23.69% | 1,069,468 | AR |
| California | WTA | 7,854,285 | 60.24% | 55 | 4,839,958 | 37.12% | – | 143,221 | 1.10% | – | 85,638 | 0.66% | – | 115,445 | 0.89% | – | 3,014,327 | 23.12% | 13,038,547 | CA |
| Colorado | WTA | 1,323,102 | 51.49% | 9 | 1,185,243 | 46.13% | – | 35,545 | 1.38% | – | 7,508 | 0.29% | – | 18,123 | 0.71% | – | 137,858 | 5.37% | 2,569,520 | CO |
| Connecticut | WTA | 905,083 | 58.06% | 7 | 634,892 | 40.73% | – | 12,580 | 0.81% | – | 863 | 0.06% | – | 5,542 | 0.36% | – | 270,191 | 17.33% | 1,558,960 | CT |
| Delaware | WTA | 242,584 | 58.61% | 3 | 165,484 | 39.98% | – | 3,882 | 0.94% | – | 1,940 | 0.47% | – | 31 | 0.01% | – | 77,100 | 18.63% | 413,921 | DE |
| D.C. | WTA | 267,070 | 90.91% | 3 | 21,381 | 7.28% | – | 2,083 | 0.71% | – | 2,458 | 0.84% | – | 772 | 0.26% | – | 245,689 | 83.63% | 293,764 | DC |
| Florida | WTA | 4,237,756 | 50.01% | 29 | 4,163,447 | 49.13% | – | 44,726 | 0.53% | – | 8,947 | 0.11% | – | 19,303 | 0.23% | – | 74,309 | 0.88% | 8,474,179 | FL |
| Georgia | WTA | 1,773,827 | 45.48% | – | 2,078,688 | 53.30% | 16 | 45,324 | 1.16% | – | 1,516 | 0.04% | – | 695 | 0.02% | – | −304,861 | −7.82% | 3,900,050 | GA |
| Hawaii | WTA | 306,658 | 70.55% | 4 | 121,015 | 27.84% | – | 3,840 | 0.88% | – | 3,184 | 0.73% | – | 0 | 0.00% | – | 185,643 | 42.71% | 434,697 | HI |
| Idaho | WTA | 212,787 | 32.62% | – | 420,911 | 64.53% | 4 | 9,453 | 1.45% | – | 4,402 | 0.67% | – | 4,721 | 0.72% | – | −208,124 | −31.91% | 652,274 | ID |
| Illinois | WTA | 3,019,512 | 57.60% | 20 | 2,135,216 | 40.73% | – | 56,229 | 1.07% | – | 30,222 | 0.58% | – | 835 | 0.02% | – | 884,296 | 16.87% | 5,242,014 | IL |
| Indiana | WTA | 1,152,887 | 43.93% | – | 1,420,543 | 54.13% | 11 | 50,111 | 1.91% | – | 625 | 0.02% | – | 368 | 0.01% | – | −267,656 | −10.20% | 2,624,534 | IN |
| Iowa | WTA | 822,544 | 51.99% | 6 | 730,617 | 46.18% | – | 12,926 | 0.82% | – | 3,769 | 0.24% | – | 12,324 | 0.78% | – | 91,927 | 5.81% | 1,582,180 | IA |
| Kansas | WTA | 440,726 | 37.99% | – | 692,634 | 59.71% | 6 | 20,456 | 1.76% | – | 714 | 0.06% | – | 5,441 | 0.47% | – | −251,908 | −21.72% | 1,159,971 | KS |
| Kentucky | WTA | 679,370 | 37.80% | – | 1,087,190 | 60.49% | 8 | 17,063 | 0.95% | – | 6,337 | 0.35% | – | 7,252 | 0.40% | – | −407,820 | −22.69% | 1,797,212 | KY |
| Louisiana | WTA | 809,141 | 40.58% | – | 1,152,262 | 57.78% | 8 | 18,157 | 0.91% | – | 6,978 | 0.35% | – | 7,527 | 0.38% | – | −343,121 | −17.21% | 1,994,065 | LA |
| Maine (at-large) | WTA | 401,306 | 56.27% | 2 | 292,276 | 40.98% | – | 9,352 | 1.31% | – | 8,119 | 1.14% | – | 2,127 | 0.30% | – | 109,030 | 15.29% | 713,180 | ME–a/l |
| Maine, 1st | CD | 223,035 | 59.57% | 1 | 142,937 | 38.18% | – | 4,501 | 1.20% | – | 3,946 | 1.05% | – | N/A | N/A | – | 80,098 | 21.39% | 374,419 | ME-1 |
| Maine, 2nd | CD | 177,998 | 52.94% | 1 | 149,215 | 44.38% | – | 4,843 | 1.44% | – | 4,170 | 1.24% | – | N/A | N/A | – | 28,783 | 8.56% | 336,226 | ME-2 |
| Maryland | WTA | 1,677,844 | 61.97% | 10 | 971,869 | 35.90% | – | 30,195 | 1.12% | – | 17,110 | 0.63% | – | 10,309 | 0.38% | – | 705,975 | 26.08% | 2,707,327 | MD |
| Massachusetts | WTA | 1,921,290 | 60.65% | 11 | 1,188,314 | 37.51% | – | 30,920 | 0.98% | – | 20,691 | 0.65% | – | 6,552 | 0.21% | – | 732,976 | 23.14% | 3,167,767 | MA |
| Michigan | WTA | 2,564,569 | 54.21% | 16 | 2,115,256 | 44.71% | – | 7,774 | 0.16% | – | 21,897 | 0.46% | – | 21,465 | 0.45% | – | 449,313 | 9.50% | 4,730,961 | MI |
| Minnesota | WTA | 1,546,167 | 52.65% | 10 | 1,320,225 | 44.96% | – | 35,098 | 1.20% | – | 13,023 | 0.44% | – | 22,048 | 0.75% | – | 225,942 | 7.69% | 2,936,561 | MN |
| Mississippi | WTA | 562,949 | 43.79% | – | 710,746 | 55.29% | 6 | 6,676 | 0.52% | – | 1,588 | 0.12% | – | 3,625 | 0.28% | – | −147,797 | −11.50% | 1,285,584 | MS |
| Missouri | WTA | 1,223,796 | 44.38% | – | 1,482,440 | 53.76% | 10 | 43,151 | 1.56% | – | 0 | 0.00% | – | 7,936 | 0.29% | – | −258,644 | −9.38% | 2,757,323 | MO |
| Montana | WTA | 201,839 | 41.70% | – | 267,928 | 55.35% | 3 | 14,165 | 2.93% | – | 0 | 0.00% | – | 116 | 0.02% | – | −66,089 | −13.65% | 484,048 | MT |
| Nebraska (at-large) | WTA | 302,081 | 38.03% | – | 475,064 | 59.80% | 2 | 11,109 | 1.40% | – | 0 | 0.00% | – | 6,125 | 0.77% | – | −172,983 | −21.78% | 794,379 | NE–a/l |
| Nebraska, 1st | CD | 108,082 | 40.95% | – | 152,021 | 57.59% | 1 | 3,847 | 1.46% | – | 0 | 0.00% | – | N/A | N/A | – | −43,939 | −16.65% | 263,950 | NE-1 |
| Nebraska, 2nd | CD | 121,889 | 45.78% | – | 140,976 | 52.95% | 1 | 3,393 | 1.27% | – | 0 | 0.00% | – | N/A | N/A | – | −19,087 | −7.17% | 266,258 | NE-2 |
| Nebraska, 3rd | CD | 72,110 | 27.94% | – | 182,067 | 70.56% | 1 | 3,869 | 1.50% | – | 0 | 0.00% | – | N/A | N/A | – | −109,957 | −42.61% | 258,046 | NE-3 |
| Nevada | WTA | 531,373 | 52.36% | 6 | 463,567 | 45.68% | – | 10,968 | 1.08% | – | 0 | 0.00% | – | 9,010 | 0.89% | – | 67,806 | 6.68% | 1,014,918 | NV |
| New Hampshire | WTA | 369,561 | 51.98% | 4 | 329,918 | 46.40% | – | 8,212 | 1.16% | – | 324 | 0.05% | – | 2,957 | 0.42% | – | 39,643 | 5.58% | 710,972 | NH |
| New Jersey[121] | WTA | 2,125,101 | 58.38% | 14 | 1,477,568 | 40.59% | – | 21,045 | 0.58% | – | 9,888 | 0.27% | – | 6,690 | 0.18% | – | 647,533 | 17.81% | 3,640,292 | NJ |
| New Mexico | WTA | 415,335 | 52.99% | 5 | 335,788 | 42.84% | – | 27,788 | 3.55% | – | 2,691 | 0.34% | – | 2,156 | 0.28% | – | 79,547 | 10.15% | 783,758 | NM |
| New York[122] | WTA | 4,485,741 | 63.35% | 29 | 2,490,431 | 35.17% | – | 47,256 | 0.67% | – | 39,982 | 0.56% | – | 17,749 | 0.25% | – | 1,995,310 | 28.18% | 7,081,159 | NY |
| North Carolina | WTA | 2,178,391 | 48.35% | – | 2,270,395 | 50.39% | 15 | 44,515 | 0.99% | – | 0 | 0.00% | – | 12,071 | 0.27% | – | −92,004 | −2.04% | 4,505,372 | NC |
| North Dakota | WTA | 124,827 | 38.69% | – | 188,163 | 58.32% | 3 | 5,231 | 1.62% | – | 1,361 | 0.42% | – | 3,045 | 0.94% | – | −63,336 | −19.63% | 322,627 | ND |
| Ohio[123] | WTA | 2,827,709 | 50.67% | 18 | 2,661,437 | 47.69% | – | 49,493 | 0.89% | – | 18,573 | 0.33% | – | 23,635 | 0.42% | – | 166,272 | 2.98% | 5,580,847 | OH |
| Oklahoma | WTA | 443,547 | 33.23% | – | 891,325 | 66.77% | 7 | 0 | 0.00% | – | 0 | 0.00% | – | 0 | 0.00% | – | −447,778 | −33.54% | 1,334,872 | OK |
| Oregon | WTA | 970,488 | 54.24% | 7 | 754,175 | 42.15% | – | 24,089 | 1.35% | – | 19,427 | 1.09% | – | 21,091 | 1.18% | – | 216,313 | 12.09% | 1,789,270 | OR |
| Pennsylvania | WTA | 2,990,274 | 51.97% | 20 | 2,680,434 | 46.59% | – | 49,991 | 0.87% | – | 21,341 | 0.37% | – | 11,630 | 0.20% | – | 309,840 | 5.39% | 5,753,670 | PA |
| Rhode Island | WTA | 279,677 | 62.70% | 4 | 157,204 | 35.24% | – | 4,388 | 0.98% | – | 2,421 | 0.54% | – | 2,359 | 0.53% | – | 122,473 | 27.46% | 446,049 | RI |
| South Carolina | WTA | 865,941 | 44.09% | – | 1,071,645 | 54.56% | 9 | 16,321 | 0.83% | – | 5,446 | 0.28% | – | 4,765 | 0.24% | – | −205,704 | −10.47% | 1,964,118 | SC |
| South Dakota | WTA | 145,039 | 39.87% | – | 210,610 | 57.89% | 3 | 5,795 | 1.59% | – | 0 | 0.00% | – | 2,371 | 0.65% | – | −65,571 | −18.02% | 363,815 | SD |
| Tennessee | WTA | 960,709 | 39.08% | – | 1,462,330 | 59.48% | 11 | 18,623 | 0.76% | – | 6,515 | 0.26% | – | 10,400 | 0.42% | – | −501,621 | −20.40% | 2,458,577 | TN |
| Texas | WTA | 3,308,124 | 41.38% | – | 4,569,843 | 57.17% | 38 | 88,580 | 1.11% | – | 24,657 | 0.31% | – | 2,647 | 0.03% | – | −1,261,719 | −15.78% | 7,993,851 | TX |
| Utah | WTA | 251,813 | 24.75% | – | 740,600 | 72.79% | 6 | 12,572 | 1.24% | – | 3,817 | 0.38% | – | 8,638 | 0.85% | – | −488,787 | −48.04% | 1,017,440 | UT |
| Vermont | WTA | 199,239 | 66.57% | 3 | 92,698 | 30.97% | – | 3,487 | 1.17% | – | 594 | 0.20% | – | 3,272 | 1.09% | – | 106,541 | 35.60% | 299,290 | VT |
| Virginia | WTA | 1,971,820 | 51.16% | 13 | 1,822,522 | 47.28% | – | 31,216 | 0.81% | – | 8,627 | 0.22% | – | 20,304 | 0.53% | – | 149,298 | 3.87% | 3,854,489 | VA |
| Washington | WTA | 1,755,396 | 56.16% | 12 | 1,290,670 | 41.29% | – | 42,202 | 1.35% | – | 20,928 | 0.67% | – | 16,320 | 0.52% | – | 464,726 | 14.87% | 3,125,516 | WA |
| West Virginia | WTA | 238,269 | 35.54% | – | 417,655 | 62.30% | 5 | 6,302 | 0.94% | – | 4,406 | 0.66% | – | 3,806 | 0.57% | – | −179,386 | −26.76% | 670,438 | WV |
| Wisconsin[124] | WTA | 1,620,985 | 52.83% | 10 | 1,407,966 | 45.89% | – | 20,439 | 0.67% | – | 7,665 | 0.25% | – | 11,379 | 0.37% | – | 213,019 | 6.94% | 3,068,434 | WI |
| Wyoming | WTA | 69,286 | 27.82% | – | 170,962 | 68.64% | 3 | 5,326 | 2.14% | – | 0 | 0.00% | – | 3,487 | 1.40% | – | −101,676 | −40.82% | 249,061 | WY |
| U.S. Total | – | 65,915,795 | 51.06% | 332 | 60,933,504 | 47.20% | 206 | 1,275,971 | 0.99% | – | 469,627 | 0.36% | – | 490,512 | 0.38% | – | 4,982,291 | 3.86% | 129,085,409 | US |
★Two states (Maine and Nebraska) allow for their electoral votes to be split between candidates. The winner within each congressional district gets one electoral vote for the district. The winner of the statewide vote gets two additional electoral votes.[125][126]
Close races

Red denotes states (or congressional districts that contribute an electoral vote) won by Republican Mitt Romney; blue denotes those won by Democrat Barack Obama.
States where the margin of victory was under 5% (75 electoral votes):
- Florida, 0.88%
- North Carolina, 2.04%
- Ohio, 2.98%
- Virginia, 3.87%
States/districts where the margin of victory was between 5% and 10% (119 electoral votes):
- Colorado, 5.37%
- Pennsylvania, 5.39%
- New Hampshire, 5.58%
- Iowa, 5.81%
- Nevada, 6.68%
- Wisconsin, 6.94%
- Nebraska's 2nd Congressional District, 7.16%
- Minnesota, 7.69%
- Georgia, 7.82%
- Maine's 2nd Congressional District, 8.56%
- Arizona, 9.06%
- Missouri, 9.38%
- Michigan, 9.50%
Romney's concession

After the networks called Ohio (the state that was arguably the most critical for Romney, as no Republican has ever won the Presidency without carrying it) for Obama at around 11:15 PM EST on Election Day, Romney was ready to concede the race, but hesitated when Karl Rove strenuously objected on Fox News to the network's decision to make that call.[127][128] However, after Colorado and Nevada were called for the President (giving Obama enough electoral votes to win even if Ohio were to leave his column), in tandem with Obama's apparent lead in Florida and Virginia (both were eventually called for Obama), Romney acknowledged that he had lost and conceded at around 1:00 AM EST on November 7.
Despite public polling showing Romney behind Obama in the swing states of Nevada, Colorado, Iowa, Wisconsin, Ohio, and New Hampshire, tied with Obama in Virginia, and just barely ahead of Obama in Florida, the Romney campaign said they were genuinely surprised by the loss, having believed that public polling was oversampling Democrats.[129] The Romney campaign had already set up a transition website, and had scheduled and purchased a fireworks display to celebrate in case he won the election.[130][131]
On November 30, 2012, it was revealed that shortly before the election, internal polling done by the Romney campaign had shown Romney ahead in Colorado and New Hampshire, tied in Iowa, and within a few points of Obama in Wisconsin, Pennsylvania, Minnesota, and Ohio.[132] In addition, the Romney campaign had assumed that they would win Florida, North Carolina, and Virginia.[133] The polls had made Romney and his campaign team so confident of their victory that Romney did not write a concession speech until Obama's victory was announced.[134][135]
Reactions
Foreign leaders reacted with both positive and mixed messages. Most world leaders congratulated and praised Barack Obama on his re-election victory. However, Venezuela and some other states had tempered reactions. Pakistan commented that Romney's defeat had made Pakistan-United States relations safer. Stock markets fell noticeably after Obama's re-election, with the Dow Jones Industrial Average, NASDAQ, and the S&P 500 each declining over two percent the day after the election.[136] By his inauguration, however, the markets had gained back all the losses[137] and a bull run began that culminated in 2015 when the Dow closed at an all-time high of 18,312,[138] the NASDAQ reached the milestone of 5,210,[139] and the S&P 500 peaked at a record 2,130.[140]
Voter demographics
| 2012 Presidential vote by demographic subgroup | |||||||
|---|---|---|---|---|---|---|---|
| Demographic subgroup | Obama | Romney | Other | % of total vote | |||
| Total vote | 51 | 47 | 2 | 100 | |||
| Ideology | |||||||
| Liberals | 86 | 11 | 3 | 25 | |||
| Moderates | 56 | 41 | 3 | 41 | |||
| Conservatives | 17 | 82 | 1 | 35 | |||
| Party | |||||||
| Democrats | 92 | 7 | 1 | 38 | |||
| Republicans | 6 | 93 | 1 | 32 | |||
| Independents | 45 | 50 | 5 | 29 | |||
| Gender | |||||||
| Men | 45 | 52 | 3 | 47 | |||
| Women | 55 | 44 | 1 | 53 | |||
| Gender by marital status | |||||||
| Married men | 38 | 60 | 2 | 29 | |||
| Married women | 46 | 53 | 1 | 31 | |||
| Non-married men | 56 | 40 | 4 | 18 | |||
| Non-married women | 67 | 31 | 2 | 23 | |||
| Race/ethnicity | |||||||
| White | 39 | 59 | 2 | 72 | |||
| Black | 93 | 6 | 1 | 13 | |||
| Asian | 73 | 26 | 1 | 3 | |||
| Other | 58 | 38 | 4 | 2 | |||
| Hispanic | 71 | 27 | 2 | 10 | |||
| Religion | |||||||
| Protestant or other Christian | 43 | 56 | 1 | 51 | |||
| Catholic | 50 | 48 | 2 | 25 | |||
| Mormon | 21 | 78 | 1 | 2 | |||
| Jewish | 69 | 30 | 1 | 2 | |||
| Other | 74 | 23 | 3 | 7 | |||
| None | 70 | 26 | 4 | 12 | |||
| Religious service attendance | |||||||
| More than once a week | 36 | 63 | 1 | 14 | |||
| Once a week | 41 | 58 | 1 | 28 | |||
| A few times a month | 55 | 44 | 1 | 13 | |||
| A few times a year | 56 | 42 | 2 | 27 | |||
| Never | 62 | 34 | 4 | 17 | |||
| White evangelical or born-again Christian? | |||||||
| White evangelical or born-again Christian | 21 | 78 | 1 | 26 | |||
| Everyone else | 60 | 37 | 3 | 74 | |||
| Age | |||||||
| 18–24 years old | 60 | 36 | 4 | 11 | |||
| 25–29 years old | 60 | 38 | 2 | 8 | |||
| 30–39 years old | 55 | 42 | 3 | 17 | |||
| 40–49 years old | 48 | 50 | 2 | 20 | |||
| 50–64 years old | 47 | 52 | 1 | 28 | |||
| 65 and older | 44 | 56 | 0 | 16 | |||
| Sexual orientation | |||||||
| LGBT | 76 | 22 | 2 | 5 | |||
| Heterosexual | 49 | 49 | 2 | 95 | |||
| Education | |||||||
| Not a high school graduate | 64 | 35 | 1 | 3 | |||
| High school graduate | 51 | 48 | 1 | 21 | |||
| Some college education | 49 | 48 | 3 | 29 | |||
| College graduate | 47 | 51 | 2 | 29 | |||
| Postgraduate education | 55 | 42 | 3 | 18 | |||
| Family income | |||||||
| Under $30,000 | 63 | 35 | 2 | 20 | |||
| $30,000–49,999 | 57 | 42 | 1 | 21 | |||
| $50,000–99,999 | 46 | 52 | 2 | 31 | |||
| $100,000–199,999 | 44 | 54 | 2 | 21 | |||
| $200,000–249,999 | 47 | 52 | 1 | 3 | |||
| Over $250,000 | 42 | 55 | 3 | 4 | |||
| Region | |||||||
| Northeast | 59 | 40 | 1 | 18 | |||
| Midwest | 51 | 48 | 2 | 24 | |||
| South | 46 | 53 | 1 | 36 | |||
| West | 54 | 43 | 3 | 22 | |||
| Community size | |||||||
| Big cities (population over 500,000) | 69 | 29 | 2 | 11 | |||
| Mid-sized cities (population 50,000 to 500,000) | 58 | 40 | 2 | 21 | |||
| Suburbs | 48 | 50 | 2 | 47 | |||
| Towns (population 10,000 to 50,000) | 42 | 56 | 2 | 8 | |||
| Rural areas | 37 | 61 | 2 | 14 | |||
Hispanic vote
The United States has a population of 50 million Hispanic and Latino Americans, 27 million of whom are citizens eligible to vote (13% of total eligible voters). Traditionally, only half of eligible Hispanic voters vote (around 7% of voters); of them, 71% voted for Barack Obama (increasing his percentage of the vote by 5%; therefore, the Hispanic vote was an important factor in Obama's re-election, since the vote difference between the two main parties was only 3.9%[141][142][143][144]
Source: Exit polls conducted by Edison Research of Somerville, New Jersey, for the National Election Pool, a consortium of ABC News, Associated Press, CBS News, CNN, Fox News,[145] and NBC News.[146] Total vote and results by region are based on the "Votes by state" section of this article.
Analysis
Combined with the re-elections of Bill Clinton and George W. Bush, Obama's victory in the 2012 election marked only the second time in American history that three consecutive presidents were each elected to two or more full terms (the first time being the consecutive two-term presidencies of Thomas Jefferson, James Madison, and James Monroe).[147] This was also the first election since 1944 in which neither of the major candidates had any military experience.[148]
The 2012 election marked the first time since Franklin D. Roosevelt's last two re-elections in 1940 and 1944 that a Democratic presidential candidate won a majority of the popular vote in two consecutive elections.[149] Obama was also the first president of either party to secure at least 51% of the popular vote in two elections since Dwight Eisenhower in 1952 and 1956.[150] Obama is the third Democratic president to secure at least 51% of the vote twice, after Andrew Jackson and Franklin D. Roosevelt.[151]
Romney lost his home state of Massachusetts, becoming the first major party presidential candidate to lose his home state since Democrat Al Gore lost his home state of Tennessee to Republican George W. Bush in the 2000 election.[152] Romney lost his home state by more than 23%, the worst losing margin for a major party candidate since John Frémont in 1856.[153] Even worse than Frémont, Romney failed to win a single county in his home state.[154][155] In addition, since Obama carried Ryan's home state of Wisconsin, the Romney–Ryan ticket was the first major party ticket since the 1972 election to have both of its nominees lose their home states.[156] Romney won the popular vote in every county of three states: Utah, Oklahoma, and West Virginia; Obama did so in four states: Vermont, Massachusetts, Rhode Island, and Hawaii.[157]
Romney's loss prompted the Republican National Committee to try to appeal to the American Latino population by concentrating on different approaches to immigration. These were short-lived due to activity and anger from the Republican base and may have contributed to the selection of Donald Trump as their presidential candidate four years later.[158]
Gary Johnson's popular vote total set a Libertarian Party record, and his popular vote percentage is the second-best showing for a Libertarian in a presidential election, trailing only Ed Clark's in 1980.[159] Green Party candidate Jill Stein's popular vote total made her the most successful female presidential candidate in a general election in United States history.[160][161]
Obama's vote total was the second most votes received in the history of presidential elections and the most ever for a reelected president. Obama owns the all-time record for votes in a single election as well in 2008. However, Obama also became the first president in American history to be reelected to a second term by smaller margins in every way possible: Compared to his victory in 2008, he won fewer states (28 to 26), fewer electoral votes (365 to 332), fewer popular votes (69.5 million to 65.9 million), and a smaller percentage of the popular vote (52.9% to 51.1%).[162]
Maps
-

Cartogram of the electoral vote results, with each square representing one electoral vote.
-
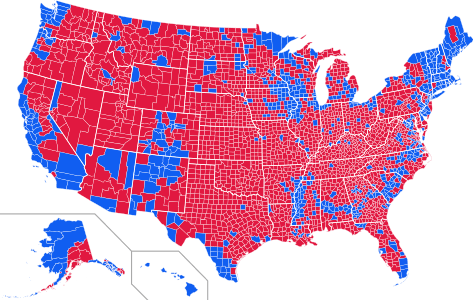
Results by county. Blue denotes counties that went to Obama; red denotes counties that went to Romney. Hawaii, Massachusetts, Rhode Island, and Vermont had all counties go to Obama. Oklahoma, Utah, and West Virginia had all counties go to Romney.
-
Results by county, shaded according to winning candidate's percentage of the vote.
-
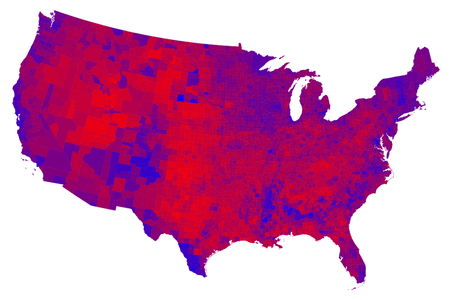
Popular vote by county shaded on a scale from red/Republican to blue/Democratic.
-

Cartogram of popular vote by county shaded on a scale from red/Republican to blue/Democratic where each county has been rescaled in proportion to its population.
-

Change in popular vote margins at the county level from the 2008 election to the 2012 election. Blue denotes counties that voted more Democratic. Red denotes counties that voted more Republican. Romney's strongest improvements over McCain were in Utah and Appalachia, while Obama's strongest gains were in Alaska, the New York area, and the Gulf states.
-

2012 Presidential Election, Results by Congressional District.
-
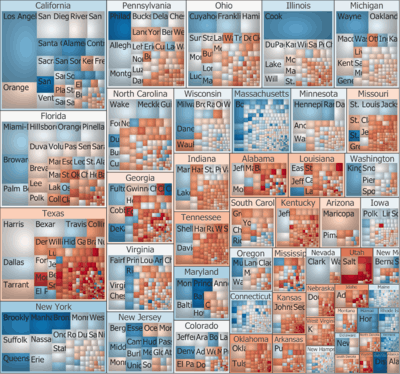
Treemap of the popular vote by county, state, and locally predominant recipient.
Gallery
-

The Empire State Building in New York City was lit blue when CNN called Ohio for Obama, projecting him the winner of the election. Likewise, red would have been used if Romney won.[1]
-
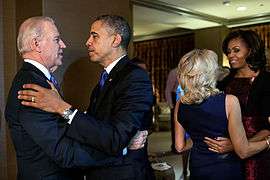
The Obamas and the Bidens embrace following the television announcement of their victory.
-
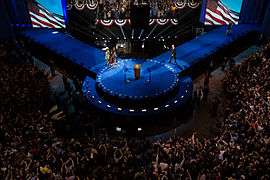
The Obamas and the Bidens walk on stage at the election night victory celebration at McCormick Place in Chicago.
-
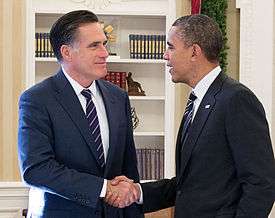
Former Governor Mitt Romney meets with President Barack Obama at the White House after the 2012 presidential election.
- ^ Wells, Charlie (November 6, 2012). "Empire State Building lights up to broadcast election results". Daily News. New York.
See also
- Planned presidential transition of Mitt Romney
- United States Senate elections, 2012
- United States House of Representatives elections, 2012
- United States gubernatorial elections, 2012
- Nationwide opinion polling for the United States presidential election, 2012
- Statewide opinion polling for the United States presidential election, 2012
- United States presidential election, 2012 timeline
References
- ↑ "Federal Elections 2012: Election Results for the U.S. President, the U.S. Senate and the U.S. House of Representatives" (PDF). Federal Election Commission. p. 5. Retrieved December 7, 2015.
- ↑ "Early Voting 2012 Presidential Election". Retrieved November 7, 2012.
- ↑ Bakst, Brian (December 17, 2012). "Electoral College vote affirms Obama re-election". U.S. News & World Report. Retrieved December 21, 2012.
- ↑ "Confident Obama lays out battle plan as he launches second term", Reuters. January 21, 2013. Retrieved January 22, 2013
- ↑ "Table 1. Apportionment Population and Number of Representatives, by State: 2010 Census" (PDF). U.S. Census Bureau. December 21, 2010. Retrieved December 30, 2010.
- ↑ "David Callahan: Ohio's Voter ID Law and the 2012 Election". Huffington Post Politics blog. March 25, 2011. Retrieved October 20, 2011.
- ↑ "New SC voter ID requirements clears Senate". Charleston: WCBD-TV 2. Archived from the original on September 9, 2011. Retrieved October 20, 2011.
- ↑ "Rick Perry's agenda may signal run for W.H. – Andy Barr". Politico.Com. Retrieved October 20, 2011.
- ↑ "The Next Election: The Surprising Reality by Andrew Hacker". The New York Review of Books. Retrieved October 20, 2011.
- 1 2 Ari Berman (August 30, 2011). "The GOP War on Voting". Rolling Stone. New York. Retrieved October 20, 2011.
- ↑ "Bill Clinton likens GOP effort to Jim Crow laws – Darren Samuelsohn". Politico.Com. Retrieved October 20, 2011.
- ↑ Sonmez, Felicia (May 23, 2011). "Republicans rewriting state election laws in ways that could how hurt Democrat". The Washington Post. Retrieved October 20, 2011.
- ↑ Jackson, Jesse. "38-states-rigging-voting-rules-for-GOP". Chicago Sun-Times. Archived from the original on October 9, 2011. Retrieved October 20, 2011.
- ↑ Provance, Jim. "Obama campaign fighting Ohio voting law". Toledo Blade. Retrieved October 20, 2011.
- ↑ "Pennsylvania's 'Democrat-screwing' 2012 'genius plan'". The Week. New York. September 15, 2011. Retrieved October 20, 2011.
- ↑ Olson, Laura (September 13, 2011). "Change proposed for state's electoral vote process". Pittsburgh Post-Gazette. Retrieved October 20, 2011.
- ↑ Rosenbaum, Ron (September 13, 2011). "Pennsylvania Ponders Bold Democrat-Screwing Electoral Plan". Slate. Retrieved October 20, 2011.
- ↑ "Pennsylvania GOP looks to split electoral votes". The Washington Times. September 15, 2011. Retrieved October 20, 2011.
- ↑ Jackson, David (April 4, 2012)"It's official: Obama clinches Democratic nomination", USA Today. Retrieved April 10, 2012.
- ↑ (April 4, 2012) "Obama Clinches Democratic Nomination", CNN. Retrieved April 12, 2012.
- ↑ Goldman, Russell (July 5, 2012). "Michele Bachmann Drops Out of Presidential Race". ABC News.
- ↑ Summers, Juana (August 11, 2011). "Barred hopefuls make debate plans". Politico. Retrieved July 5, 2012.
- ↑ Reid, Tim (January 9, 2012). "Romney's rivals running out of time to stop him". Reuters. Retrieved July 5, 2012.
- ↑ Norington, Brad "Romney has money but lacks conviction", The Australian. Retrieved July 12, 2012.
- ↑ Cohn, Alicia M. "Trump says Romney lacks the 'courage' to participate in Newsmax debate", The Hill. Retrieved July 12, 2012.
- ↑ Stanley, Timothy (March 30, 2012) "If only Sarah Palin had run ...", CNN. Retrieved July 12, 2012.
- ↑ Avlon, John (August 31, 2011). "Chris Christie's 2012 Tease".
- ↑ Cohen, Tom; Silverleib, Alan (September 1, 2011) "Seeking the 'anti-Romney' in the Republican presidential race", CNN.com. Retrieved July 12, 2012.
- ↑ "Herman Cain suspends presidential campaign". Newsday. December 3, 2011. Retrieved July 5, 2012.
- ↑ Stewart, Rebecca (December 28, 2011). "'Liberated' Gary Johnson seeks Libertarian nomination". CNN. Retrieved December 28, 2011.
- ↑ Knickerbocker, Brad (January 21, 2012). "Newt Gingrich wins South Carolina. Can he do the same in Florida?". The Christian Science Monitor. Retrieved July 10, 2012.
- ↑ Rick Santorum Is Declared Winner of Iowa Caucuses by State Party Leaders" (January 21, 2012). Bloomberg News. Archived October 20, 2012, at the Wayback Machine.
- ↑ "2012 GOP caucus count unresolved". Iowa Caucuses. Retrieved November 29, 2015.
- ↑ "Yes, Ron Paul won the Iowa caucuses". The Des Moines Register. Retrieved November 29, 2015.
- ↑ Begala, Paul (January 21, 2012). "Newt Gingrich's Surprise Win in South Carolina Panics Republicans".
- ↑ "Ron Paul May Have Secretly Won The Iowa Caucuses". Business Insider. Retrieved November 29, 2015.
- ↑ "Ron Paul Wins Iowa Delegate Majority". thenewamerican.com. Retrieved November 29, 2015.
- ↑ Sarah Wheaton, "Bachmann Says She Will Not Continue in the Race", January 4, 2012, The New York Times.
- ↑ Zeleny, Jeff; Shear, Michael D. (January 19, 2012). "Perry to End Bid for Presidency". The New York Times. Retrieved July 10, 2012.
- ↑ Madison, Lucy (February 8, 2012) "Santorum hopes to build momentum from 3-state sweep", CBS News. Retrieved August 27, 2012
- ↑ "Results: March 6, 2012 – Super Tuesday", CNN. Retrieved July 12, 2012.
- ↑ Gabriel, Trip (April 10, 2012) "Gingrich Says He's in the Race to the End", The New York Times.
- ↑ "Overheard on CNN.com: What brought down Gingrich's campaign? What's next?", CNN. April 25, 2012.
- ↑ Shear, Michael D. (April 25, 2012). "Republican National Committee Backs Romney". The New York Times. Retrieved May 2, 2012.
- ↑ Holland, Steve (May 30, 2012) "Romney clinches Republican 2012 nomination in Texas", Reuters. Retrieved May 30, 2012.
- ↑ Caldwell, Leigh Ann (August 28, 2012). "Republican delegates nominate Mitt Romney". CBS News. Retrieved August 28, 2012.
- ↑ O'Brien, Michael (August 30, 2012) "Romney accepts nomination, says 'The time has come to turn the page' ", NBC News. Retrieved August 31, 2012.
- ↑ "Mitt Romney announces bid to be US president in 2012", BBC. June 2, 2011
- ↑ Elliott, Philip (June 2, 2011). "Romney opens presidential bid — he's got company". Deseret News. Retrieved October 5, 2012.
- ↑ Good, Chris (May 14, 2012). "Ron Paul to Stop Campaigning in New States". ABC News. Retrieved October 8, 2012.
- ↑ "Fred Karger officially ends 2012 presidential campaign". Wikinews. June 30, 2012. Retrieved July 5, 2015.
- ↑ Marr, Kendra (May 11, 2011). "Newt Gingrich running for president". Politico. Archived from the original on May 11, 2011. Retrieved May 11, 2011.
- ↑ Shear, Michael (May 11, 2011) "Video: Gingrich Announces for President", The New York Times. Retrieved May 11, 2011.
- ↑ Montopoli, Brian (May 2, 2012) "Newt Gingrich suspends presidential campaign", CBS News. Retrieved May 2, 2012.
- ↑ George, Stephanopoulos (June 6, 2011). "Rick Santorum Will Run for President: 'We're In It to Win'". ABC News. Retrieved June 6, 2011.
- ↑ Salant, Jonathan D. (June 6, 2011). "Ex-Pennsylvania Senator Santorum Announces '12 Republican Presidential Bid". Bloomberg News. Retrieved June 6, 2011.
- ↑ "Republican Rick Santorum announces presidential run". The Patriot News. Associated Press. June 6, 2011. Retrieved June 6, 2011.
- ↑ "Roemer kicks off 2012 presidential bid". KRQE. July 21, 2011. Retrieved October 5, 2012.
- ↑ McKinnon, Mark (July 21, 2011). "Listen to Candidate Roemer". The Daily Beast. Retrieved July 21, 2011.
- ↑ "Texas Gov. Rick Perry Jumps In Presidential Race". ABC News. August 11, 2011. Retrieved December 3, 2011.
- ↑ Hamby, Peter (January 19, 2012). "BREAKING: Perry drops out, endorses Gingrich". CNN. Retrieved January 25, 2012.
- ↑ Reston, Maeve (August 13, 2011). "Texas Gov. Rick Perry declares GOP presidential bid". Los Angeles Times. Retrieved August 18, 2011.
- ↑ "Huntsman's sly web strategy", The Hill. May 11, 2011.
- ↑ "Jon Huntsman: My Mormonism is 'tough to define'", Politico. May 12, 2011.
- ↑ Rucker, Philip (January 4, 2012). "Michele Bachmann drops out of GOP race after Iowa caucuses". The Washington Post. Retrieved January 5, 2012.
- ↑ Rosenwald, Michael S. (June 14, 2011). "Michele Bachmann files paperwork to run for president". The Washington Post.
- ↑ Burns, Alexander (June 13, 2011). "Michele Bachmann is in". Politico. Retrieved December 3, 2011.
- ↑ Camia, Catalina (April 21, 2011). "Ex-N.M. governor Gary Johnson announces for president". USA Today.
- ↑ "Gary Johnson throws his hat into the GOP presidential ring, will he be the 2012 Ron Paul?". Los Angeles Times. April 21, 2011.
- ↑ Green, Joshua (May 21, 2011) "Herman Cain Makes It Official", The Atlantic. Retrieved May 21, 2011.
- ↑ Creed, Ryan (May 21, 2011) "Herman Cain, Former CEO of Godfather's Pizza, Announces His Candidacy", ABC News. Retrieved May 22, 2011.
- ↑ Madison, Lucy (July 1, 2011). "Michigan Rep. Thaddeus McCotter to jump into Republican presidential race". CBS News. Retrieved June 27, 2012.
- ↑ Summers, Juana (July 20, 2011). "Candidates face off on Twitter". Politico. Retrieved June 27, 2012.
- ↑ Bakst, Brian (August 14, 2011). "Ex-Minn. Gov. Tim Pawlenty ends White House bid". The Huffington Post. Associated Press. Retrieved August 14, 2011.
- ↑ Reinhard, Beth (August 13, 2011). "Bachmann Boom; TPaw Bust?". National Journal. Retrieved August 14, 2011.
- ↑ "Libertarians nominate ex-Governor Gary Johnson for president". Reuters. May 5, 2012. Retrieved May 6, 2012.
- ↑ Riggs, Mike (May 5, 2012). "Judge Jim Gray Is the 2012 Libertarian Party Vice Presidential Nominee". Reason. Retrieved May 6, 2012.
- 1 2 "Mass. doctor Jill Stein wins Green Party's presidential nod". USA Today. Associated Press. July 14, 2012. Retrieved July 15, 2012.
- ↑ Kilar, Steve (July 14, 2012). "Green Party nominates Jill Stein for president at Baltimore convention". The Baltimore Sun. Retrieved July 15, 2012.
- ↑ Steinmetz, Katy (July 11, 2012) "The Green Team: Jill Stein's Third-Party Bid to Shake Up 2012", Time.com. Retrieved July 11, 2012.
- ↑ "Goode gets Constitution Party's nomination for president". The Roanoke Times. April 21, 2012. Retrieved April 22, 2012.
- ↑ "Constitution Party Convention Wrap-Up: vice Presidential Candidate and Officer Elections". Independent Political Report. April 21, 2012. Retrieved April 22, 2012.
- ↑ Gehrke, Robert (July 17, 2012). "Rocky picks activist-author as his VP running mate". The Salt Lake Tribune. Retrieved July 18, 2012.
- ↑ Schwarz, Hunter (January 13, 2012). "Rocky Anderson accepts his newly-formed party's presidential nomination". Deseret News. Retrieved February 1, 2012.
- ↑ "2012 BALLOT STATUS FOR PRESIDENT". Ballot-access.org. October 27, 2012. Retrieved July 7, 2013.
- ↑ Braun, Stephen (December 6, 2012). "$2 Billion Price Tag for Presidential Election". Associated Press. Retrieved December 9, 2012.
- ↑ Confessore, Nicholas (December 7, 2012). "Little to Show for Cash Flood by Big Donors". The New York Times. Retrieved December 9, 2012.
- ↑ Scherer, Michael (November 27, 2012). "Exclusive: Obama's 2012 Digital Fundraising Outperformed 2008". Time. Retrieved December 9, 2012.
- ↑ Hunt, Albert (October 14, 2012). "Barrage of Negative Ads May Haunt President-Elect". Bloomberg News. Retrieved December 9, 2012.
The hundreds of thousands of television commercials broadcast by the presidential candidates are lopsidedly negative; this is the case with 80 percent of those put out by President Barack Obama and 84 percent of those for Mitt Romney.
- ↑ Gold, Matea (January 5, 2014). "The players in the Koch-backed $400 million political donor network". The Washington Post. Retrieved May 9, 2015.
Americans for Prosperity , the Virginia-based nonprofit that finances grass-roots activities across the country and ran an early and relentless television ad assault against President Obama during the 2012 campaign.
- ↑ Boorstin, Julia (November 8, 2011). "Record Political Ad Spending Powered by Special Interests". CNBC. Retrieved April 30, 2015.
- ↑ Bathon, Michael (October 17, 2012). "Solyndra Lenders Ahead of Government Won't Recover Fully". Bloomberg Business. Retrieved November 14, 2014.
- ↑ Lacey, Stephen (November 28, 2011). "Koch-Fueled Americans for Prosperity Spends $2.4 Million on Solyndra Attack Ad". ThinkProgress. Center for American Progress. Retrieved May 10, 2015.
- ↑ Mullins, Brody (January 14, 2012). "Americans for Prosperity to Air Ads Slamming Obama's Ties to Solyndra". The Wall Street Journal. Washington Wire blog. Retrieved April 19, 2015.
- ↑ Winger, Richard (November 18, 2010) "2012 Constitution Party National Convention Set for Nashville", Ballot Access News. Retrieved November 29, 2010.
- ↑ Myers, Laura (November 30, 2010) "Las Vegas will host Libertarian convention" Las Vegas Review-Journal. Retrieved November 30, 2010.
- ↑ Cristina Silva (May 5, 2012). "Gary Johnson Wins 2012 Libertarian Nomination". The Huffington Post. Associated Press. Retrieved June 17, 2012.
- ↑ "Green Party National Convention will be in Baltimore". Ballot Access News. November 11, 2011. Retrieved November 12, 2011.
- ↑ Barr, Andy,; Mike Allen (May 12, 2010) "Republicans pick Tampa for 2012 convention", Politico. Retrieved May 13, 2010.
- ↑ Falcone, Michael (February 1, 2011). "2012 Democratic National Convention To Be Held In Charlotte, N.C.". ABC News. Archived from the original on September 1, 2012. Retrieved October 5, 2012.
- 1 2 3 4 Kiely, Kathy (October 31, 2011). "Fall 2012 Presidential Debates Set". National Journal. Retrieved October 31, 2011.
- 1 2 3 4 Blake, Aaron (August 13, 2012) "Presidential debate moderators announced: Crowley is first woman in 20 years", The Washington Post. Retrieved August 15, 2012.
- ↑ Little, Morgan (July 25, 2012) "Presidential debate formats announced, feature town hall", Los Angeles Times. Retrieved July 26, 2012.
- ↑ "Third-party candidates finally get their own presidential debate", The Washington Post. October 24, 2012. Retrieved February 11, 2013.
- 1 2 3 Sullivan, Sean (October 23, 2012). "Third-party candidates debate: United against Obama, Romney". The Seattle Times. Retrieved October 24, 2012.
- 1 2 "Larry King to moderate third-party debate". CBS News. Associated Press. October 17, 2012. Retrieved October 18, 2012.
- ↑ Falkenthal, Gayle (October 28, 2012). "Third party Presidential debate date changed to Nov. 5 due to Hurricane Sandy". The Washington Times. Retrieved October 29, 2012.
- ↑ Hicks, Josh (October 24, 2012). "Another third party debate in the works". The Washington Post. Retrieved October 25, 2012.
- ↑ "RT to host final US presidential third-party debate". RT. October 26, 2012. Archived from the original on October 27, 2012. Retrieved October 26, 2012.
- ↑ David A. Fahrenthold (February 16, 2012). "Mitt Romney reframes himself as a 'severely conservative' governor". The Washington Post.
- ↑ Mitt Romney's 'Severe Conservatism'. The Weekly Standard (September 18, 2012). Retrieved August 12, 2013.
- ↑ "Mitt Romney's 'severely' bad moves", CNN (February 13, 2012).
- ↑ Paul Krugman (February 13, 2012). "Severe Conservative Syndrome". The New York Times.
- ↑ "Rush On Romney @ CPAC: I Have Never Heard Anybody Say 'I'm Severely Conservative'". Daily Rushbo. February 10, 2012.
- ↑ "Gary Johnson's moment".
- ↑ "Romnesia". hcfama.org. Archived from the original on December 1, 2011.
- ↑ Kantrowitz, Alex (October 21, 2012). "#Romnesia: A Made for Social Media Attack Line". Forbes. Retrieved October 22, 2012.
- ↑ Romneyshambles, Part II The New Yorker, September 18, 2012
- ↑ 'Gangnam Style,' 'fiscal cliff,' 'Romneyshambles' chosen as Collins Dictionary's words of the year Daily News, December 20, 2012
- ↑ Congressional Record at H50 (January 4, 2013).
- ↑ "2012 Election Information". Retrieved February 25, 2013.
- ↑ "NYS Board of Elections President and Vice-President Election Returns Nov. 6, 2012" (PDF). Retrieved May 2, 2013.
- ↑ "Final Results". Retrieved February 25, 2013.
- ↑ "Wisconsin Fall 2012 General Election Results". Retrieved January 18, 2013.
- ↑ "State of Maine Certificate of Ascertainment of Electors" (PDF). Retrieved December 18, 2012.
- ↑ "Official Results of Nebraska General Election – November 6, 2012" (PDF). Retrieved December 26, 2012.
- ↑ Kranish, Michael (December 22, 2012). "The story behind Mitt Romney's loss in the presidential campaign to President Obama". Boston Globe. Archived from the original on May 28, 2013. Retrieved February 1, 2016.
- ↑ "The Real Reason for Karl Rove's Election Night Denial". January 21, 2014.
- ↑ "Adviser: Romney "shellshocked" by loss". CBS News. November 8, 2012. Retrieved November 10, 2012.
- ↑ "Romney's Transition Site". Political Wire. November 7, 2012. Archived from the original on November 8, 2012. Retrieved November 30, 2012.
- ↑ "Romney campaign spent $25,000 on fireworks". Boston Globe. November 9, 2012. Archived from the original on November 11, 2012. Retrieved November 11, 2012.
- ↑ Silver, Nate (December 1, 2012). "When Internal Polls Mislead, a Whole Campaign May Be to Blame". The New York Times. Retrieved December 21, 2012.
- ↑ "Exclusive: The Internal Polls That Made Mitt Romney Think He'd Win". The New Republic. November 30, 2012. Retrieved November 30, 2012.
- ↑ Rucker, Phillip (November 7, 2012). "Romney's belief in himself never wavered". The Washington Post. Retrieved November 30, 2012.
- ↑ Reeve, Elspeth (November 8, 2012). "The Whole Romney Ticket Believed in Unskewed Polls?". The Atlantic Wire. Retrieved December 17, 2012.
- ↑ Cheng, Jonathan (November 7, 2012). "Dow's 300-Point Slide Takes It Back to August Levels". The Wall Street Journal. Retrieved November 7, 2012.
- ↑ "S&P 500 closes above 1,500; Dow nears 14,000". USA Today. January 25, 2013. Retrieved June 22, 2016.
- ↑ Carrigg, David (May 19, 2015). "Dow: New high for second straight session". USA Today. Retrieved June 22, 2016.
- ↑ Cheng, Evelyn (July 17, 2015). "Nasdaq jumps to another record as Google surges". USA Today. Retrieved June 22, 2016.
- ↑ DeCambre, Mark (October 5, 2015). "Dow: New high for second straight session". USA Today. Retrieved June 22, 2016.
- ↑ Krogstad, Jens Manuel; Lopez, Mark Hugo; López, Gustavo; Passel, Jeffrey S.; Patten, Eileen (January 19, 2016). "1. Looking Forward to 2016: The Changing Latino Electorate".
- ↑ Krogstad, Jens Manuel; Lopez, Mark Hugo; López, Gustavo; Passel, Jeffrey S.; Patten, Eileen (January 19, 2016). "Millennials Make Up Almost Half of Latino Eligible Voters in 2016".
- ↑ "2016 electorate will be the most diverse in U.S. history". February 3, 2016.
- ↑ "27 Million Potential Hispanic Votes. But What Will They Really Add Up To?". September 18, 2016 – via The New York Times.
- ↑ "Fox News Exit Polls". Archived from the original on January 26, 2013. Retrieved January 27, 2013.
- ↑ "President Exit Polls". The New York Times. Retrieved January 27, 2013.
- ↑ Hum, Robert (November 7, 2012). "Two-Term Presidency Musings". CNBC. Archived from the original on July 29, 2013. Retrieved February 12, 2013.
- ↑ Dilanian, Ken (August 11, 2012) "Ryan pick cements lack of military service in presidential race", Los Angeles Times. Retrieved December 11, 2014.
- ↑ Nichols, John (November 9, 2012). "Obama's 3 Million Vote, Electoral College Landslide, Majority of States Mandate". The Nation. New York. Retrieved November 18, 2012.
- ↑ Giroux, Greg (January 4, 2013). "Final Tally Shows Obama First Since '56 to Win 51% Twice". Bloomberg. Retrieved February 12, 2013.
- ↑ Frank, Steve (January 7, 2014) "Obama first presidential candidate since Eisenhower to top 51% twice", MSNBC.com. Retrieved December 11, 2014.
- ↑ Gabbatt, Adam (October 19, 2012). "Romney poised to lose home state by wider margin than any other candidate". The Guardian. London. Retrieved February 12, 2013.
- ↑ Ostermeier, Eric (November 14, 2012). "20 Presidential Tickets That Lost Both Home States". Smart Politics (University of Minnesota blog). Retrieved February 12, 2013.
- ↑ "2012 Presidential General Election Data – Massachusetts by County". Dave Leip's U.S. Election Atlas. Retrieved March 8, 2013.
- ↑ "Presidential Election of 1856 – Map by counties". Atlas of U.S. Presidential Elections. Retrieved March 9, 2013.
- ↑ Ostermeier, Eric (November 14, 2012). "20 Presidential Tickets That Lost Both Home States". Smart Politics.
- ↑ Blow, Charles M. (November 9, 2012) "Election Data Dive", The New York Times. Retrieved December 11, 2014.
- ↑ Harwood, John. "Donald Trump Takes Advantage of a Republican Party Pitted Against Itself." New York Times. 6 October 2016. 6 October 2016.
- ↑ Harrington, Gerry (November 8, 2012). "Libertarian Party buoyant; Greens hopeful". United Press International. Retrieved February 12, 2013.
- ↑ Wood, Daniel (November 30, 2015). "Harvard Grad Jill Stein Faces Uphill Battle for Presidency". The Harvard Crimson.
- ↑ Herzog, Katie (March 14, 2016). "Meet the presidential candidate who makes Bernie Sanders look conservative". Grist Magazine.
- ↑ "Numbers Show Obama's Narrow Re-Election Was No Popular Mandate". LifeNews.com. Retrieved May 14, 2016.
Further reading
- Gardner, Liz, et al. "Press Coverage of the 2012 US Presidential Election: A Multinational, Cross-Language Comparison". in Die US-Präsidentschaftswahl 2012 (Springer Fachmedien Wiesbaden, 2016). pp 241–267.
- Hansen, Wendy L., Michael S. Rocca, and Brittany Leigh Ortiz. "The effects of Citizens United on corporate spending in the 2012 presidential election". Journal of Politics 77.2 (2015): 535-545. in JSTOR
- Heilemann, John; Halperin, Mark (2013). Double Down: Game Change 2012. New York: Penguin Press. ISBN 1594204403.
- Masket, Seth, John Sides, and Lynn Vavreck. "The Ground Game in the 2012 Presidential Election". Political Communication (2015) 33#2 pp: 1-19.
- Mayer, William G.; Bernstein, Jonathan, eds. (2012). The Making of the Presidential Candidates, 2012. Rowman & Littlefield. ISBN 978-1-4422-1170-4. Scholars explore nominations in the post-public-funding era, digital media and campaigns, television coverage, and the Tea Party.
- Miller, William J., ed. The 2012 Nomination and the Future of the Republican Party: The Internal Battle (Lexington Books; 2013) 265 pages; essays by experts on Romney and each of his main rivals
- Nelson, Michael, ed. The Elections of 2012 (2013) excerpt and text search; topical essays by experts
- Sides, John, and Lynn Vavreck. The Gamble: Choice and Chance in the 2012 Presidential Election (Princeton U.P. 2013) excerpt and text search
- Stempel III, Guido H. and Thomas K. Hargrove, eds. The 21st-Century Voter: Who Votes, How They Vote, and Why They Vote (2 vol. 2015).
External links
- 2012 Presidential Form 2 Filers at the Federal Election Commission (FEC)
- Election 2012 Presidential Primaries, Caucuses, and Conventions
- United States presidential election, 2012 at DMOZ
- 2012 Interactive Electoral Map
- Election of 2012 in Counting the Votes
| Political activities |
|  |
|---|---|---|
| Family |
| |
| Politics |
|  |
|---|---|---|
| Business | ||
| Olympics | ||
| Books | ||
| Family | ||
| ||