Waiariki (New Zealand electorate)
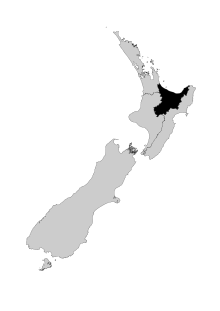
Waiariki is a New Zealand parliamentary Māori electorate that was first established for the 1999 election. Since the 2005 election, it has been held by Te Ururoa Flavell MP.[1]
Population centres
The electorate includes the following population centres:
In the 2013/14 redistribution, a minor boundary adjustment was undertaken. A small area, including the village of Tuia, was transferred to Waiariki from the Ikaroa-Rāwhiti electorate.[2]
Tribal areas
The electorate includes the following tribal areas:
- Ngāti Ranginui
- Ngāi Te Rangi
- Te Arawa
- Ngāti Awa
- Ngāi Tūhoe
- Whakatohea
- Ngāi Tai
- Te Whānau-ā-Apanui
- Ngāti Kahungunu ki Wairoa
- Ngāti Tūwharetoa
History
The electorate was created for the 1999 election. The first representative was Mita Ririnui of the Labour Party, with Tuariki Delamere (Te Tawharau) coming second, Arapeta Tahana (Alliance) coming third and Kahukore Baker (New Zealand First) coming fourth.[3]
In the 2002 election, Ririnui was confirmed with 61.93% of the electorate vote. Rihi Vercoe and Hamuera Mitchell of Mana Māori and the National Party came second and third, respectively.[3]
In the 2005 election, Ririnui was beaten by Te Ururoa Flavell of the Māori Party. Hawea Vercoe of Destiny New Zealand came a distant third.[4] The 2008 election was contested by two contenders: the incumbent and Ririnui. Flavell was once again confirmed.[5]
The 2011 election was contested by three contenders: Flavell, Annette Sykes of the Mana Party and Louis Te Kani of the Labour Party. Flavell had a comfortable lead over Sykes, with Te Kani coming third.[6] In the 2014 election, Flavell gained a much increased majority.[7]
Members of Parliament
Key
| Election | Winner | |
|---|---|---|
| 1999 election | Mita Ririnui | |
| 2002 election | ||
| 2005 election | Te Ururoa Flavell | |
| 2008 election | ||
| 2011 election | ||
| 2014 election | ||
List MPs
Members of Parliament elected from party lists in elections where that person also unsuccessfully contested the Waiariki electorate. Unless otherwise stated, all MPs terms began and ended at general elections.
| Election | Winner | |
|---|---|---|
| 2005 election | Mita Ririnui | |
| 2008 election | Mita Ririnui | |
Election results
2011 election
| General election 2011: Waiariki[6] | |||||||||
|---|---|---|---|---|---|---|---|---|---|
|
Notes: Green background denotes the winner of the electorate vote.
| |||||||||
| Party | Candidate | Votes | % | ±% | Party Votes | % | ±% | ||
| Māori | |
7,651 | 43.05 | -25.12 | 3,989 | 21.21 | -14.05 | ||
| Mana | Annette Sykes | 5,768 | 32.45 | +32.45 | 3,125 | 16.62 | +16.62 | ||
| Labour | Louis Te Kani | 4,355 | 24.50 | -7.33 | 6,591 | 35.05 | -10.52 | ||
| NZ First | 2,058 | 10.94 | +3.14 | ||||||
| Green | 1,663 | 8.84 | +6.19 | ||||||
| National | 1,068 | 5.68 | +0.18 | ||||||
| Legalise Cannabis | 201 | 1.07 | +0.14 | ||||||
| Conservative | 57 | 0.30 | +0.30 | ||||||
| ACT | 28 | 0.15 | -0.07 | ||||||
| United Future | 22 | 0.12 | -0.02 | ||||||
| Alliance | 2 | 0.01 | -0.02 | ||||||
| Libertarianz | 2 | 0.01 | -0.01 | ||||||
| Democrats | 1 | 0.01 | -0.005 | ||||||
| Informal votes | 993 | 465 | |||||||
| Total Valid votes | 17,774 | 18,807 | |||||||
| Māori hold | Majority | 1,883 | 10.59 | -25.74 | |||||
Electorate (as at 26 November 2011): 33,240[8]
2008 election
| General election 2008: Waiariki[5] | |||||||||
|---|---|---|---|---|---|---|---|---|---|
|
Notes: Green background denotes the winner of the electorate vote.
| |||||||||
| Party | Candidate | Votes | % | ±% | Party Votes | % | ±% | ||
| Māori | |
12,781 | 68.17 | +13.59 | 6,890 | 35.26 | +4.47 | ||
| Labour | Mita Ririnui | 5,969 | 31.83 | -7.67 | 8,903 | 45.57 | -7.54 | ||
| NZ First | 1,525 | 7.80 | +1.12 | ||||||
| National | 1,075 | 5.50 | +2.67 | ||||||
| Green | 518 | 2.65 | +0.35 | ||||||
| Family Party | 205 | 1.05 | +1.05 | ||||||
| Legalise Cannabis | 182 | 0.93 | +0.29 | ||||||
| Kiwi | 57 | 0.29 | +0.29 | ||||||
| Bill and Ben | 47 | 0.24 | +0.24 | ||||||
| ACT | 42 | 0.21 | +0.10 | ||||||
| Progressive | 28 | 0.14 | -0.10 | ||||||
| United Future | 26 | 0.13 | -0.32 | ||||||
| Workers Party | 13 | 0.07 | +0.07 | ||||||
| Pacific | 9 | 0.05 | +0.05 | ||||||
| Alliance | 6 | 0.03 | ±0.00 | ||||||
| RAM | 6 | 0.03 | +0.03 | ||||||
| Libertarianz | 4 | 0.02 | +0.02 | ||||||
| Democrats | 2 | 0.01 | -0.01 | ||||||
| RONZ | 1 | 0.01 | -0.01 | ||||||
| Informal votes | 675 | 366 | |||||||
| Total Valid votes | 18,750 | 19,539 | |||||||
| Turnout | 20,614 | 64.54 | -4.89 | ||||||
| Māori hold | Majority | 6,812 | 36.33 | +21.25 | |||||
2005 election
| General election 2005: Waiariki[4] | |||||||||
|---|---|---|---|---|---|---|---|---|---|
|
Notes: Green background denotes the winner of the electorate vote.
| |||||||||
| Party | Candidate | Votes | % | ±% | Party Votes | % | ±% | ||
| Māori | Te Ururoa Flavell | 10,392 | 54.58 | 6,104 | 30.79 | ||||
| Labour | |
7,521 | 39.50 | -22.43 | 10,530 | 53.11 | +0.18 | ||
| Destiny | Hawea Vercoe | 1,126 | 5.91 | 528 | 2.66 | ||||
| NZ First | 1,324 | 6.68 | -9.85 | ||||||
| National | 562 | 2.83 | -0.91 | ||||||
| Green | 457 | 2.30 | -7.67 | ||||||
| Legalise Cannabis | 126 | 0.64 | -2.03 | ||||||
| United Future | 89 | 0.45 | -2.28 | ||||||
| Progressive | 48 | 0.24 | -0.62 | ||||||
| ACT | 22 | 0.11 | -0.44 | ||||||
| Family Rights | 10 | 0.05 | |||||||
| Christian Heritage | 7 | 0.04 | -1.23 | ||||||
| Alliance | 5 | 0.03 | -1.66 | ||||||
| One NZ | 4 | 0.02 | -0.05 | ||||||
| RONZ | 4 | 0.02 | |||||||
| 99 MP | 3 | 0.02 | |||||||
| Democrats | 3 | 0.02 | |||||||
| Direct Democracy | 1 | 0.01 | |||||||
| Libertarianz | 0 | 0.00 | |||||||
| Informal votes | 655 | 322 | |||||||
| Total Valid votes | 19,039 | 19,827 | |||||||
| Turnout | 20,794 | 69.43 | +11.74 | ||||||
| Māori gain from Labour | Majority | 2,871 | 15.08 | ||||||
2002 election
| General election 2002: Waiariki[3] | |||||||||
|---|---|---|---|---|---|---|---|---|---|
|
Notes: Green background denotes the winner of the electorate vote.
| |||||||||
| Party | Candidate | Votes | % | ±% | Party Votes | % | ±% | ||
| Labour | |
9,361 | 61.93 | +16.82 | 8,322 | 52.93 | -1.99 | ||
| Mana Māori | Rihi Vercoe | 2,644 | 17.49 | 947 | 6.02 | -2.41 | |||
| National | Hamuera Mitchell | 1,356 | 8.97 | +5.28 | 588 | 3.74 | -0.85 | ||
| United Future | Huikakahu Kawe | 852 | 5.64 | +3.99 | 429 | 2.73 | +1.541 | ||
| Alliance | Sharon Heta | 542 | 3.59 | -9.10 | 265 | 1.69 | -4.17 | ||
| Christian Heritage | Judith Francis | 361 | 2.39 | 199 | 1.27 | +0.38 | |||
| NZ First | 2,599 | 16.53 | +1.33 | ||||||
| Green | 1,568 | 9.97 | +6.32 | ||||||
| Legalise Cannabis | 420 | 2.67 | +0.15 | ||||||
| ORNZ | 147 | 0.93 | |||||||
| Progressive | 136 | 0.86 | |||||||
| ACT | 87 | 0.55 | +0.03 | ||||||
| One NZ | 11 | 0.07 | +0.04 | ||||||
| NMP | 5 | 0.03 | +0.02 | ||||||
| Informal votes | 529 | 186 | |||||||
| Total Valid votes | 15,116 | 15,723 | |||||||
| Turnout | 16,309 | 57.69 | |||||||
| Labour hold | Majority | 6,717 | 44.44 | +19.34 | |||||
1 United Future swing is compared to 1999 results from both United NZ and Future NZ combined, as the two merged in 2000.
1999 election
| General election 1999: Waiariki[3] | |||||||||
|---|---|---|---|---|---|---|---|---|---|
|
Notes: Green background denotes the winner of the electorate vote.
| |||||||||
| Party | Candidate | Votes | % | ±% | Party Votes | % | ±% | ||
| Labour | Mita Ririnui | 7,853 | 45.11 | 9,670 | 54.92 | ||||
| Te Tawharau | Tuariki Delamere[note 1] | 3,484 | 20.01 | ||||||
| Alliance | Arapeta Tahana | 2,210 | 12.69 | 1,032 | 5.86 | ||||
| NZ First | Kahukore Baker | 2,139 | 12.29 | 2,676 | 15.20 | ||||
| National | George Ngatai | 643 | 3.69 | 809 | 4.59 | ||||
| Mana Wahine | Manu Kopa | 296 | 1.70 | ||||||
| Future NZ | Toa Faulkner | 288 | 1.65 | 202 | 1.16 | ||||
| Freedom Movement | Helen Wepiha-Tai | 204 | 1.17 | 41 | 0.24 | ||||
| Mana Māori | 1,469 | 8.43 | |||||||
| Green | 643 | 3.65 | |||||||
| Legalise Cannabis | 439 | 2.52 | |||||||
| Mauri Pacific | 302 | 1.73 | |||||||
| Christian Heritage | 155 | 0.89 | |||||||
| ACT | 92 | 0.52 | |||||||
| Animals First | 21 | 0.12 | |||||||
| Libertarianz | 14 | 0.08 | |||||||
| Natural Law | 11 | 0.06 | |||||||
| McGillicuddy Serious | 9 | 0.05 | |||||||
| People's Choice | 8 | 0.05 | |||||||
| United NZ | 6 | 0.03 | |||||||
| One NZ | 5 | 0.03 | |||||||
| NMP | 1 | 0.01 | |||||||
| Republican | 1 | 0.01 | |||||||
| South Island | 1 | 0.01 | |||||||
| Informal votes | 528 | 330 | |||||||
| Total Valid votes | 17,409 | 17,607 | |||||||
| Labour win new seat | Majority | 4,369 | 25.10 | ||||||
- ↑ Te Tawharau contested the electorate vote independently, but encouraged voters to give their party vote to Mana Māori
References
- ↑ "Te Ururoa Flavell". New Zealand Parliament. Retrieved 3 December 2011.
- ↑ Report of the Representation Commission 2014 (PDF). Representation Commission. 4 April 2014. p. 11. ISBN 978-0-477-10414-2. Retrieved 1 October 2014.
- 1 2 3 4 "Electorate Profile Waiariki" (PDF). Parliamentary Library. October 2005. Retrieved 3 December 2011.
- 1 2 "Official Count Results -- Waiariki". Chief Electoral Office, Wellington. Retrieved 3 December 2011.
- 1 2 "Official Count Results -- Waiariki". Chief Electoral Office, Wellington. Retrieved 3 December 2011.
- 1 2 "Official Count Results -- Waiariki". Electoral Commission. 10 December 2011. Retrieved 3 October 2014.
- ↑ "Official Count Results -- Waiariki". Electoral Commission. 21 September 2014. Retrieved 3 October 2014.
- ↑ "Enrolment statistics". Electoral Commission. 26 November 2011. Retrieved 28 November 2011.
Coordinates: 37°59′00″S 177°00′00″E / 37.9833°S 177.0000°E