Atmospheric noise
Atmospheric noise is radio noise caused by natural atmospheric processes, primarily lightning discharges in thunderstorms. On a worldwide scale, there are about 40 lightning flashes per second – ≈3.5 million lightning discharges per day.[1]
History
In 1925, AT&T Bell Laboratories started investigating the sources of noise in its transatlantic radio telephone service.[2]
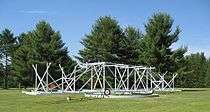
Karl Jansky, a 22-year-old researcher, undertook the task. By 1930, a radio antenna for a wavelength of 14.6 meters was constructed in Holmdel, NJ, to measure the noise in all directions. Jansky recognized three sources of radio noise.[3] The first (and strongest) source was local thunderstorms. The second source was weaker noise from more distant thunderstorms. The third source was a still weaker hiss that turned out to be galactic noise from the center of the Milky Way. Jansky's research made him the father of radio astronomy.[4]
Lightning
Atmospheric noise is radio noise caused by natural atmospheric processes, primarily lightning discharges in thunderstorms. It is mainly caused by cloud-to-ground flashes as the current is much stronger than that of cloud-to-cloud flashes. On a worldwide scale, 3.5 million lightning flashes occur daily. This is about 40 lightning flashes per second.[1]
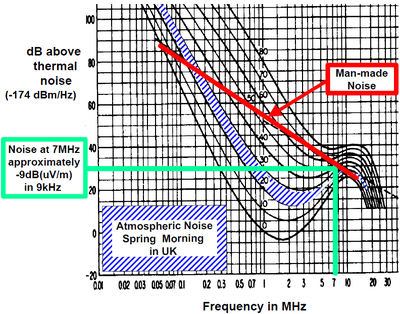
The sum of all these lightning flashes results in atmospheric noise. It can be observed,[5] with a radio receiver, in the form of a combination of white noise (coming from distant thunderstorms) and impulse noise (coming from a near thunderstorm). The power-sum varies with seasons and nearness of thunderstorm centers.
Although lightning has a broad-spectrum emission, its noise power increases with decreasing frequency. Therefore, at very low frequency and low frequency, atmospheric noise often dominates, while at high frequency, man-made noise dominates in urban areas.
Survey
From 1960s to 1980s, a worldwide effort was made to measure the atmospheric noise and variations. Results have been documented in CCIR Report 322.[6][7] CCIR 322 provided seasonal world maps showing the expected values of the atmospheric noise figure Fa at 1 MHz during four hour blocks of the day. Another set of charts relates the Fa at 1 MHz to other frequencies. CCIR Report 322 has been superseded by ITU P.372[8] publication.
Random number generation
Atmospheric noise and variation is also used to generate high quality random numbers.[9] Random numbers have interesting applications in the security domain.[10]
See also
Footnotes
- 1 2 "Annual Lightning Flash Rate Map". Science On a Sphere. NOAA. Retrieved 15 May 2014.
- ↑ Singh 2005, pp. 402–408
- ↑ Singh 2005, pp. 404–405
- ↑ Singh 2005, p. 406
- ↑ Sample of atmospheric noise "Archived copy". Archived from the original on 2005-12-18. Retrieved 2008-03-14.
- ↑ International Radio Consultative Committee (1968), Characteristics and Applications of Atmospheric Radio Noise Data, Geneva: International Telecommunications Union, CCIR Report 322-3; first CCIR Report 322 was 1963; revised; second is ISBN 92-61-01741-X.
- ↑ Lawrence, D. C. (June 1995), CCIR Report 322 Noise Variation Parameters, San Diego, CA: Naval Command, Control and Ocean Surveillance Center, RDT&E Division, NRaD Technical Document 2813, archived from the original on 2009-11-13; also DTIC
- ↑ ITU, Recommendation P.372: Radio Noise http://www.itu.int/rec/R-REC-P.372/en
- ↑ Haahr, Mads, Introduction to Randomness and Random Numbers, random.org, retrieved November 14, 2011, self-published.
- ↑ http://www.random.org/
References
- Singh, Simon (2005), Big Bang: The Origin of the Universe, Harper Perrennial, ISBN 978-0-00-716221-5
- Spaulding, Arthur D.; Washburn, James S. (April 1985), Atmospheric Radio Noise: Worldwide Levels and Other Characteristics, NTIA Report TR-85-173, Boulder, CO: U. S. Department of Commerce, National Telecommunications & Information Administration, Institute for Telecommunications Sciences