Cambridge City Council election, 2011

Elections for Cambridge City Council (in Cambridge, England) were held on Thursday 5 May 2011. As the council is elected by thirds, one seat in each of the wards was up for election, with the exception of Cherry Hinton ward where two seats were up for election due to the early retirement of Councillor Stuart Newbold. The vote took place alongside the United Kingdom Alternative Vote referendum, 2011 and a Cambridgeshire County Council by-election for Arbury ward.
Election result

| Cambridge City Council election result 2011 | ||||||||||
|---|---|---|---|---|---|---|---|---|---|---|
| Party | Seats | Gains | Losses | Net gain/loss | Seats % | Votes % | Votes | +/− | ||
| Labour | 9 | 4 | 0 | +4 | 60.0 | 34.3 | 13,762 | +12.1 | ||
| Liberal Democrat | 6 | 0 | 4 | -4 | 40.0 | 27.8 | 9,844 | -10.0 | ||
| Conservative | 0 | 0 | 0 | 0 | 0.0 | 20.8 | 8,326 | -1.7 | ||
| Green | 0 | 0 | 0 | 0 | 0.0 | 15.1 | 6,045 | -0.9 | ||
| TUSC | 0 | 0 | 0 | 0 | 0.0 | 1.0 | 455 | +0.1 | ||
| UKIP | 0 | 0 | 0 | 0 | 0.0 | 0.5 | 193 | +0.1 | ||
| Independent | 0 | 0 | 0 | 0 | 0.0 | 0.4 | 138 | +0.4 | ||
This result has the following consequences for the total number of seats on the Council after the elections:
| Party | Previous council | New council | |||
|---|---|---|---|---|---|
| Liberal Democrats | 29 | 25 | |||
| Labour | 10 | 14 | |||
| Green | 2 | 2 | |||
| Independent | 1 | 1 | |||
| Conservatives | 0 | 0 | |||
| Trade Unionist & Socialist | 0 | 0 | |||
| UKIP | 0 | 0 | |||
| Total | 42 | 42 | |||
| Working majority | 16 | 8 | |||
The Liberal Democrats retained control of the council, albeit with a reduced majority.
Ward results
Note: in results where, in previous elections, two seats were up for election the party share of the vote is based on an average for those candidates who stood for that particular party in the election.
Changes in party vote is in comparison with the 2010 Cambridge City Council election results.[3]
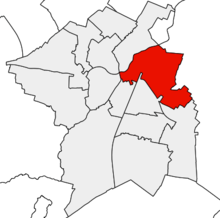
Abbey ward
Councillor Caroline Hart was defending her Abbey seat for the Labour Party.
| Party | Candidate | Votes | % | ± | |
|---|---|---|---|---|---|
| Labour | Caroline Hart | 1,057 | 41.8 | +19.0 | |
| Green | Brett Hughes | 796 | 31.5 | +1.8 | |
| Conservative | Craig Thomas | 414 | 16.4 | -4.0 | |
| Liberal Democrat | Christopher Brown | 260 | 10.3 | -16.9 | |
| Majority | 261 | 10.3 | |||
| Rejected ballots | 22 | ||||
| Turnout | 2,527 | 37.5 | |||
| Labour hold | Swing | +8.6 | |||
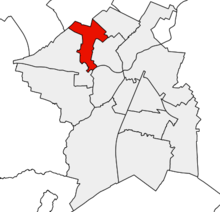
Arbury ward
Councillor Alan Levy was defending his Arbury seat for the Liberal Democrats.
| Party | Candidate | Votes | % | ± | |
|---|---|---|---|---|---|
| Labour | Carina O'Reilly | 1,310 | 40.5 | +13.5 | |
| Liberal Democrat | Alan Levy | 1,015 | 31.4 | -7.5 | |
| Conservative | Ali Meftah | 448 | 13.8 | -5.5 | |
| Green | Stephen Lawrence | 377 | 11.6 | -3.2 | |
| UKIP | Albert Watts | 87 | 2.7 | +2.7 | |
| Majority | 295 | 9.1 | |||
| Rejected ballots | 35 | ||||
| Turnout | 3,237 | 47.8 | |||
| Labour gain from Liberal Democrat | Swing | +10.5 | |||
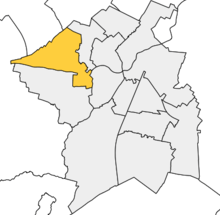
Castle ward
Councillor Tania Zmura retired her seat. Philip Tucker was aiming to retain the vacated seat for the Liberal Democrats.
| Party | Candidate | Votes | % | ± | |
|---|---|---|---|---|---|
| Liberal Democrat | Philip Tucker | 973 | 33.6 | -11.1 | |
| Labour | Ashley Walsh | 728 | 25.2 | +9.8 | |
| Conservative | Philip Salway | 620 | 21.4 | -0.4 | |
| Green | Jack Toye | 572 | 19.8 | +1.8 | |
| Majority | 254 | 8.5 | |||
| Rejected ballots | 67 | {{{change}}} | |||
| Turnout | 2,893 | 43.7 | |||
| Liberal Democrat hold | Swing | -10.5 | |||
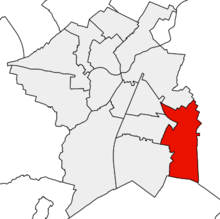
Cherry Hinton ward
Due to the retirement of Labour Party Councillor Stuart Newbold, two seats were up for election. Councillor Russ McPherson was defending his seat for the Labour Party.
| Party | Candidate | Votes | % | ± | |
|---|---|---|---|---|---|
| Labour | Mark Ashton | 1,525 | 51.5 | +13.1 | |
| Labour | Russ McPherson | 1,464 | 49.4 | +11.0 | |
| Conservative | Anthony Turnham | 880 | 29.7 | +0.3 | |
| Conservative | Timothy Haire | 865 | 29.2 | -0.2 | |
| Green | Jane Esgate | 304 | 10.3 | +2.5 | |
| Green | Neil Ford | 267 | 9.0 | +1.2 | |
| Liberal Democrat | Keith Edkins | 246 | 8.3 | -16.1 | |
| Liberal Democrat | Joe Ryan | 205 | 6.9 | -17.5 | |
| Majority | 584 | 19.7 | |||
| Rejected ballots | 19 | ||||
| Turnout | 5,756 | 45.8 | |||
| Labour hold | Swing | +6.5 | |||
| Labour hold | Swing | +5.5 | |||
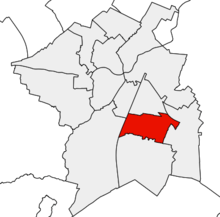
Coleridge ward
Councillor Jeremy Benstead was defending his Coleridge seat for the Labour Party.
| Party | Candidate | Votes | % | ± | |
|---|---|---|---|---|---|
| Labour | Jeremy Benstead | 1,346 | 46.9 | +14.6 | |
| Conservative | Andrew Bower | 869 | 30.3 | +1.9 | |
| Green | Valerie Hopkins | 368 | 12.8 | +1.9 | |
| Liberal Democrat | Thomas Yates | 285 | 9.9 | -15.6 | |
| Majority | 477 | 16.6 | |||
| Rejected ballots | 27 | {{{change}}} | |||
| Turnout | 2,868 | 45.5 | |||
| Labour hold | Swing | +6.4 | |||
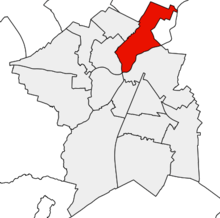
East Chesterton ward
Councillor Clare Blair was defending her East Chesterton seat for the Liberal Democrats.
| Party | Candidate | Votes | % | ± | |
|---|---|---|---|---|---|
| Labour | Gerri Bird | 1,133 | 38.4 | +18.2 | |
| Liberal Democrat | Clare Blair | 912 | 30.9 | -3.5 | |
| Conservative | Kevin Francis | 488 | 16.5 | -5.7 | |
| Green | Peter Pope | 312 | 10.7 | -4.4 | |
| UKIP | Peter Burkinshaw | 106 | 3.6 | +3.6 | |
| Majority | 221 | 7.5 | |||
| Rejected ballots | 32 | {{{change}}} | |||
| Turnout | 2,951 | 44.7 | |||
| Labour gain from Liberal Democrat | Swing | +10.9 | |||
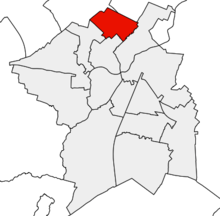
King's Hedges ward
Councillor Mike Pitt was defending his King's Hedges seat for the Liberal Democrats.
| Party | Candidate | Votes | % | ± | |
|---|---|---|---|---|---|
| Labour | Kevin Price | 905 | 40.0 | +11.0 | |
| Liberal Democrat | Mike Pitt | 729 | 32.3 | -4.0 | |
| Conservative | Annette Karimi | 390 | 17.3 | -6.6 | |
| Independent | Ian Tyes | 138 | 6.1 | +6.1 | |
| TUSC | Martin Booth | 99 | 4.4 | +2.1 | |
| Majority | 175 | 7.7 | |||
| Rejected ballots | 21 | {{{change}}} | |||
| Turnout | 2,261 | 36.9 | |||
| Labour gain from Liberal Democrat | Swing | +7.5 | |||
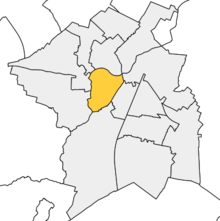
Market ward
Councillor Michael Dixon retired his seat. Andrea Reiner was aiming to retain the vacated seat for the Liberal Democrats.
| Party | Candidate | Votes | % | ± | |
|---|---|---|---|---|---|
| Liberal Democrat | Andrea Reiner | 754 | 28.0 | -15.0 | |
| Labour | Oliver Holbrook | 665 | 24.7 | +10.2 | |
| Green | Alexandra Collis | 651 | 24.2 | +4.4 | |
| Conservative | Jeremy Waller | 620 | 23.0 | +0.3 | |
| Majority | 89 | 3.3 | |||
| Rejected ballots | 59 | {{{change}}} | |||
| Turnout | 2,690 | 41.5 | |||
| Liberal Democrat hold | Swing | -12.6 | |||
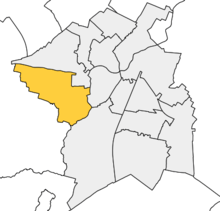
Newnham ward
Councillor Julie Smith was defending her Newnham seat for the Liberal Democrats.
| Party | Candidate | Votes | % | ± | |
|---|---|---|---|---|---|
| Liberal Democrat | Julie Smith | 990 | 35.2 | -9.7 | |
| Labour | Richard Johnson | 756 | 26.9 | +11.3 | |
| Conservative | Joanna Anscombe-Bell | 621 | 22.1 | -1.9 | |
| Green | James Youd | 443 | 15.8 | +0.3 | |
| Majority | 234 | 8.3 | |||
| Rejected ballots | 52 | {{{change}}} | |||
| Turnout | 2,810 | 43.2 | |||
| Liberal Democrat hold | Swing | -10.5 | |||
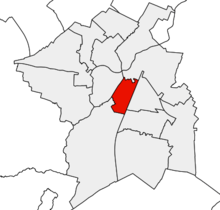
Petersfield ward
Councillor Lucy Walker retired her Petersfield seat. Kevin Blencowe was aiming to retain the vacated seat for the Labour Party.
| Party | Candidate | Votes | % | ± | |
|---|---|---|---|---|---|
| Labour | Kevin Blencowe | 1,353 | 48.9 | +21.2 | |
| Liberal Democrat | Zoe O'Connell | 594 | 21.5 | -11.9 | |
| Green | Shayne Mitchell | 481 | 17.4 | -2.1 | |
| Conservative | Shapour Meftah | 340 | 12.3 | -1.4 | |
| Majority | 759 | 27.4 | |||
| Rejected ballots | 25 | {{{change}}} | |||
| Turnout | 2,768 | 49.9 | |||
| Labour hold | Swing | +16.6 | |||
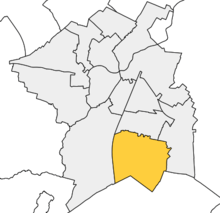
Queen Edith's ward
Councillor Viki Sanders retired her Queen Edith's seat. George Pippas was aiming to retain the vacated seat for the Liberal Democrats.
| Party | Candidate | Votes | % | ± | |
|---|---|---|---|---|---|
| Liberal Democrat | George Pippas | 1,318 | 41.1 | -7.9 | |
| Conservative | Vince Marino | 830 | 25.9 | -2.2 | |
| Labour | Sue Birtles | 642 | 20.0 | +7.6 | |
| Green | Brian Westcott | 416 | 13.0 | +5.3 | |
| Majority | 488 | 15.2 | |||
| Rejected ballots | 24 | {{{change}}} | |||
| Turnout | 3,206 | 49.9 | |||
| Liberal Democrat hold | Swing | -2.8 | |||
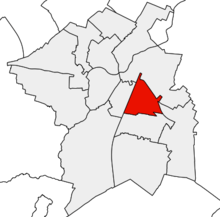
Romsey ward
Councillor Raj Shah was defending his Romsey seat for the Liberal Democrats.
| Party | Candidate | Votes | % | ± | |
|---|---|---|---|---|---|
| Labour | Zoe Moghadas | 996 | 33.3 | +11.4 | |
| Liberal Democrat | Raj Shah | 870 | 29.1 | -9.0 | |
| Green | Jamie Gibson | 411 | 13.7 | -2.7 | |
| Conservative | Sam Barker | 360 | 12.0 | -2.1 | |
| TUSC | Tom Woodcock | 356 | 11.9 | +2.4 | |
| Majority | 126 | 4.2 | |||
| Rejected ballots | 18 | {{{change}}} | |||
| Turnout | 2,993 | 46.0 | |||
| Labour gain from Liberal Democrat | Swing | +10.2 | |||
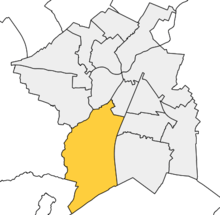
Trumpington ward
Councillor Andy Blackhurst was defending his Trumpington seat for the Liberal Democrats.
| Party | Candidate | Votes | % | ± | |
|---|---|---|---|---|---|
| Liberal Democrat | Andy Blackhurst | 991 | 36.1 | -7.1 | |
| Conservative | John Ionides | 869 | 31.7 | +0.4 | |
| Labour | Kenny Latunde-Dada | 481 | 17.5 | +3.3 | |
| Green | Ceri Galloway | 401 | 14.6 | +3.3 | |
| Majority | 122 | 4.4 | |||
| Rejected ballots | 24 | {{{change}}} | |||
| Turnout | 2,742 | 40.6 | |||
| Liberal Democrat hold | Swing | -3.8 | |||
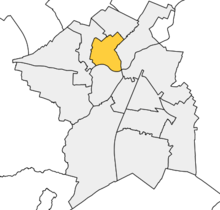
West Chesterton ward
Councillor Damien Tunnacliffe was defending his West Chesterton seat for the Liberal Democrats.
| Party | Candidate | Votes | % | ± | |
|---|---|---|---|---|---|
| Liberal Democrat | Damien Tunnacliffe | 1,225 | 38.5 | -1.1 | |
| Labour | Mike Sargeant | 866 | 27.2 | +7.8 | |
| Conservative | Robert Yeatman | 577 | 18.1 | +2.0 | |
| Green | Stephen Lintott | 513 | 16.1 | -5.5 | |
| Majority | 359 | 11.3 | |||
| Rejected ballots | 27 | {{{change}}} | |||
| Turnout | 3,181 | 52.3 | |||
| Liberal Democrat hold | Swing | -4.5 | |||
Cambridgeshire County Council by-election for Arbury division
Arbury division
Following the retirement of County Councillor Rupert Moss-Eccardt, the Cambridgeshire County Council seat for Arbury was vacant. Amy Ellis was aiming to retain the seat for the Liberal Democrats.
| Party | Candidate | Votes | % | ± | |
|---|---|---|---|---|---|
| Labour | Paul Sales | 1,214 | 37.5 | +8.9 | |
| Liberal Democrat | Amy Ellis | 1,078 | 33.7 | -8.3 | |
| Conservative | Shapour Meftah | 496 | 15.5 | -0.3 | |
| Green | Martin Bonner | 411 | 12.8 | -0.4 | |
| Majority | 136 | 4.3 | |||
| Rejected ballots | 35 | {{{change}}} | |||
| Turnout | 3,199 | 47.2 | |||
| Labour gain from Liberal Democrat | Swing | +8.6 | |||
Alternative Vote referendum result for Cambridge
Cambridge was one of the few areas of the country that voted "yes" for the Alternative Vote in the referendum held on May 5th 2011. The result was as follows:
References
- ↑ "Election results by wards, 5th May 2011". Cambridge City Council website. Cambridge City Council. Retrieved 13 May 2011.
- ↑ "Cambridge Local Elections Party Totals". Cambridge City Election Results. Colin Rosenstiel, Keith Edkins. Retrieved 13 May 2011.
- ↑ "Cambridge City Election Results". Cambridge City Election Results. Colin Rosenstiel & Keith Edkins. Retrieved 13 May 2011.