South Cambridgeshire District Council election, 2016


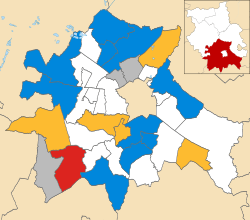
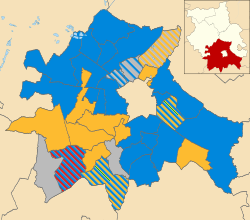
Elections to South Cambridgeshire District Council took place on Thursday 5 May 2016[1] as part of the United Kingdom local elections, 2016. Nineteen seats, making up one third of South Cambridgeshire District Council, were up for election. Seats up for election in 2016 were last contested at the 2012 election.
Summary
The list of candidates was published on 8 April 2016.[2] The Conservative Party and the Labour Party stood candidates in all 19 wards up for election. The Liberal Democrats had 16 candidates, the Green Party had 12 candidates and the United Kingdom Independence Party had four candidates. There were four independent candidates.
This was the last election by thirds to South Cambridgeshire District Council before the council moves to all-out elections starting from 2018.[3]
Results
| South Cambridgeshire District Council election, 2016[4] | |||||||
|---|---|---|---|---|---|---|---|
| Party | Seats | Popular vote | |||||
| Won | Not up | Total | ± | Votes | % | ||
| Conservative | 10 | 26 | 36 | −1 | 11,753 | 38.1 | |
| Liberal Democrats | 5 | 9 | 14 | +3 | 6,902 | 22.4 | |
| Independent | 3 | 3 | 6 | −2 | 2,859 | 9.3 | |
| Labour | 1 | 0 | 1 | 0 | 6,486 | 21.0 | |
| Green | 0 | 0 | 0 | 0 | 1,953 | 6.3 | |
| UKIP | 0 | 0 | 0 | 0 | 868 | 2.8 | |
| Total | 19 | 38 | 57 | – | 30,821 | – | |
| Turnout | 39.0 | ||||||
Results by ward
| Party | Candidate | Votes | % | ± | |
|---|---|---|---|---|---|
| Labour | Nigel Cathcart | 812 | 59.2 | ||
| Conservative | Joshua Huntingfield | 286 | 20.6 | ||
| Green | Simon Saggers | 274 | 19.9 | ||
| Majority | 526 | ||||
| Turnout | 39.8 | ||||
| Labour hold | Swing | ||||
| Party | Candidate | Votes | % | ± | |
|---|---|---|---|---|---|
| Conservative | Mervyn Loynes | 868 | 39.1 | ||
| Labour | Gavin Clayton | 594 | 26.8 | ||
| Liberal Democrat | Jeni Sawford | 352 | 15.9 | ||
| UKIP | Helene Greene | 236 | 10.6 | ||
| Green | Marcus Pitcaithly | 169 | 7.6 | ||
| Majority | 274 | ||||
| Turnout | 27.0 | ||||
| Conservative hold | Swing | ||||
| Party | Candidate | Votes | % | ± | |
|---|---|---|---|---|---|
| Conservative | Simon Edwards | 956 | 40.7 | ||
| Labour | Joyce Matheson | 504 | 21.5 | ||
| Liberal Democrat | Richard Gymer | 350 | 14.9 | ||
| UKIP | John Wilson | 290 | 12.4 | ||
| Green | Colin Coe | 248 | 10.6 | ||
| Majority | 452 | ||||
| Turnout | 38.1 | ||||
| Conservative hold | Swing | ||||
| Party | Candidate | Votes | % | ± | |
|---|---|---|---|---|---|
| Liberal Democrat | Sebastian Kindersley | 1,008 | 58.5 | ||
| Conservative | Alison Elcox | 548 | 31.8 | ||
| Labour | John Goodall | 166 | 9.6 | ||
| Majority | 460 | ||||
| Turnout | 43.2 | ||||
| Liberal Democrat hold | Swing | ||||
| Party | Candidate | Votes | % | ± | |
|---|---|---|---|---|---|
| Independent | Douglas de Lacey | 740 | 50.0 | ||
| Conservative | Alastair Simpson | 304 | 20.6 | ||
| Labour | Mark McCormack | 274 | 18.5 | ||
| Green | Teal Riley | 161 | 10.9 | ||
| Majority | 436 | ||||
| Turnout | 42.8 | ||||
| Independent hold | Swing | ||||
| Party | Candidate | Votes | % | ± | |
|---|---|---|---|---|---|
| Liberal Democrat | Janet Lockwood | 489 | 53.1 | ||
| Conservative | Gina Youens | 275 | 29.9 | ||
| Labour | Bruce Phillips | 104 | 11.3 | ||
| Green | Paul Evans | 53 | 5.8 | ||
| Majority | 214 | ||||
| Turnout | 47.5 | ||||
| Liberal Democrat hold | Swing | ||||
| Party | Candidate | Votes | % | ± | |
|---|---|---|---|---|---|
| Liberal Democrat | Doug Cattermole | 535 | 48.8 | ||
| Conservative | Lina Joseph | 448 | 40.8 | ||
| Labour | Norman Crowther | 114 | 10.4 | ||
| Majority | 87 | ||||
| Turnout | 50.2 | ||||
| Liberal Democrat gain from Independent | Swing | ||||
| Party | Candidate | Votes | % | ± | |
|---|---|---|---|---|---|
| Independent | Neil Davies | 1,278 | 39.9 | ||
| Liberal Democrat | Yemi Macaulay | 698 | 21.8 | ||
| Labour | Njoki Mahiaini | 533 | 16.6 | ||
| Conservative | Matthew Bradney | 520 | 16.2 | ||
| Green | Darren Cotterell | 174 | 5.4 | ||
| Majority | 580 | ||||
| Turnout | 38.9 | ||||
| Independent hold | Swing | ||||
| Party | Candidate | Votes | % | ± | |
|---|---|---|---|---|---|
| Liberal Democrat | John Batchelor | 753 | 43.6 | ||
| Conservative | Enid Bald | 621 | 35.9 | ||
| Labour | Rosanna Evans | 177 | 10.3 | ||
| Green | Paul Richardson | 176 | 10.2 | ||
| Majority | 132 | ||||
| Turnout | 46.7 | ||||
| Liberal Democrat gain from Conservative | Swing | ||||
| Party | Candidate | Votes | % | ± | |
|---|---|---|---|---|---|
| Conservative | Alex Riley | 525 | 62.7 | ||
| Labour | Simon Down | 146 | 17.4 | ||
| UKIP | Callum Hatch | 82 | 9.8 | ||
| Green | Sandra Archer | 54 | 6.4 | ||
| Liberal Democrat | Kirk Taylor | 31 | 3.7 | ||
| Majority | 379 | ||||
| Turnout | 33.9 | ||||
| Conservative hold | Swing | ||||
| Party | Candidate | Votes | % | ± | |
|---|---|---|---|---|---|
| Conservative | Val Barrett | 936 | 61.2 | ||
| Liberal Democrat | Alexander Wasyliw | 311 | 20.3 | ||
| Labour | Angela Patrick | 282 | 18.4 | ||
| Majority | 625 | ||||
| Turnout | 35.9 | ||||
| Conservative hold | Swing | ||||
| Party | Candidate | Votes | % | ± | |
|---|---|---|---|---|---|
| Conservative | Mark Howell | 927 | 64.4 | ||
| Labour | Darren Macey | 334 | 23.2 | ||
| Liberal Democrat | Clare Delderfield | 179 | 12.4 | ||
| Majority | 593 | ||||
| Turnout | 33.6 | ||||
| Conservative hold | Swing | ||||
| Party | Candidate | Votes | % | ± | |
|---|---|---|---|---|---|
| Conservative | Kevin Cuffley | 849 | 42.9 | ||
| Labour | Robert Grayston | 548 | 27.7 | ||
| Liberal Democrat | Brian Milnes | 453 | 22.9 | ||
| Green | Helen Stocks | 127 | 6.4 | ||
| Majority | 301 | ||||
| Turnout | 34.4 | ||||
| Conservative gain from Independent | Swing | ||||
| Party | Candidate | Votes | % | ± | |
|---|---|---|---|---|---|
| Independent | Cicely Murfitt | 556 | 55.2 | ||
| Conservative | Heather Williams | 386 | 38.3 | ||
| Labour | Robin Stern | 65 | 6.5 | ||
| Majority | 170 | ||||
| Turnout | 51.5 | ||||
| Independent hold | Swing | ||||
| Party | Candidate | Votes | % | ± | |
|---|---|---|---|---|---|
| Conservative | Charles Nightingale | 1,021 | 41.6 | ||
| Labour | Mike Nettleton | 705 | 28.7 | ||
| Liberal Democrat | Peter Fane | 369 | 15.0 | ||
| Green | Sophi Berridge | 360 | 14.7 | ||
| Majority | 316 | ||||
| Turnout | 41.9 | ||||
| Conservative hold | Swing | ||||
| Party | Candidate | Votes | % | ± | |
|---|---|---|---|---|---|
| Conservative | Robert Turner | 452 | 54.1 | ||
| Liberal Democrat | Anthony Holland | 216 | 25.9 | ||
| Labour | June Ford | 167 | 20.0 | ||
| Majority | 236 | ||||
| Turnout | 39.0 | ||||
| Conservative hold | Swing | ||||
| Party | Candidate | Votes | % | ± | |
|---|---|---|---|---|---|
| Liberal Democrat | Ingrid Tregoing | 649 | 34.9 | ||
| Conservative | Alan Shipp | 466 | 25.0 | ||
| Labour | Gareth Wright | 392 | 21.1 | ||
| Independent | Myra Gaunt | 285 | 15.3 | ||
| Green | Mary Lachlan-Cope | 69 | 3.7 | ||
| Majority | 183 | ||||
| Turnout | 43.9 | ||||
| Liberal Democrat gain from Conservative | Swing | ||||
| Party | Candidate | Votes | % | ± | |
|---|---|---|---|---|---|
| Conservative | Peter Topping | 546 | 57.8 | ||
| Liberal Democrat | Peter McDonald | 201 | 21.3 | ||
| Labour | Philippa MacGarry | 197 | 20.9 | ||
| Majority | 345 | ||||
| Turnout | 43.8 | ||||
| Conservative hold | Swing | ||||
| Party | Candidate | Votes | % | ± | |
|---|---|---|---|---|---|
| Conservative | Ray Manning | 819 | 44.3 | ||
| Labour | Ben Monks | 372 | 20.1 | ||
| Liberal Democrat | Sue Gymer | 308 | 16.7 | ||
| UKIP | Martin Hale | 260 | 14.1 | ||
| Green | Eleanor Crane | 88 | 4.8 | ||
| Majority | 447 | ||||
| Turnout | 34.3 | ||||
| Conservative hold | Swing | ||||
References
- ↑ "Notice of Election" (PDF). South Cambridgeshire District Council. 2016-03-30. Retrieved 2016-04-20.
- 1 2 3 4 5 6 7 8 9 10 11 12 13 14 15 16 17 18 19 20 "Statement of Persons Nominated" (PDF). South Cambridgeshire District Council. 2016-04-08. Retrieved 2016-04-20.
- ↑ "Moving to All-out Elections" (PDF). South Cambridgeshire District Council. Retrieved 2016-04-20.
- ↑ "District Council Elections - Thursday, 5 May 2016". South Cambridgeshire District Council. 2016-05-05. Retrieved 2016-04-20.
- 1 2 3 4 5 6 7 8 9 10 11 12 13 14 15 16 17 18 19 "Election results by ward". South Cambridgeshire District Council. 2016-05-05. Retrieved 2011-04-20.