Cambridgeshire County Council election, 2013
| | |||||||||||||||||||||||||||||||||||||||||||||
| |||||||||||||||||||||||||||||||||||||||||||||
| |||||||||||||||||||||||||||||||||||||||||||||
|
| |||||||||||||||||||||||||||||||||||||||||||||
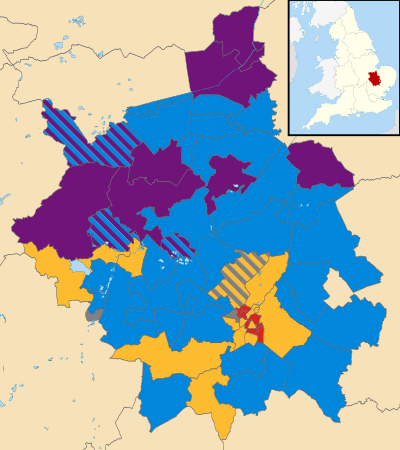
| Map showing the results of the 2013 Cambridgeshire County Council elections. | |||||||||||||||||||||||||||||||||||||||||||||
| |||||||||||||||||||||||||||||||||||||||||||||
An election to Cambridgeshire County Council took place on 2 May 2013 as part of the United Kingdom local elections, 2013.[1] 69 councillors were elected from 60 electoral divisions, which returned either one or two county councillors each by first-past-the-post voting for a four-year term of office. The electoral divisions were the same as those used at the previous election in 2009. No elections were held in Peterborough, which is a unitary authority outside the area covered by the County Council. The election saw the Conservative Party lose overall control of the council.[2]
All locally registered electors (British, Irish, Commonwealth and European Union citizens) who were aged 18 or over on Thursday 2 May 2013 were entitled to vote in the local elections. Those who were temporarily away from their ordinary address (for example, away working, on holiday, in student accommodation or in hospital) were also entitled to vote in the local elections,[3] although those who had moved abroad and registered as overseas electors cannot vote in the local elections. It is possible to register to vote at more than one address (such as a university student who had a term-time address and lives at home during holidays) at the discretion of the local Electoral Register Office, but it remains an offence to vote more than once in the same local government election.[4]
Summary
In total 292 candidates stood in the election. Only the Labour Party and the Conservative Party contested all 69 seats on the council. The Liberal Democrats stood 61 candidates, not standing in four divisions in Fenland and only contesting one seat in some two-member divisions. The United Kingdom Independence Party stood 52 candidates, including a full slate in Huntingdonshire, although two nominated candidates in Fenland withdrew before the deadline and did not appear on the ballot.[5] The Green Party stood 25 candidates, mostly in Cambridge and South Cambridgeshire. The English Democrats stood two candidates in Whittlesey, while the Trade Unionist and Socialist Coalition stood two candidates in the Godmanchester & Huntingdon East division. The Official Monster Raving Loony Party stood two candidates in St Ives and in Bar Hill divisions, and one candidate stood for the Cambridge Socialists in Romsey. There were also nine independent candidates.
The United Kingdom Independence Party made substantial gains, taking 11 seats from the Conservatives mostly in Fenland and northern Huntingdonshire. Southern Huntingdonshire saw the Conservatives lose a seat to the Liberal Democrats in the Godmanchester & Huntingdon East division, as well as two seats to independents in the St Neots Eaton Socon & Eynesbury division. The Labour Party gained seats in Cambridge from the Liberal Democrats and the Green Party, including Arbury which Labour had won in a 2011 by-election, winning half of the city's 14 county council divisions.[6] In East Cambridgeshire, the Conservatives gained both divisions in Ely from the Liberal Democrats but lost Littleport to UKIP. In South Cambridgeshire, Conservative council leader Nick Clarke lost his seat in Fulbourn to the Liberal Democrats. The Liberal Democrats however lost four other seats in the district including in Linton, where the Conservative candidate won by a single vote.
Aftermath
The Conservatives will continue to run the council however they will do so in a minority, with Whittlesey councillor Martin Curtis as council leader.[7] In addition the council structure will switch from a cabinet system to a committee system, starting from May 2014.[8]
Results summary
| Cambridgeshire County Council election, 2013[9][10] | ||||||||||
|---|---|---|---|---|---|---|---|---|---|---|
| Party | Seats | Gains | Losses | Net gain/loss | Seats % | Votes % | Votes | +/− | ||
| Conservative | 32 | 5 | 15 | −10 | 46 | 33.6 | 59,129 | −12.0% | ||
| Liberal Democrat | 14 | 2 | 11 | −9 | 20 | 19.7 | 34,588 | −14.0% | ||
| UKIP | 12 | 11 | 0 | +11 | 17 | 21.1 | 37,132 | +17.8% | ||
| Labour | 7 | 5 | 0 | +5 | 10 | 17.4 | 30,632[lower-alpha 1] | +8.3% | ||
| Independent | 4 | 4 | 0 | +4 | 6 | 4.2 | 7,354 | +2.0% | ||
| Green | 0 | 0 | 1 | −1 | 0 | 3.3 | 5,873 | −1.6% | ||
| English Democrat | 0 | 0 | 0 | 0 | 0 | 0.3 | 584 | n/a | ||
| Monster Raving Loony | 0 | 0 | 0 | 0 | 0 | 0.1 | 225 | −0.2% | ||
| TUSC | 0 | 0 | 0 | 0 | 0 | 0.1 | 148 | n/a | ||
| Cambridge Socialists | 0 | 0 | 0 | 0 | 0 | 0.1 | 118 | n/a | ||
- ↑ Includes Labour Co-operative
Results by District
Cambridge (14 seats)
| Party | Candidate | Votes | % | ± | |
|---|---|---|---|---|---|
| Labour | Joan Whitehead | 926 | 53.4 | +24.1 | |
| Green | Brett Hughes | 321 | 18.5 | −22.1 | |
| Conservative | David Smith | 296 | 17.1 | −0.1 | |
| Liberal Democrat | Christopher Brown | 192 | 11.1 | −1.9 | |
| Turnout | 1,751 | 26.1 | |||
| Labour gain from Green | Swing | ||||
| Party | Candidate | Votes | % | ± | |
|---|---|---|---|---|---|
| Labour | Paul Sales | 947 | 49.4 | +20.4 | |
| Liberal Democrat | Daniel Levy | 331 | 16.8 | −25.2 | |
| UKIP | Hugh Mennie | 246 | 12.5 | n/a | |
| Conservative | Ali Meftah | 226 | 11.5 | −4.3 | |
| Green | Stephen Lawrence | 195 | 9.9 | −3.3 | |
| Turnout | 1,977 | 29.0 | |||
| Labour gain from Liberal Democrat | Swing | ||||
| Party | Candidate | Votes | % | ± | |
|---|---|---|---|---|---|
| Independent | John Hipkin | 781 | 41.0 | +11.2 | |
| Liberal Democrat | Belinda Brooks-Gordon | 620 | 32.6 | −10.5 | |
| Labour | Edward Browne | 317 | 16.7 | +8.9 | |
| Conservative | Richard Jeffs | 109 | 5.7 | −4.8 | |
| UKIP | Nicholas Wilson | 76 | 4.0 | n/a | |
| Turnout | 1,912 | 29.8 | |||
| Independent gain from Liberal Democrat | Swing | ||||
| Party | Candidate | Votes | % | ± | |
|---|---|---|---|---|---|
| Labour | Sandra Crawford | 1,150 | 58.5 | +16.3 | |
| Conservative | Timothy Haire | 453 | 22.9 | −8.5 | |
| Green | Megan Parry | 214 | 10.8 | −2.4 | |
| Liberal Democrat | William Barter | 155 | 7.8 | −5.4 | |
| Turnout | 1,998 | 31.4 | |||
| Labour hold | Swing | ||||
| Party | Candidate | Votes | % | ± | |
|---|---|---|---|---|---|
| Labour | Noel Kavanagh | 1,071 | 53.9 | +17.6 | |
| Conservative | Sam Barker | 347 | 17.5 | −14.9 | |
| UKIP | Bill Kaminski | 272 | 13.7 | +7.5 | |
| Green | Shaun Esgate | 149 | 7.5 | −4.8 | |
| Liberal Democrat | Thomas Yates | 148 | 7.4 | −5.3 | |
| Turnout | 1,990 | 30.6 | |||
| Labour hold | Swing | ||||
| Party | Candidate | Votes | % | ± | |
|---|---|---|---|---|---|
| Liberal Democrat | Ian Manning | 1,147 | 45.9 | +10.1 | |
| Labour | Clare Blair | 832 | 33.3 | +18.3 | |
| UKIP | Peter Burkinshaw | 221 | 8.8 | −0.9 | |
| Conservative | Tom Kerby | 160 | 6.4 | −18.4 | |
| Green | Peter Pope | 140 | 5.6 | −9.1 | |
| Turnout | 2,509 | 37.5 | |||
| Liberal Democrat hold | Swing | ||||
| Party | Candidate | Votes | % | ± | |
|---|---|---|---|---|---|
| Labour | Fiona Onasany | 716 | 48.9 | +22.8 | |
| Liberal Democrat | Neale Upstone | 281 | 19.2 | −19.9 | |
| Independent | Ian Tyes | 243 | 16.6 | n/a | |
| Conservative | Anette Karimi | 224 | 15.3 | −7.6 | |
| Turnout | 1,487 | 23.5 | |||
| Labour gain from Liberal Democrat | Swing | ||||
| Party | Candidate | Votes | % | ± | |
|---|---|---|---|---|---|
| Liberal Democrat | Edward Cearns | 475 | 33.1 | −11.6 | |
| Labour | Dan Ratcliffe | 434 | 30.2 | +17.6 | |
| Green | Simon Sedgwick-Jell | 268 | 18.7 | −2.5 | |
| Conservative | Sheila Lawlor | 258 | 18.0 | −3.4 | |
| Turnout | 1,452 | 22.7 | |||
| Liberal Democrat hold | Swing | ||||
| Party | Candidate | Votes | % | ± | |
|---|---|---|---|---|---|
| Liberal Democrat | Lucy Nethsingha | 797 | 43.2 | −3.1 | |
| Labour | Peter Sarris | 661 | 35.8 | +21.6 | |
| Conservative | Jonathan Farmer | 230 | 12.5 | −9.7 | |
| Green | Tom Watkins | 150 | 8.6 | −8.7 | |
| Turnout | 1,854 | 27.9 | |||
| Liberal Democrat hold | Swing | ||||
| Party | Candidate | Votes | % | ± | |
|---|---|---|---|---|---|
| Labour | Ashley Walsh | 943 | 55.9 | +26.2 | |
| Liberal Democrat | Keith Edkins | 270 | 16.0 | −25.8 | |
| Green | Sandra Billington | 267 | 15.8 | +1.2 | |
| Conservative | Linda Yeatman | 206 | 12.2 | −1.7 | |
| Turnout | 1,697 | 28.3 | |||
| Labour gain from Liberal Democrat | Swing | ||||
| Party | Candidate | Votes | % | ± | |
|---|---|---|---|---|---|
| Liberal Democrat | Amanda Taylor | 1,188 | 44.8 | −11.5 | |
| Labour Co-op | John Beresford | 931 | 35.1 | +27.7 | |
| Conservative | Tom Bygott | 361 | 13.6 | −10.5 | |
| Green | William Birkin | 172 | 6.5 | −5.7 | |
| Turnout | 2,662 | 40.2 | |||
| Liberal Democrat hold | Swing | ||||
| Party | Candidate | Votes | % | ± | |
|---|---|---|---|---|---|
| Liberal Democrat | Kilian Bourke | 1,118 | 47.9 | +13.5 | |
| Labour | Martin Smart | 741 | 31.7 | +11.2 | |
| Green | Hywel Sedgwick-Jell | 138 | 5.9 | −6.4 | |
| UKIP | Marjorie Barr | 118 | 5.1 | +1.1 | |
| Cambridge Socialists | Tom Woodcock | 118 | 5.1 | −12.5 | |
| Conservative | Andrew Bower | 103 | 4.4 | −6.8 | |
| Turnout | 2,344 | 36.9 | |||
| Liberal Democrat hold | Swing | ||||
| Party | Candidate | Votes | % | ± | |
|---|---|---|---|---|---|
| Liberal Democrat | Barbara Ashwood | 763 | 37.0 | −6.6 | |
| Conservative | John Ionides | 735 | 35.6 | −0.4 | |
| Labour | Peter Snow | 239 | 15.9 | +8.4 | |
| Green | Ceri Galloway | 236 | 11.4 | −1.5 | |
| Turnout | 2,070 | 34.5 | |||
| Liberal Democrat hold | Swing | ||||
| Party | Candidate | Votes | % | ± | |
|---|---|---|---|---|---|
| Labour | Jocelynne Scutt | 1,046 | 40.9 | +25.3 | |
| Liberal Democrat | David Grace | 960 | 37.6 | −8.1 | |
| Conservative | James Strachan | 337 | 13.2 | −7.4 | |
| Green | Shayne Mitchell | 212 | 8.3 | −9.8 | |
| Turnout | 2,573 | 41.1 | |||
| Labour gain from Liberal Democrat | Swing | ||||
East Cambridgeshire (9 seats)
| Party | Candidate | Votes | % | ± | |
|---|---|---|---|---|---|
| Conservative | David Brown | 893 | 46.1 | −1.5 | |
| Liberal Democrat | Charlotte Cane | 394 | 20.3 | −26.2 | |
| UKIP | Michael Banahan | 374 | 19.3 | n/a | |
| Labour | Liz Swift | 277 | 14.3 | +8.4 | |
| Turnout | 1,942 | 30.2 | |||
| Conservative hold | Swing | ||||
| Party | Candidate | Votes | % | ± | |
|---|---|---|---|---|---|
| Conservative | Mike Rouse | 1,086 | 39.8 | −5.3 | |
| Liberal Democrat | Nigel Bell | 612 | 22.4 | −24.7 | |
| UKIP | Peter Dawe | 482 | 17.6 | n/a | |
| Labour | Clem Butler | 385 | 14.1 | +6.3 | |
| Green | Robert Edwards | 166 | 6.1 | n/a | |
| Turnout | 2,743 | 31.9 | |||
| Conservative gain from Liberal Democrat | Swing | ||||
| Party | Candidate | Votes | % | ± | |
|---|---|---|---|---|---|
| Conservative | Anna Bailey | 973 | 38.5 | −3.7 | |
| Liberal Democrat | Sue Austen | 712 | 28.2 | −23.8 | |
| UKIP | Jeremy Tyrrell | 441 | 17.5 | n/a | |
| Labour | Ruth Barber | 275 | 10.9 | +5.1 | |
| Green | Andrew Allen | 126 | 5.0 | n/a | |
| Turnout | 2,534 | 37.4 | |||
| Conservative gain from Liberal Democrat | Swing | ||||
| Party | Candidate | Votes | % | ± | |
|---|---|---|---|---|---|
| Conservative | Bill Hunt | 1,292 | 49.3 | −2.0 | |
| UKIP | Mark Higginson | 538 | 20.5 | n/a | |
| Liberal Democrat | Gareth Wilson | 463 | 17.7 | −26.9 | |
| Labour | Rob Bayley | 239 | 9.0 | +4.9 | |
| Green | Gemma Bristow | 90 | 3.4 | n/a | |
| Turnout | 2,624 | 33.9 | |||
| Conservative hold | Swing | ||||
| Party | Candidate | Votes | % | ± | |
|---|---|---|---|---|---|
| UKIP | Daniel Divine | 475 | 35.8 | n/a | |
| Conservative | Fred Brown | 389 | 29.3 | −24.9 | |
| Liberal Democrat | Neil Morrison | 260 | 19.6 | −18.3 | |
| Labour | Edna Simms | 202 | 15.2 | +7.3 | |
| Turnout | 1,334 | 20.3 | |||
| UKIP gain from Conservative | Swing | ||||
| Party | Candidate | Votes | % | ± | |
|---|---|---|---|---|---|
| Conservative | James Palmer | 2,064 | 25.0 | −12.9 | |
| Conservative | Joshua Schumann | 1,623 | 19.7 | ||
| UKIP | Dick Bourne | 1,364 | 16.5 | n/a | |
| UKIP | John Howlett | 1,198 | 14.5 | ||
| Labour | Mike Swift | 597 | 7.2 | +5.9 | |
| Liberal Democrat | Charles Warner | 588 | 7.1 | −24.1 | |
| Labour | Chris Horne | 499 | 6.0 | ||
| Liberal Democrat | Chika Akinwale | 319 | 3.9 | ||
| Turnout | 8,252 | 22.3 | |||
| Conservative hold | Swing | ||||
| Conservative hold | Swing | ||||
| Party | Candidate | Votes | % | ± | |
|---|---|---|---|---|---|
| Conservative | Philip Read | 817 | 49.4 | +3.9 | |
| Liberal Democrat | Lorna Dupre | 542 | 32.8 | +8.9 | |
| Labour | Peter Allenson | 295 | 17.8 | +10.6 | |
| Turnout | 1,694 | 25.7 | |||
| Conservative hold | Swing | ||||
| Party | Candidate | Votes | % | ± | |
|---|---|---|---|---|---|
| Conservative | Mathew Shuter | 1,327 | 60.2 | +5.6 | |
| Labour | Steven O'Dell | 466 | 21.1 | +14.6 | |
| Liberal Democrat | Jennifer Liddle | 411 | 18.6 | −20.3 | |
| Turnout | 2,241 | 28.1 | |||
| Conservative hold | Swing | ||||
Fenland (11 seats)
| Party | Candidate | Votes | % | ± | |
|---|---|---|---|---|---|
| UKIP | Sandra Rylance | 584 | 34.8 | n/a | |
| Conservative | Mark Buckton | 579 | 34.5 | −15.7 | |
| Liberal Democrat | Josephine Ratcliffe | 358 | 21.3 | −21.6 | |
| Labour | Ann Beevor | 159 | 9.5 | +2.6 | |
| Turnout | 1,689 | 27.6 | |||
| UKIP gain from Conservative | Swing | ||||
| Party | Candidate | Votes | % | ± | |
|---|---|---|---|---|---|
| Conservative | David Connor | 845 | 39.3 | +0.6 | |
| UKIP | David Kelley | 681 | 31.7 | +16.7 | |
| Independent | Mark Archer | 428 | 19.9 | −10.4 | |
| Labour | Valerie Brooker | 197 | 9.2 | +4.3 | |
| Turnout | 2,157 | 30.2 | |||
| Conservative hold | Swing | ||||
| Party | Candidate | Votes | % | ± | |
|---|---|---|---|---|---|
| Conservative | Fred Yeulett | 673 | 35.1 | −25.5 | |
| UKIP | Richard Mason | 635 | 33.1 | n/a | |
| Labour | Martin Field | 508 | 26.5 | +8.8 | |
| Liberal Democrat | Diane Baldry | 103 | 5.4 | −18.3 | |
| Turnout | 1,926 | 29.4 | |||
| Conservative hold | Swing | ||||
| Party | Candidate | Votes | % | ± | |
|---|---|---|---|---|---|
| Conservative | Steve Count | 616 | 38.0 | −17.8 | |
| UKIP | Christina Towns | 501 | 30.9 | n/a | |
| Liberal Democrat | Stephen Court | 328 | 20.2 | −10.3 | |
| Labour | David Brown | 177 | 10.9 | −2.8 | |
| Turnout | 1,624 | 29.4 | |||
| Conservative hold | Swing | ||||
| Party | Candidate | Votes | % | ± | |
|---|---|---|---|---|---|
| Conservative | John Clark | 1,023 | 60.3 | +6.6 | |
| Labour | Charlotte Goodhall-Perry | 402 | 23.7 | +15.6 | |
| Liberal Democrat | Heather Kinnear | 271 | 16.0 | +3.3 | |
| Turnout | 1,762 | 27.6 | |||
| Conservative hold | Swing | ||||
| Party | Candidate | Votes | % | ± | |
|---|---|---|---|---|---|
| UKIP | Alan Lay | 955 | 41.2 | +16.5 | |
| Conservative | Steve Tierney | 944 | 40.7 | −12.3 | |
| Labour | Barry Diggle | 335 | 14.4 | +2.2 | |
| Liberal Democrat | Robert McLaren | 85 | 3.7 | −6.4 | |
| Turnout | 2,326 | 32.5 | |||
| UKIP gain from Conservative | Swing | ||||
| Party | Candidate | Votes | % | ± | |
|---|---|---|---|---|---|
| UKIP | Gordon Gillick | 713 | 35.9 | +27.4 | |
| Liberal Democrat | Gavin Booth | 608 | 30.6 | +2.9 | |
| Conservative | Will Sutton | 528 | 26.6 | −13.8 | |
| Labour | Jess Hibbert | 139 | 7.0 | +0.7 | |
| Turnout | 1,996 | 28.8 | |||
| UKIP gain from Conservative | Swing | ||||
| Party | Candidate | Votes | % | ± | |
|---|---|---|---|---|---|
| Conservative | Martin Curtis | 1,151 | 55.6 | −6.7 | |
| UKIP | John Redding | 611 | 29.5 | n/a | |
| Labour | Colin Gale | 260 | 12.6 | −2.7 | |
| English Democrat | Maria Goldspink | 48 | 2.3 | n/a | |
| Turnout | 2,084 | 33.7 | |||
| Conservative hold | Swing | ||||
| Party | Candidate | Votes | % | ± | |
|---|---|---|---|---|---|
| Conservative | Ralph Butcher | 990 | 54.2 | −13.2 | |
| English Democrat | Stephen Goldspink | 536 | 29.3 | n/a | |
| Labour | Aidan Hervey | 302 | 16.5 | +6.6 | |
| Turnout | 1,851 | 27.9 | |||
| Conservative hold | Swing | ||||
| Party | Candidate | Votes | % | ± | |
|---|---|---|---|---|---|
| UKIP | Paul Clapp | 808 | 40.3 | +9.6 | |
| Independent | Virginia Bucknor | 529 | 26.4 | n/a | |
| Conservative | Samantha Hoy | 473 | 23.6 | −18.1 | |
| Labour | Dean Reeves | 193 | 9.6 | −5.9 | |
| Turnout | 2,008 | 26.3 | |||
| UKIP gain from Conservative | Swing | ||||
| Party | Candidate | Votes | % | ± | |
|---|---|---|---|---|---|
| UKIP | Peter Lagoda | 774 | 38.2 | +11.7 | |
| Conservative | Simon King | 636 | 31.4 | −14.9 | |
| Labour | Malcom Gamble | 333 | 16.5 | +5.9 | |
| Liberal Democrat | Patrick Roy | 281 | 13.9 | +4.4 | |
| Turnout | 2,029 | 25.1 | |||
| UKIP gain from Conservative | Swing | ||||
Huntingdonshire (19 seats)
| Party | Candidate | Votes | % | ± | |
|---|---|---|---|---|---|
| Liberal Democrat | Peter Downes | 1,396 | 47.7 | −11.8 | |
| Conservative | Jane King | 769 | 26.3 | −11.9 | |
| UKIP | Jenny O'Dell | 646 | 22.1 | n/a | |
| Labour | Mark Johnson | 118 | 4.0 | +1.8 | |
| Turnout | 2,935 | 40.5 | |||
| Liberal Democrat hold | Swing | ||||
| Party | Candidate | Votes | % | ± | |
|---|---|---|---|---|---|
| Conservative | Julie Wisson | 1,039 | 43.6 | −12.8 | |
| UKIP | Lynne Bullen | 573 | 24.1 | n/a | |
| Liberal Democrat | Terry Clough | 555 | 23.3 | −16.3 | |
| Labour | Patrick Hickey | 214 | 9.0 | +5.0 | |
| Turnout | 2,386 | 30.1 | |||
| Conservative hold | Swing | ||||
| Party | Candidate | Votes | % | ± | |
|---|---|---|---|---|---|
| Liberal Democrat | Michael Shellens | 1,226 | 16.3 | −14.2 | |
| Liberal Democrat | Graham Wilso | 1,195 | 15.9 | ||
| UKIP | Martin Cohen | 1,171 | 15.5 | n/a | |
| UKIP | Derek Norman | 1,080 | 14.3 | ||
| Conservative | Andrew Bish | 1,026 | 13.6 | −20.0 | |
| Conservative | Daryl Brown | 1,024 | 13.6 | ||
| Labour | David King | 331 | 4.4 | +2.4 | |
| Labour | Robert Pugh | 330 | 4.4 | ||
| TUSC | Antony Staples | 76 | 1.0 | n/a | |
| TUSC | Robert Cossey-Mowle | 72 | 1.0 | ||
| Turnout | 32.0 | ||||
| Liberal Democrat hold | Swing | ||||
| Liberal Democrat gain from Conservative | Swing | ||||
| Party | Candidate | Votes | % | ± | |
|---|---|---|---|---|---|
| UKIP | Peter Ashcroft | 1,118 | 19.3 | n/a | |
| Conservative | Peter Brown | 1,106 | 17.5 | −20.2 | |
| UKIP | Kay Norman | 985 | 17.0 | ||
| Conservative | Laine Kadic | 836 | 14.4 | ||
| Labour | Nik Johnson | 721 | 12.4 | +9.9 | |
| Labour | Marion Kadewere | 611 | 10.5 | ||
| Liberal Democrat | Michael Burrell | 277 | 4.8 | −17.1 | |
| Liberal Democrat | Trish Shrapnel | 238 | 4.1 | ||
| Turnout | 26.7 | ||||
| UKIP gain from Conservative | Swing | ||||
| Conservative hold | Swing | ||||
| Party | Candidate | Votes | % | ± | |
|---|---|---|---|---|---|
| Conservative | Barry Chapman | 1,312 | 19.3 | −21.8 | |
| Conservative | David Harty | 1,158 | 17.1 | ||
| UKIP | Marian Appleton | 947 | 13.9 | n/a | |
| Independent | Bob Farrer | 858 | 12.6 | n/a | |
| Independent | Ken Churchill | 746 | 11.0 | n/a | |
| UKIP | Sherrell Smart | 596 | 8.8 | ||
| Labour | Emlyn Rees | 360 | 5.3 | +3.7 | |
| Liberal Democrat | Gordon Thorpe | 311 | 4.6 | −21.8 | |
| Labour | Jim Lomax | 286 | 4.2 | ||
| Green | Melina Lafirenze | 216 | 3.2 | −6.5 | |
| Turnout | 28.2 | ||||
| Conservative hold | Swing | ||||
| Conservative hold | Swing | ||||
| Party | Candidate | Votes | % | ± | |
|---|---|---|---|---|---|
| UKIP | Roger Henson | 1,270 | 21.3 | +25.2 | |
| Conservative | Mac McGuire | 1,231 | 20.6 | −15.8 | |
| Conservative | Nick Guyatt | 1,224 | 20.5 | ||
| UKIP | Barry Hyland | 1,146 | 19.2 | ||
| Labour | Margaret Cochrane | 481 | 8.1 | +4.4 | |
| Labour | Graeme Watkins | 405 | 6.8 | ||
| Liberal Democrat | Christopher Waites | 218 | 3.6 | −13.8 | |
| Turnout | 25.2 | ||||
| UKIP gain from Conservative | Swing | ||||
| Conservative hold | Swing | ||||
| Party | Candidate | Votes | % | ± | |
|---|---|---|---|---|---|
| UKIP | Peter Reeve | 1,406 | 66.7 | +21.4 | |
| Conservative | Madeleine Jackson | 523 | 24.8 | −10.9 | |
| Labour | Susan Coomey | 110 | 5.2 | +2.4 | |
| Liberal Democrat | Anthony Jebson | 70 | 3.3 | −12.8 | |
| Turnout | 2,109 | 32.7 | |||
| UKIP hold | Swing | ||||
| Party | Candidate | Votes | % | ± | |
|---|---|---|---|---|---|
| UKIP | Simon Bywater | 1,228 | 49.1 | +29.2 | |
| Conservative | Viv McGuire | 894 | 35.7 | −20.0 | |
| Labour | Mary Howell | 230 | 9.2 | +3.7 | |
| Liberal Democrat | Rupert Moss-Eccardt | 149 | 6.0 | −12.8 | |
| Turnout | 2,517 | 34.3 | |||
| UKIP gain from Conservative | Swing | ||||
| Party | Candidate | Votes | % | ± | |
|---|---|---|---|---|---|
| Conservative | Steve Criswell | 1,321 | 52.2 | −10.9 | |
| UKIP | Peter Verrechia | 717 | 28.3 | +13.1 | |
| Liberal Democrat | Tony Hulme | 288 | 11.4 | −5.9 | |
| Labour | Iain Ramsbottom | 206 | 8.1 | +3.7 | |
| Turnout | 2,535 | 34.0 | |||
| Conservative hold | Swing | ||||
| Party | Candidate | Votes | % | ± | |
|---|---|---|---|---|---|
| UKIP | Paul Bullen | 1,581 | 19.7 | n/a | |
| Conservative | Kevin Reynolds | 1,521 | 18.9 | −16.7 | |
| UKIP | Margaret King | 1,459 | 18.2 | ||
| Conservative | Ryan Fuller | 1,433 | 17.9 | ||
| Liberal Democrat | David Hodge | 514 | 6.4 | −21.3 | |
| Labour | Richard Allen | 486 | 6.1 | +3.9 | |
| Labour | Angela Richards | 448 | 5.6 | ||
| Liberal Democrat | Colin Saunderson | 389 | 4.8 | ||
| Monster Raving Loony | Lord Toby Jug | 197 | 2.5 | −3.7 | |
| Turnout | 28.4 | ||||
| UKIP gain from Conservative | Swing | ||||
| Conservative hold | Swing | ||||
| Party | Candidate | Votes | % | ± | |
|---|---|---|---|---|---|
| Independent | Derek Giles | 1,311 | 22.6 | n/a | |
| Independent | Steven Van de Kerkhove | 1,141 | 19.7 | n/a | |
| Conservative | Roger Harrison | 728 | 12.6 | −25.5 | |
| Conservative | Adrian Usher | 710 | 12.2 | ||
| UKIP | Dave Howard | 692 | 11.9 | n/a | |
| UKIP | Steve Lancaster | 470 | 8.1 | ||
| Labour | Wendy Hurst | 250 | 4.3 | −0.4 | |
| Labour | William O'Connor | 209 | 3.6 | ||
| Liberal Democrat | Martin Land | 162 | 2.8 | −38.6 | |
| Green | Gareth Thomas | 126 | 2.2 | n/a | |
| Turnout | 25.9 | ||||
| Independent gain from Conservative | Swing | ||||
| Independent gain from Conservative | Swing | ||||
| Party | Candidate | Votes | % | ± | |
|---|---|---|---|---|---|
| Conservative | Ian Bates | 1,141 | 47.6 | −18.4 | |
| UKIP | Philip Foster | 794 | 33.1 | n/a | |
| Liberal Democrat | David Priestman | 232 | 9.7 | −17.7 | |
| Labour | John Watson | 231 | 9.6 | +3.0 | |
| Turnout | 2,402 | 32.3 | |||
| Conservative hold | Swing | ||||
| Party | Candidate | Votes | % | ± | |
|---|---|---|---|---|---|
| UKIP | Michael Tew | 1,002 | 47.0 | +18.5 | |
| Conservative | Jason Ablewhite | 796 | 37.3 | −12.8 | |
| Labour | Kevin Goddard | 171 | 8.0 | +4.5 | |
| Liberal Democrat | Christine Wills | 164 | 7.7 | −10.2 | |
| Turnout | 2,142 | 29.6 | |||
| UKIP gain from Conservative | Swing | ||||
South Cambridgeshire (16 seats)
| Party | Candidate | Votes | % | ± | |
|---|---|---|---|---|---|
| Conservative | John Reynolds | 1,175 | 45.4 | −10.3 | |
| UKIP | Helene Davies-Green | 570 | 22.0 | +11.9 | |
| Labour | Norman Crowther | 352 | 13.6 | +5.1 | |
| Green | Teal Riley | 242 | 9.4 | −0.2 | |
| Liberal Democrat | Andy Pellew | 219 | 8.5 | −7.6 | |
| Monster Raving Loony | Lord Broughall | 28 | 1.1 | n/a | |
| Turnout | 2,593 | 35.1 | |||
| Conservative hold | Swing | ||||
| Party | Candidate | Votes | % | ± | |
|---|---|---|---|---|---|
| Conservative | Adrian Dent | 726 | 45.8 | −12.2 | |
| Green | Simon Saggers | 544 | 34.3 | +12.1 | |
| Labour | Mark Toner | 199 | 12.5 | +3.9 | |
| Liberal Democrat | Mark Holmes | 117 | 7.4 | −3.7 | |
| Turnout | 1,613 | 29.5 | |||
| Conservative hold | Swing | ||||
| Party | Candidate | Votes | % | ± | |
|---|---|---|---|---|---|
| Conservative | Mervyn Loynes | 449 | 26.0 | −23.3 | |
| Liberal Democrat | Roger Hume | 434 | 25.1 | −11.8 | |
| Labour | Gavin Clayton | 393 | 22.7 | +8.9 | |
| UKIP | Lister Wilson | 363 | 21.0 | n/a | |
| Green | Marcus Pitcaithly | 89 | 5.2 | n/a | |
| Turnout | 1,732 | 25.9 | |||
| Conservative hold | Swing | ||||
| Party | Candidate | Votes | % | ± | |
|---|---|---|---|---|---|
| Independent | Mike Mason | 1,317 | 14.8 | n/a | |
| Liberal Democrat | John Jenkins | 1,260 | 14.2 | −18.4 | |
| Conservative | Lynda Harford | 1,147 | 12.9 | −16.5 | |
| Liberal Democrat | Sue Gymer | 1,127 | 12.7 | ||
| Conservative | Timothy Wotherspoon | 1,082 | 12.2 | ||
| Labour | Huw Jones | 931 | 10.5 | +13.4 | |
| Labour | Brenda Biamonti | 817 | 9.2 | ||
| UKIP | Eric Heaver | 637 | 7.2 | n/a | |
| UKIP | Joe Webster | 567 | 6.4 | ||
| Turnout | 4,753 | 34.5 | |||
| Independent gain from Liberal Democrat | Swing | ||||
| Liberal Democrat hold | Swing | ||||
| Party | Candidate | Votes | % | ± | |
|---|---|---|---|---|---|
| Conservative | Peter Topping | 1,125 | 42.7 | +7.1 | |
| Liberal Democrat | Warren Wilson | 765 | 29.0 | −22.6 | |
| UKIP | Elizabeth Wade | 488 | 18.5 | n/a | |
| Labour | Ann Sinnott | 256 | 9.7 | +5.2 | |
| Turnout | 2,644 | 37.9 | |||
| Conservative gain from Liberal Democrat | Swing | ||||
| Party | Candidate | Votes | % | ± | |
|---|---|---|---|---|---|
| Liberal Democrat | John Williams | 1,180 | 44.8 | +18.5 | |
| Conservative | Nick Clarke | 848 | 32.2 | −3.4 | |
| Labour | June Ford | 434 | 16.5 | +8.6 | |
| Green | David Smith | 169 | 6.4 | n/a | |
| Turnout | 2,654 | 34.6 | |||
| Liberal Democrat gain from Conservative | Swing | ||||
| Party | Candidate | Votes | % | ± | |
|---|---|---|---|---|---|
| Liberal Democrat | Sebastian Kindersley | 1,456 | 49.8 | −7.7 | |
| Conservative | Alison Elcox | 730 | 24.9 | −12.3 | |
| UKIP | Diane Birnie | 478 | 16.3 | n/a | |
| Labour | Peter Smith | 262 | 9.0 | +3.7 | |
| Turnout | 2,944 | 37.6 | |||
| Liberal Democrat hold | Swing | ||||
| Party | Candidate | Votes | % | ± | |
|---|---|---|---|---|---|
| Conservative | Stephen Frost | 1,006 | 41.7 | +10.1 | |
| Liberal Democrat | Peter Fane | 905 | 37.5 | −16.9 | |
| Labour | Adam Dutton | 503 | 20.8 | +16.2 | |
| Turnout | 2,468 | 31.9 | |||
| Conservative gain from Liberal Democrat | Swing | ||||
| Party | Candidate | Votes | % | ± | |
|---|---|---|---|---|---|
| Conservative | Roger Hickford | 1,253 | 40.2 | −6.2 | |
| Liberal Democrat | John Batchelor | 1,252 | 40.1 | −8.3 | |
| UKIP | Timothy Skottowe | 346 | 11.1 | n/a | |
| Labour | Tom Purser | 269 | 8.6 | +3.4 | |
| Turnout | 3,129 | 42.6 | |||
| Conservative gain from Liberal Democrat | Swing | ||||
| Party | Candidate | Votes | % | ± | |
|---|---|---|---|---|---|
| Liberal Democrat | Susan Van de Ven | 1,875 | 62.6 | +12.8 | |
| UKIP | David Kendrick | 475 | 15.8 | n/a | |
| Conservative | Duncan Bullivant | 440 | 14.7 | −24.4 | |
| Labour | Angela Patrick | 207 | 6.9 | +2.4 | |
| Turnout | 3,006 | 40.8 | |||
| Liberal Democrat hold | Swing | ||||
| Party | Candidate | Votes | % | ± | |
|---|---|---|---|---|---|
| Conservative | Mandy Smith | 938 | 49.6 | −14.5 | |
| UKIP | David Birnie | 391 | 20.7 | n/a | |
| Labour | David Barrett | 234 | 12.4 | +3.8 | |
| Green | Gaynor Clements | 197 | 10.4 | n/a | |
| Liberal Democrat | Richard Gymer | 131 | 6.9 | −20.5 | |
| Turnout | 1,899 | 30.9 | |||
| Conservative hold | Swing | ||||
| Party | Candidate | Votes | % | ± | |
|---|---|---|---|---|---|
| Conservative | Tony Orgee | 1,852 | 24.0 | −7.0 | |
| Conservative | Gail Kenney | 1,754 | 22.7 | ||
| UKIP | Andrew Billinge | 954 | 12.4 | n/a | |
| Labour | Adrian French | 880 | 11.4 | +9.8 | |
| Green | Linda Whitebread | 810 | 10.5 | −4.9 | |
| Labour | Mike Nettleton | 801 | 10.4 | ||
| Liberal Democrat | Michael Kilpatrick | 669 | 8.7 | −10.1 | |
| Turnout | 4,241 | 32.2 | |||
| Conservative hold | Swing | ||||
| Conservative hold | Swing | ||||
| Party | Candidate | Votes | % | ± | |
|---|---|---|---|---|---|
| Liberal Democrat | Maurice Leeke | 1,217 | 42.5 | −9.8 | |
| Conservative | James Hockney | 1,053 | 36.8 | −6.0 | |
| UKIP | Richard Glover | 279 | 9.7 | n/a | |
| Labour | Paul Finley | 191 | 6.7 | +1.8 | |
| Green | Eleanor Crane | 122 | 4.3 | n/a | |
| Turnout | 2,872 | 40.9 | |||
| Liberal Democrat hold | Swing | ||||
| Party | Candidate | Votes | % | ± | |
|---|---|---|---|---|---|
| Conservative | Ray Manning | 882 | 39.6 | −18.5 | |
| UKIP | Martin Hale | 636 | 28.5 | n/a | |
| Labour | Ben Monks | 387 | 17.4 | +10.2 | |
| Green | Helen Stocks | 175 | 7.9 | n/a | |
| Liberal Democrat | Barry Platt | 148 | 6.6 | −28.1 | |
| Turnout | 2,231 | 29.9 | |||
| Conservative hold | Swing | ||||
References
- ↑ "County Council Election – 2nd May 2013". Cambridgeshire County Council. 28 March 2013. Retrieved 2 April 2013.
- ↑ "Cambridgeshire County Council election: Tories lose control". BBC News. 3 May 2013. Retrieved 6 May 2013.
- ↑ "The Representation of the People (Form of Canvass) (England and Wales) Regulations 2006, Schedule Part 1". Legislation.gov.uk. 13 October 2011. Retrieved 18 April 2012.
- ↑ "I have two homes. Can I register at both addresses?". The Electoral Commission. Retrieved 5 January 2011.
- 1 2 3 4 5 6 7 8 9 10 "Statement of Persons Nominated". Fenland District Council. 5 April 2013. Retrieved 5 April 2013.
- ↑ "Victories for Labour make it city's biggest party". Cambridge News. 3 May 2013. Retrieved 6 May 2013.
- ↑ "Cambridgeshire's council leader is Tory Martin Curtis". BBC News. 21 May 2013. Retrieved 10 July 2013.
- ↑ "Cambridgeshire County Council to adopt committee led system of governance in May 2014". Cambs Times 24. 20 June 2013. Retrieved 10 July 2013.
- ↑ "Elections 2013 results". Cambridgeshire County Council. 3 May 2013. Retrieved 4 May 2013.
- ↑ "Results for Cambridgeshire". BBC News. 3 May 2013. Retrieved 4 May 2013.
- 1 2 3 4 5 6 7 8 9 10 11 12 13 14 "Statement of Persons Nominated" (PDF). Cambridge City Council. 5 April 2013. Retrieved 5 April 2013.
- 1 2 3 4 5 6 7 8 9 10 11 12 13 14 "Election 2013 results for Cambridge City district". 3 May 2013. Retrieved 4 May 2013.
- ↑ "Burwell Division - Statement as to Persons Nominated" (PDF). East Cambridgeshire District Council. 5 April 2013. Retrieved 5 April 2013.
- 1 2 3 4 5 6 7 8 "Election results 2013 for East Cambridgeshire district". Cambridgeshire County Council. 3 May 2013. Retrieved 4 May 2013.
- ↑ "Ely North and East Division - Statement as to Persons Nominated" (PDF). East Cambridgeshire District Council. 5 April 2013. Retrieved 5 April 2013.
- ↑ "Ely South and West Division - Statement as to Persons Nominated" (PDF). East Cambridgeshire District Council. 5 April 2013. Retrieved 5 April 2013.
- ↑ "Haddenham Division - Statement as to Persons Nominated" (PDF). East Cambridgeshire District Council. 5 April 2013. Retrieved 5 April 2013.
- ↑ "Littleport Division - Statement as to Persons Nominated" (PDF). East Cambridgeshire District Council. 5 April 2013. Retrieved 5 April 2013.
- ↑ "Soham and Fordham Villages Division - Statement as to Persons Nominated" (PDF). East Cambridgeshire District Council. 5 April 2013. Retrieved 5 April 2013.
- ↑ "Sutton Division - Statement as to Persons Nominated" (PDF). East Cambridgeshire District Council. 5 April 2013. Retrieved 5 April 2013.
- ↑ "Woodditton Division - Statement as to Persons Nominated" (PDF). East Cambridgeshire District Council. 5 April 2013. Retrieved 5 April 2013.
- 1 2 3 4 5 6 7 8 9 10 11 "Election results 2013 for Fenland district". Cambridgeshire County Council. 3 May 2013. Retrieved 4 May 2013.
- 1 2 "Notice of Poll". Fenland District Council. 11 April 2013. Retrieved 14 April 2013.
- 1 2 3 4 5 6 7 8 9 10 11 12 13 "Statement of Persons Nominated" (PDF). Huntingdonshire District Council. 5 April 2013. Retrieved 5 April 2013.
- 1 2 3 4 5 6 7 8 9 10 11 12 13 "Election 2013 results for Huntingdonshire district". Cambridgeshire County Council. 3 May 2013. Retrieved 6 May 2013.
- 1 2 3 4 5 6 7 8 9 10 11 12 13 14 "Statement of Persons Nominated". South Cambridgeshire District Council. 5 April 2013. Retrieved 5 April 2013.
- 1 2 3 4 5 6 7 8 9 10 11 12 13 14 "Election results 2013 for South Cambridgeshire district". Cambridgeshire County Council. 3 May 2013. Retrieved 6 May 2013.
| Cambridgeshire County Council | |
|---|---|
| Peterborough City Council | |
| Cambridge City Council | |
| East Cambridgeshire District Council |
|
| Fenland District Council | |
| Huntingdonshire District Council | |
| South Cambridgeshire District Council | |
| Isle of Ely County Council |
|
| Huntingdon & Peterborough County Council |
|
| |