Huntingdonshire District Council election, 2008
The 2008 Huntingdonshire District Council election took place on 1 May 2008 to elect members of Huntingdonshire District Council in Cambridgeshire, England. One third of the council was up for election and the Conservative party stayed in overall control of the council.[1]
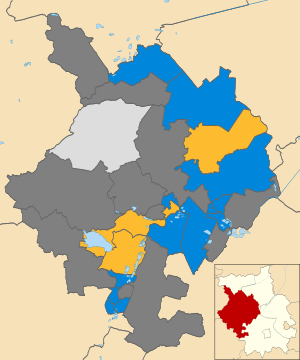
After the election, the composition of the council was
Background
Before the election the Conservatives controlled the council with 39 seats, compared to 11 Liberal Democrats and 2 independents.[3] 18 seats were contested at the election by a total of 69 candidates, with the Conservatives defending 14 of the seats.[3][4]
Among the councillors who were defending seats were the Conservative leader of the council, Ian Bates, in The Hemingfords ward, and the leader of the Liberal Democrats on the council, Peter Downes in Brampton.[3] Ian Bates was challenged by an independent candidate, Maxine Hay, who had become a road safety campaigner after her son was killed after being hit by a car, with the Liberal Democrat candidate for the seat withdrawing in her favour.[5]
Election result
The Liberal Democrats made a net gain of 1 seat to move to 12 councillors at the expense of the Conservatives who remained in control of the council with 38 seats.[6] The Liberal Democrats gained seats in Buckden and Huntingdon East from the Conservatives, but lost a seat back to them in St Neots Eaton Socon.[6]
| Huntingdonshire local election result 2008[7][8] | ||||||||||
|---|---|---|---|---|---|---|---|---|---|---|
| Party | Seats | Gains | Losses | Net gain/loss | Seats % | Votes % | Votes | +/− | ||
| Conservative | 13 | 1 | 2 | -1 | 72.2 | 52.7 | 16,920 | -5.2% | ||
| Liberal Democrat | 4 | 2 | 1 | +1 | 22.2 | 29.9 | 9,593 | -1.5% | ||
| Independent | 1 | 0 | 0 | 0 | 5.6 | 5.2 | 1,681 | +5.2% | ||
| Labour | 0 | 0 | 0 | 0 | 0 | 6.1 | 1,948 | -2.0% | ||
| UKIP | 0 | 0 | 0 | 0 | 0 | 5.6 | 1,796 | +5.0% | ||
| Green | 0 | 0 | 0 | 0 | 0 | 0.6 | 181 | -0.4% | ||
Ward results
| Party | Candidate | Votes | % | ± | |
|---|---|---|---|---|---|
| Liberal Democrat | Peter Downes | 1,415 | 57.3 | +6.5 | |
| Conservative | Keith Stukins | 1,007 | 40.8 | -5.3 | |
| Labour | Patrick Kadewere | 49 | 2.0 | -1.2 | |
| Majority | 408 | 16.5 | +11.8 | ||
| Turnout | 2,471 | 52.2 | +0.5 | ||
| Liberal Democrat hold | Swing | ||||
| Party | Candidate | Votes | % | ± | |
|---|---|---|---|---|---|
| Liberal Democrat | Terry Clough | 795 | 59.4 | +20.1 | |
| Conservative | Alan Barber | 514 | 38.4 | -18.4 | |
| Labour | Thelma Lomax | 30 | 2.2 | -1.7 | |
| Majority | 281 | 21.0 | |||
| Turnout | 1,339 | 52.9 | +1.1 | ||
| Liberal Democrat gain from Conservative | Swing | ||||
| Party | Candidate | Votes | % | ± | |
|---|---|---|---|---|---|
| Conservative | Peter Godley | 872 | 46.7 | -3.8 | |
| Liberal Democrat | Graham Wilson | 841 | 45.0 | +2.2 | |
| UKIP | Shirley Reeve | 79 | 4.2 | +4.2 | |
| Labour | Ann Beevor | 76 | 4.1 | -2.5 | |
| Majority | 31 | 1.7 | -6.0 | ||
| Turnout | 1,868 | 40.9 | -2.2 | ||
| Conservative hold | Swing | ||||
| Party | Candidate | Votes | % | ± | |
|---|---|---|---|---|---|
| Liberal Democrat | Michael Shellens | 1,239 | 47.3 | +9.6 | |
| Conservative | Malcolm Lyons | 1,016 | 38.8 | -10.3 | |
| Labour | Ruth Pugh | 154 | 5.9 | -2.0 | |
| UKIP | Derek Norman | 145 | 5.5 | +5.5 | |
| Green | Angela Mander-Jones | 64 | 2.4 | -2.8 | |
| Majority | 223 | 8.5 | |||
| Turnout | 2,618 | 38.9 | +2.8 | ||
| Liberal Democrat gain from Conservative | Swing | ||||
| Party | Candidate | Votes | % | ± | |
|---|---|---|---|---|---|
| Conservative | Jeff Dutton | 473 | 47.2 | +11.4 | |
| Liberal Democrat | John Morgan | 300 | 29.9 | -7.8 | |
| Labour | David King | 147 | 14.7 | -5.6 | |
| UKIP | Peter Ashcroft | 83 | 8.3 | +8.3 | |
| Majority | 173 | 17.2 | |||
| Turnout | 1,003 | 26.1 | -1.2 | ||
| Conservative hold | Swing | ||||
| Party | Candidate | Votes | % | ± | |
|---|---|---|---|---|---|
| Conservative | Kenneth Churchill | 806 | 69.1 | -0.9 | |
| Independent | Frank Owens | 196 | 16.8 | +16.8 | |
| Liberal Democrat | Alan Cummings | 65 | 5.6 | -17.9 | |
| Labour | Chrissy Ellarby | 51 | 4.4 | -2.1 | |
| Green | Sarah Boulton | 49 | 4.2 | +4.2 | |
| Majority | 610 | 52.3 | +5.8 | ||
| Turnout | 1,167 | 48.0 | -0.8 | ||
| Conservative hold | Swing | ||||
| Party | Candidate | Votes | % | ± | |
|---|---|---|---|---|---|
| Conservative | Phillip Swales | 957 | 46.2 | -11.8 | |
| Liberal Democrat | Malcolm Hollis | 564 | 27.2 | -7.1 | |
| UKIP | Peter Reeve | 452 | 21.8 | +21.8 | |
| Labour | Susan Coomey | 100 | 4.8 | -2.9 | |
| Majority | 393 | 19.0 | -4.8 | ||
| Turnout | 2,073 | 32.5 | +3.9 | ||
| Conservative hold | Swing | ||||
| Party | Candidate | Votes | % | ± | |
|---|---|---|---|---|---|
| Independent | Dick Tuplin | 1,023 | 53.1 | +1.6 | |
| Conservative | Vivienne McGuire | 824 | 42.8 | +7.9 | |
| Labour | Kevin Goddard | 79 | 4.1 | +0.3 | |
| Majority | 199 | 10.3 | -6.2 | ||
| Turnout | 1,926 | 38.8 | +0.9 | ||
| Independent hold | Swing | ||||
| Party | Candidate | Votes | % | ± | |
|---|---|---|---|---|---|
| Conservative | Steve Criswell | 1,123 | 63.4 | -2.6 | |
| Liberal Democrat | Tony Hulme | 502 | 28.3 | +0.3 | |
| UKIP | Julian Fairweather | 80 | 4.5 | +4.5 | |
| Labour | Mary Howell | 66 | 3.7 | -2.3 | |
| Majority | 621 | 35.1 | -3.0 | ||
| Turnout | 1,771 | 39.3 | +1.3 | ||
| Conservative hold | Swing | ||||
| Party | Candidate | Votes | % | ± | |
|---|---|---|---|---|---|
| Conservative | Jason Ablewhite | 864 | 55.2 | -3.0 | |
| Liberal Democrat | Robin Waters | 321 | 20.5 | -9.7 | |
| UKIP | Michael Horwood | 276 | 17.6 | +17.6 | |
| Labour | Angela Richards | 105 | 6.7 | -4.9 | |
| Majority | 543 | 34.7 | +6.6 | ||
| Turnout | 1,566 | 31.3 | +6.4 | ||
| Conservative hold | Swing | ||||
| Party | Candidate | Votes | % | ± | |
|---|---|---|---|---|---|
| Conservative | John Davies | 1,231 | 65.8 | +10.3 | |
| Liberal Democrat | David Hodge | 483 | 25.8 | -10.2 | |
| Labour | John Watson | 156 | 8.3 | -0.1 | |
| Majority | 748 | 40.0 | +20.5 | ||
| Turnout | 1,870 | 40.0 | +4.5 | ||
| Conservative hold | Swing | ||||
| Party | Candidate | Votes | % | ± | |
|---|---|---|---|---|---|
| Conservative | Julie Dew | 464 | 43.1 | -7.2 | |
| Liberal Democrat | Colin Saunderson | 381 | 35.4 | -6.3 | |
| UKIP | Margaret King | 168 | 15.6 | +15.6 | |
| Labour | Ros Trayner | 63 | 5.9 | -2.1 | |
| Majority | 83 | 7.7 | -0.9 | ||
| Turnout | 1,076 | 49.0 | +5.4 | ||
| Conservative hold | Swing | ||||
| Party | Candidate | Votes | % | ± | |
|---|---|---|---|---|---|
| Conservative | Bob Farrer | 1,132 | 61.1 | +5.1 | |
| Liberal Democrat | Keith Franks | 562 | 30.3 | -8.1 | |
| Labour | David Brown | 92 | 5.0 | -0.6 | |
| Green | Karen How | 68 | 3.7 | +3.7 | |
| Majority | 570 | 30.7 | +13.1 | ||
| Turnout | 1,854 | 34.8 | -2.5 | ||
| Conservative hold | Swing | ||||
| Party | Candidate | Votes | % | ± | |
|---|---|---|---|---|---|
| Conservative | Mandy Thomas | 911 | 57.5 | +10.8 | |
| Liberal Democrat | Derek Giles | 620 | 39.2 | -8.3 | |
| Labour | Carole Hitchings | 52 | 3.3 | -2.5 | |
| Majority | 291 | 18.4 | |||
| Turnout | 1,583 | 37.8 | +3.9 | ||
| Conservative gain from Liberal Democrat | Swing | ||||
| Party | Candidate | Votes | % | ± | |
|---|---|---|---|---|---|
| Conservative | Andrew Hansard | 1,031 | 54.9 | +13.7 | |
| Liberal Democrat | Diana Collins | 666 | 35.4 | -0.6 | |
| Labour | William O'Connor | 182 | 9.7 | +0.5 | |
| Majority | 365 | 19.4 | +14.2 | ||
| Turnout | 1,879 | 25.5 | -4.5 | ||
| Conservative hold | Swing | ||||
| Party | Candidate | Votes | % | ± | |
|---|---|---|---|---|---|
| Conservative | Ian Bates | 1,412 | 69.1 | +3.3 | |
| Independent | Maxine Hay | 462 | 22.6 | +22.6 | |
| Labour | Jacqueline Gilbert | 168 | 8.2 | +2.9 | |
| Majority | 950 | 46.5 | +9.7 | ||
| Turnout | 2,042 | 43.8 | -1.5 | ||
| Conservative hold | Swing | ||||
| Party | Candidate | Votes | % | ± | |
|---|---|---|---|---|---|
| Liberal Democrat | Peter Ward | 839 | 46.0 | +9.2 | |
| Conservative | Jill Travener | 787 | 43.2 | -14.8 | |
| UKIP | Lisa Duffy | 138 | 7.6 | +7.6 | |
| Labour | Graeme Watkins | 59 | 3.2 | -2.0 | |
| Majority | 52 | 2.9 | |||
| Turnout | 1,823 | 38.7 | +0.7 | ||
| Liberal Democrat hold | Swing | ||||
| Party | Candidate | Votes | % | ± | |
|---|---|---|---|---|---|
| Conservative | John Watt | 1,496 | 68.3 | -6.6 | |
| UKIP | Robert Brown | 375 | 17.1 | +17.1 | |
| Labour | Margaret Cochrane | 319 | 14.6 | -10.5 | |
| Majority | 1,121 | 51.2 | +1.3 | ||
| Turnout | 2,190 | 28.5 | +0.9 | ||
| Conservative hold | Swing | ||||
By-elections between 2008 and 2010
Ramsey April 2009
A by-election was held in Ramsey on 2 April 2009 after the death of Conservative councillor Ross Muir.[9] The seat was held for the Conservatives by Andy Monk with a majority of 106 votes over Peter Reeve of the UK Independence Party.[9]
| Party | Candidate | Votes | % | ± | |
|---|---|---|---|---|---|
| Conservative | Andy Monk | 626 | 38.1 | -8.1 | |
| UKIP | Peter Reeve | 520 | 31.6 | +9.8 | |
| Liberal Democrat | Robert Mumford | 432 | 26.3 | -0.9 | |
| Labour | Graham Watkins | 67 | 4.1 | -0.7 | |
| Majority | 106 | 6.4 | -12.6 | ||
| Turnout | 1,645 | 25.8 | -6.7 | ||
| Conservative hold | Swing | ||||
Ramsey July 2009
A by-election was held in Ramsey on 23 July 2009 after the death of Liberal Democrat councillor Ray Powell.[11] The seat was gained for the UK Independence Party by Peter Reeve with a majority of 184 votes over the Conservative Angela Curtis.[11]
| Party | Candidate | Votes | % | ± | |
|---|---|---|---|---|---|
| UKIP | Peter Reeve | 753 | 39.2 | +7.6 | |
| Conservative | Angela Curtis | 569 | 29.6 | -8.5 | |
| Independent | Jeffrey Clarke | 303 | 15.8 | +15.8 | |
| Liberal Democrat | Melanie Allgood | 295 | 15.4 | -10.9 | |
| Majority | 184 | 9.6 | |||
| Turnout | 1,920 | 30.1 | +4.3 | ||
| UKIP gain from Liberal Democrat | Swing | ||||
Huntingdon North
A by-election was held in Huntingdon North on 29 October 2009 after Liberal Democrat councillor Sam Kemp resigned from the council.[12] The seat was held for the Liberal Democrats by Trish Shrapnel with a majority of 30 votes over Conservative Laine Kadic, in a seat won by the Conservatives at the last council election in 2008.[12][13]
| Party | Candidate | Votes | % | ± | |
|---|---|---|---|---|---|
| Liberal Democrat | Trish Shrapnel | 243 | 32.6 | +2.7 | |
| Conservative | Laine Kadic | 213 | 28.6 | -18.6 | |
| UKIP | Peter Ashcroft | 167 | 22.4 | +14.1 | |
| Labour | Ann Beevor | 123 | 16.5 | +1.8 | |
| Majority | 30 | 4.0 | |||
| Turnout | 746 | 19.0 | -7.1 | ||
| Liberal Democrat hold | Swing | ||||
Fenstanton
A by-election was held in Fenstanton on 25 February 2010 after Conservative councillor Paul Dakers resigned from the council saying that all political parties were hopeless.[14][15] The seat was gained by Liberal Democrat Colin Saunderson from the Conservatives, with a majority of 54 votes.[15]
| Party | Candidate | Votes | % | ± | |
|---|---|---|---|---|---|
| Liberal Democrat | Colin Saunderson | 391 | 51.1 | +4.2 | |
| Conservative | David O'Neill | 337 | 44.1 | -4.1 | |
| Labour | Angela Richards | 37 | 4.8 | -0.1 | |
| Majority | 54 | 7.1 | |||
| Turnout | 765 | 31.0 | -6.7 | ||
| Liberal Democrat gain from Conservative | Swing | ||||
References
- ↑ "Huntingdonshire". BBC News Online. 2 May 2008. Retrieved 6 July 2014.
- ↑ "Full election results". The Guardian. The Guardian. 3 May 2008.
- 1 2 3 "Two leaders are seeking re-election". Peterborough Evening Telegraph. NewsBank. 10 April 2008.
- ↑ "Sixty-nine candidates to contest HDC seats in May". Hunts Post. 4 April 2008. Retrieved 8 July 2014.
- ↑ "Lib Dems' tactical withdrawal clears way for bid to oust HDC leader". Hunts Post. 9 April 2008.
- 1 2 "LibDems make a gain in Huntingdonshire". Peterborough Evening Telegraph. NewsBank. 2 May 2008.
- ↑ "Results - Local elections 08". The Times. NewsBank. 3 May 2008.
- 1 2 3 4 5 6 7 8 9 10 11 12 13 14 15 16 17 18 19 "District Council Election" (PDF). Huntingdonshire District Council. Retrieved 6 July 2014.
- 1 2 3 "Successful poll day for Hunts Tories". Hunts Post. 3 April 2009. Retrieved 6 July 2014.
- 1 2 3 4 "Local Authority Byelection Results". Retrieved 6 July 2014.
- 1 2 3 "Election victory for UKIP". Cambridge News. 24 July 2009. Retrieved 6 July 2014.
- 1 2 3 "Lib Dems hold seat in Huntingdon". Peterborough Telegraph. 3 November 2009. Retrieved 6 July 2014.
- 1 2 "Lib Dems hold marginal council seat". Local Government Chronicle. 30 October 2009. Retrieved 6 July 2014.
- ↑ "Angry resignation of Fenstanton's district councillor". Hunts Post. 15 December 2009. Retrieved 6 July 2014.
- 1 2 3 "Lib Dems and Tories gain as Labour vote slips". Press Association. The Independent. 26 February 2010. Retrieved 6 July 2014.
- ↑ "Fenstanton Parish News". Fenstanton. 26 February 2010. Retrieved 6 July 2014.
| Cambridgeshire County Council | |
|---|---|
| Peterborough City Council | |
| Cambridge City Council | |
| East Cambridgeshire District Council |
|
| Fenland District Council | |
| Huntingdonshire District Council | |
| South Cambridgeshire District Council | |
| Isle of Ely County Council |
|
| Huntingdon & Peterborough County Council |
|
| |