Huntingdonshire District Council election, 2011
The 2011 Huntingdonshire District Council election took place on 5 May 2011 to elect members of Huntingdonshire District Council in Cambridgeshire, England. One third of the council was up for election and the Conservative party stayed in overall control of the council.[1]
After the election, the composition of the council was
Background
The leader of the council, Conservative Ian Bates, stood down at the election, with Jason Ablewhite being chosen as the new leader by the Conservative group on the council in March 2011 defeating Doug Dew.[3] Other councillors who stood down at the election included Mike Newman who been a member of the council since the 1970s and the deputy leader of the council Mike Simpson.[4] The Conservatives, Liberal Democrats and Labour contested most seats along with a number of candidates from the UK Independence Party and one independent in St Ives South.[4]
Election result
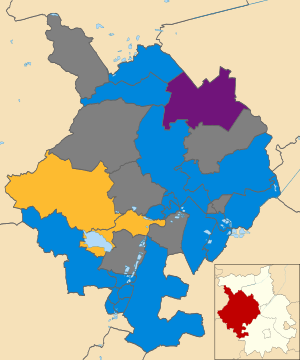
The Conservatives gained 4 seats from the Liberal Democrats to win 19 of the 22 seats on the council that were contested.[5][6] The Liberal Democrats won only 2 seats at the election, with the party losing Kendal Cooper in St Neots Priory Park and Gordon Thorpe in St Neots Eaton Socon,[5] as well as seats in Fenstanton and Huntingdon North.[6] Meanwhile, the UK Independence Party won 1 seat in Ramsey,[5][6] but also took control of Ramsey Town Council, the first council the party took control of in the United Kingdom.[7] Labour failed to win any seats, but did get an increased vote share and got within 41 votes in Huntingdon North.[6]
| Huntingdonshire local election result 2011[2][8] | ||||||||||
|---|---|---|---|---|---|---|---|---|---|---|
| Party | Seats | Gains | Losses | Net gain/loss | Seats % | Votes % | Votes | +/− | ||
| Conservative | 19 | 4 | 0 | +4 | 86.4 | 55.1 | 23,438 | +7.5% | ||
| Liberal Democrat | 2 | 0 | 4 | -4 | 9.1 | 21.6 | 9,209 | -10.7% | ||
| UKIP | 1 | 0 | 0 | 0 | 4.5 | 8.2 | 3,492 | -0.5% | ||
| Labour | 0 | 0 | 0 | 0 | 0 | 13.2 | 5,624 | +3.1% | ||
| Independent | 0 | 0 | 0 | 0 | 0 | 1.9 | 811 | +1.4% | ||
Ward results
| Party | Candidate | Votes | % | ± | |
|---|---|---|---|---|---|
| Liberal Democrat | Patricia Jordan | 1,254 | 50.2 | -7.1 | |
| Conservative | Florendia Theodorou | 1,027 | 41.1 | +0.3 | |
| Labour | Marion Kadewere | 216 | 8.7 | +6.7 | |
| Majority | 227 | 9.1 | -7.4 | ||
| Turnout | 2,497 | 53.4 | +1.2 | ||
| Liberal Democrat hold | Swing | ||||
| Party | Candidate | Votes | % | ± | |
|---|---|---|---|---|---|
| Conservative | Philip Godfrey | 1,410 | 61.7 | +8.1 | |
| Labour | Iain Ramsbottom | 335 | 14.7 | +6.3 | |
| Liberal Democrat | Anthony Hulme | 323 | 14.1 | -13.7 | |
| UKIP | Raymond Zetter | 217 | 9.5 | -0.6 | |
| Majority | 1,075 | 47.0 | +21.2 | ||
| Turnout | 2,285 | 48.3 | -26.2 | ||
| Conservative hold | Swing | ||||
| Party | Candidate | Votes | % | ± | |
|---|---|---|---|---|---|
| Liberal Democrat | Michael Baker | 755 | 53.0 | -4.1 | |
| Conservative | James Bevan | 567 | 39.8 | -3.1 | |
| Labour | Kevin Goddard | 102 | 7.2 | +7.2 | |
| Majority | 188 | 13.2 | -1.0 | ||
| Turnout | 1,424 | 60.8 | +2.9 | ||
| Liberal Democrat hold | Swing | ||||
| Party | Candidate | Votes | % | ± | |
|---|---|---|---|---|---|
| Conservative | Gregory Harlock | 666 | 56.0 | +7.8 | |
| Liberal Democrat | Colin Saunderson | 365 | 30.7 | -16.2 | |
| Labour | Angela Richards | 158 | 13.3 | +8.4 | |
| Majority | 301 | 25.3 | +24.0 | ||
| Turnout | 1,189 | 49.9 | +12.2 | ||
| Conservative gain from Liberal Democrat | Swing | ||||
| Party | Candidate | Votes | % | ± | |
|---|---|---|---|---|---|
| Conservative | Barbara Boddington | 1,450 | 76.6 | +14.1 | |
| Liberal Democrat | Anna Hayward | 223 | 11.8 | -17.5 | |
| Labour | Idris Davies | 220 | 11.6 | +3.4 | |
| Majority | 1,227 | 64.8 | +31.6 | ||
| Turnout | 1,893 | 52.9 | -23.8 | ||
| Conservative hold | Swing | ||||
| Party | Candidate | Votes | % | ± | |
|---|---|---|---|---|---|
| Conservative | Saeed Akthar | 1,424 | 49.0 | +9.7 | |
| Liberal Democrat | Kevin Sumner | 989 | 34.0 | -12.2 | |
| Labour | Ruth Pugh | 492 | 16.9 | +6.8 | |
| Majority | 435 | 15.0 | |||
| Turnout | 2,905 | 43.0 | -21.8 | ||
| Conservative hold | Swing | ||||
| Party | Candidate | Votes | % | ± | |
|---|---|---|---|---|---|
| Conservative | Alan Mackender-Lawrence | 385 | 34.1 | -13.1 | |
| Labour | Patrick Kadewere | 344 | 30.5 | +15.8 | |
| Liberal Democrat | Patricia Shrapnel | 218 | 19.3 | -10.6 | |
| UKIP | Peter Ashcroft | 181 | 16.0 | +7.7 | |
| Majority | 41 | 3.6 | -13.6 | ||
| Turnout | 1,128 | 30.4 | +4.3 | ||
| Conservative gain from Liberal Democrat | Swing | ||||
| Party | Candidate | Votes | % | ± | |
|---|---|---|---|---|---|
| Conservative | Thomas Sanderson | 1,165 | 62.6 | +14.8 | |
| Labour | David King | 283 | 15.2 | +2.5 | |
| Liberal Democrat | Michael Burrell | 280 | 15.1 | -15.2 | |
| UKIP | Derek Norman | 132 | 7.1 | +0.7 | |
| Majority | 882 | 47.4 | +29.9 | ||
| Turnout | 1,860 | 39.7 | -23.3 | ||
| Conservative hold | Swing | ||||
| Party | Candidate | Votes | % | ± | |
|---|---|---|---|---|---|
| Conservative | Jonathan Gray | 1,043 | 71.5 | -2.3 | |
| Liberal Democrat | Roy Benford | 192 | 13.2 | -10.3 | |
| UKIP | Jennifer O'Dell | 112 | 7.7 | +7.7 | |
| Labour | David Underwood | 111 | 7.6 | +4.9 | |
| Majority | 851 | 58.4 | +8.1 | ||
| Turnout | 1,458 | 57.9 | +3.9 | ||
| Conservative hold | Swing | ||||
| Party | Candidate | Votes | % | ± | |
|---|---|---|---|---|---|
| Conservative | Kenneth Churchill | 898 | 74.5 | +5.4 | |
| Liberal Democrat | Alan Cummings | 159 | 13.2 | +7.6 | |
| Labour | Steven Sweeney | 149 | 12.4 | +8.0 | |
| Majority | 739 | 61.3 | +9.0 | ||
| Turnout | 1,206 | 46.0 | -2.0 | ||
| Conservative hold | Swing | ||||
| Party | Candidate | Votes | % | ± | |
|---|---|---|---|---|---|
| UKIP | Ian Curtis | 1,503 | 53.1 | +8.0 | |
| Conservative | Susan Normington | 1,016 | 35.9 | -0.5 | |
| Labour | Susan Coomey | 309 | 10.9 | +5.2 | |
| Majority | 487 | 17.2 | +8.5 | ||
| Turnout | 2,828 | 43.9 | -22.2 | ||
| UKIP hold | Swing | ||||
| Party | Candidate | Votes | % | ± | |
|---|---|---|---|---|---|
| Conservative | Graham Bull | 1,255 | 59.6 | -3.8 | |
| Liberal Democrat | Anthony Jebson | 357 | 17.0 | -11.3 | |
| Labour | David Brown | 287 | 13.6 | +9.9 | |
| UKIP | Michael Horwood | 206 | 9.8 | +5.3 | |
| Majority | 898 | 42.7 | +7.6 | ||
| Turnout | 2,105 | 46.3 | +7.0 | ||
| Conservative hold | Swing | ||||
| Party | Candidate | Votes | % | ± | |
|---|---|---|---|---|---|
| Conservative | John Davies | 1,066 | 47.0 | +0.0 | |
| Independent | Jonathan Salt | 811 | 35.7 | +35.7 | |
| Labour | Richard Allen | 175 | 7.7 | -2.3 | |
| Liberal Democrat | John Oliver | 114 | 5.0 | -26.9 | |
| UKIP | Paul Bullen | 103 | 4.5 | -2.2 | |
| Majority | 255 | 11.2 | -3.9 | ||
| Turnout | 2,269 | 45.3 | -19.8 | ||
| Conservative hold | Swing | ||||
| Party | Candidate | Votes | % | ± | |
|---|---|---|---|---|---|
| Conservative | David Harty | 1,549 | 68.7 | +7.6 | |
| Liberal Democrat | Eleanor Mason | 707 | 31.3 | +1.0 | |
| Majority | 842 | 37.3 | +6.6 | ||
| Turnout | 2,256 | 43.7 | +8.9 | ||
| Conservative hold | Swing | ||||
| Party | Candidate | Votes | % | ± | |
|---|---|---|---|---|---|
| Conservative | Roger Harrison | 815 | |||
| Conservative | Andrew Jennings | 709 | |||
| Liberal Democrat | Julia Hayward | 553 | |||
| Liberal Democrat | Gordon Thorpe | 464 | |||
| Labour | David Nicholls | 236 | |||
| Labour | Patricia Nicholls | 223 | |||
| Turnout | 3,000 | 37.2 | -0.6 | ||
| Conservative gain from Liberal Democrat | Swing | ||||
| Conservative hold | Swing | ||||
| Party | Candidate | Votes | % | ± | |
|---|---|---|---|---|---|
| Conservative | Paul Ursell | 1,081 | 45.2 | +9.4 | |
| Liberal Democrat | Robert Moores | 767 | 32.1 | -12.0 | |
| Labour | William O'Connor | 545 | 22.8 | +11.0 | |
| Majority | 314 | 13.1 | +4.9 | ||
| Turnout | 2,393 | 32.9 | -27.1 | ||
| Conservative hold | Swing | ||||
| Party | Candidate | Votes | % | ± | |
|---|---|---|---|---|---|
| Conservative | Paula Longford | 1,204 | 55.8 | +6.4 | |
| Liberal Democrat | Kendal Cooper | 582 | 27.0 | -13.2 | |
| Labour | Emlyn Rees | 371 | 17.2 | +6.8 | |
| Majority | 622 | 28.8 | +19.6 | ||
| Turnout | 2,157 | 41.3 | -24.1 | ||
| Conservative gain from Liberal Democrat | Swing | ||||
| Party | Candidate | Votes | % | ± | |
|---|---|---|---|---|---|
| Conservative | Peter Mitchell | 655 | 59.8 | -21.5 | |
| Labour | Mary Howell | 177 | 16.1 | -2.6 | |
| UKIP | Roger Henson | 174 | 15.9 | +15.9 | |
| Liberal Democrat | Christopher Waites | 90 | 8.2 | +8.2 | |
| Majority | 478 | 43.6 | -19.0 | ||
| Turnout | 1,096 | 46.9 | +7.0 | ||
| Conservative hold | Swing | ||||
| Party | Candidate | Votes | % | ± | |
|---|---|---|---|---|---|
| Conservative | Alan Williams | 1,675 | 62.7 | +5.5 | |
| Liberal Democrat | David Priestman | 506 | 18.9 | -7.7 | |
| Labour | John Watson | 286 | 10.7 | +2.7 | |
| UKIP | James Finnie | 205 | 7.7 | +7.7 | |
| Majority | 1,169 | 43.8 | +13.2 | ||
| Turnout | 2,672 | 55.8 | -21.6 | ||
| Conservative hold | Swing | ||||
| Party | Candidate | Votes | % | ± | |
|---|---|---|---|---|---|
| Conservative | Robin Howe | 602 | 56.9 | +2.3 | |
| UKIP | Robert Brown | 252 | 23.8 | +3.8 | |
| Liberal Democrat | Patricia Worgan | 125 | 11.8 | -9.4 | |
| Labour | Graeme Watkins | 79 | 7.5 | +3.4 | |
| Majority | 350 | 33.1 | -0.3 | ||
| Turnout | 1,058 | 44.6 | +11.4 | ||
| Conservative hold | Swing | ||||
| Party | Candidate | Votes | % | ± | |
|---|---|---|---|---|---|
| Conservative | Eric Butler | 1,776 | 61.3 | +13.0 | |
| Labour | Margaret Cochrane | 526 | 18.2 | -0.3 | |
| UKIP | John Hyland | 407 | 14.1 | +1.4 | |
| Liberal Democrat | Martin Land | 186 | 6.4 | -14.1 | |
| Majority | 1,250 | 43.2 | +15.4 | ||
| Turnout | 2,895 | 36.6 | -27.1 | ||
| Conservative hold | Swing | ||||
References
- ↑ "England council elections". BBC News Online. 10 May 2011. Retrieved 9 July 2014.
- 1 2 "Local authority elections: England". The Guardian. NewsBank. 7 May 2011.
- ↑ "New Huntingdonshire District Council leader announced". Hunts Post. 23 March 2011. Retrieved 11 July 2014.
- 1 2 "Hunts on May 5 - X marks the spot". Hunts Post. 4 May 2011. Retrieved 11 July 2014.
- 1 2 3 "Tories sweep the board in Huntingdonshire local elections". Hunts Post. 6 May 2011. Retrieved 11 July 2014.
- 1 2 3 4 "Tories take four more seats as Lib Dems slump". Cambridge News. 7 May 2011. Retrieved 11 July 2014.
- ↑ "UKIP takes control of first council". BBC News Online. 13 May 2011. Retrieved 11 July 2014.
- 1 2 3 4 5 6 7 8 9 10 11 12 13 14 15 16 17 18 19 20 21 22 "Declaration of result of poll" (PDF). Huntingdon District Council. Retrieved 9 July 2014.
| Cambridgeshire County Council | |
|---|---|
| Peterborough City Council | |
| Cambridge City Council | |
| East Cambridgeshire District Council |
|
| Fenland District Council | |
| Huntingdonshire District Council | |
| South Cambridgeshire District Council | |
| Isle of Ely County Council |
|
| Huntingdon & Peterborough County Council |
|
| |