Climate of Illinois
The Climate of Illinois describes the weather conditions, and extremes, noted within the state of Illinois, United States, over time.
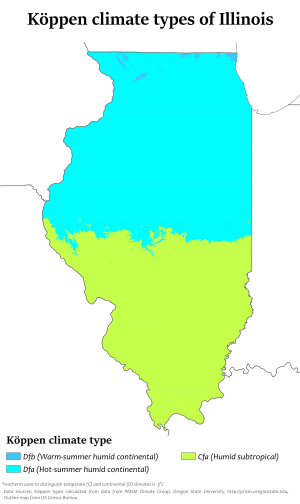
Because of its nearly 400 miles (640 km) length and mid-continental placement, Illinois has a widely varying climate. Most of Illinois has a humid continental climate (Köppen climate classification Dfa) with hot, humid summers and cool to cold winters. The southernmost part of the state, from about Carbondale southward, and the eastern suburbs of St. Louis, border on a humid subtropical climate (Köppen Cfa) with more moderate winters. Average yearly precipitation for Illinois varies from just 48 inches (1,200 mm) at the southern tip to 35 inches (890 mm) in the northern portion of the state. Normal annual snowfall exceeds 38 inches (970 mm) in Chicago, while the southern portion of the state normally receives less than 14 inches (360 mm).[1] The highest temperature recorded in Illinois was 117 °F (47 °C), recorded on July 14, 1954, at East St. Louis, while the lowest temperature was -37 °F (-39 °C), recorded on January 15, 2009, at Rochelle.
Illinois averages around 50 days of thunderstorm activity a year which put it somewhat above average for number of thunderstorm days for the United States. Illinois is vulnerable to tornadoes with an average of 35 occurring annually, which puts much of the state at around 5 tornadoes per 10,000 square miles (30,000 km2) annually.[2] The deadliest tornado on record in the nation occurred largely in Illinois. The Tri-State Tornado of 1925 killed 695 people in three states; 613 of the victims lived in Illinois.[3]
Temperatures

Due to the urban heat island effect, cities tend to be 2 °F (1 °C) warmer on average, which is most noticeable overnight.[4]
Heat
The highest temperature recorded in Illinois was 117 °F (47 °C), recorded on July 14, 1954, at East St. Louis. The 1995 Chicago heat wave was one of the worst weather-related disasters in state history, with 525 dead within a five-day period as overnight lows rose as high as 84 °F (29 °C) and daytime highs rose to 106 °F (41 °C).[5] The most deadly heatwave in the history of the United States struck Illinois during July 1936, which killed 2656 people.[6]
Cold
Extreme temperatures changes can occur within minutes with the passage of a strong cold front through the state. On December 20, 1836, temperatures fell 40 degrees Fahrenheit in minutes, which supposedly froze people to their saddles and chickens in their tracks.[7] The lowest temperature was −37 °F (−38 °C), recorded on January 15, 2009, at Rochelle.[8] However, the official record-lowest temperature for the state is -36 degrees Fahrenheit, recorded at Congerville on 5 January 1999.[9] Prolonged cold struck the upper Midwest between January 30 and February 5, 1996, as low temperatures during the period averaged −25 °F (−32 °C) across the northwest corner of the state.[10]
Averages
| City | Jan | Feb | Mar | Apr | May | Jun | Jul | Aug | Sep | Oct | Nov | Dec |
|---|---|---|---|---|---|---|---|---|---|---|---|---|
| | ||||||||||||
| Cairo[11] | 41/25 | 47/29 | 57/39 | 69/50 | 77/58 | 86/67 | 90/72 | 88/69 | 81/61 | 71/49 | 57/39 | 46/30 |
| Chicago[12] | 31/16 | 35/20 | 47/29 | 59/39 | 70/48 | 80/58 | 84/64 | 82/63 | 75/54 | 62/43 | 48/32 | 35/21 |
| Edwardsville[13] | 36/19 | 42/24 | 52/34 | 64/45 | 75/55 | 84/64 | 85/59 | 86/66 | 79/58 | 68/46 | 53/35 | 41/25 |
| Moline[14] | 30/12 | 36/18 | 48/29 | 62/39 | 73/50 | 83/60 | 86/64 | 84/62 | 76/53 | 64/42 | 48/30 | 34/18 |
| Peoria[15] | 31/14 | 37/20 | 49/30 | 62/40 | 73/51 | 82/60 | 86/65 | 84/63 | 77/54 | 64/42 | 49/31 | 36/20 |
| Rockford[16] | 29/13 | 34/17 | 46/27 | 60/38 | 71/48 | 81/58 | 84/63 | 82/61 | 75/52 | 62/40 | 47/30 | 33/17 |
| Springfield[17] | 33/17 | 39/22 | 51/32 | 63/42 | 74/53 | 83/62 | 86/66 | 84/64 | 78/55 | 67/44 | 51/34 | 38/23 |
Precipitation
Average yearly precipitation for Illinois varies from just over 48 inches (1,200 mm) at the southern tip to just under 32 inches (810 mm) in the northern portion of the state. May and June are the wettest months of the year. Flooding is the most damaging weather hazard within the state. Increased warming within urban heat islands leads to an increase in rainfall downwind of cities. Lake Michigan leads to an increase in winter precipitation along its south shore due to lake effect snow forming over the relatively warm lakes. In summer, the relatively cooler lake leads to a more stable atmosphere near the lake shore, reducing rainfall potential.[4]
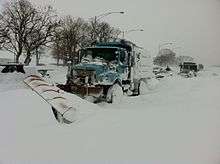
Snowstorms
While normal annual snowfall exceeds 38 inches (970 mm) in Chicago, and the southern portion of the state normally receives less than 14 inches (360 mm),[1] The snowiest winter on record for Chicago was 89.7 inches (228 cm) during the winter of 1978/1979.[18] During the winter of 1830/1831, southern sections of the state were covered with 3 feet (0.91 m) of snow, with drifts up to 6 feet (1.8 m) tall. Storms exceeding the normal winter value are possible within one day. The heaviest snowfall recorded in recent history for Chicago was 23 inches (580 mm) in 10 hours during January 26, 1967.[19]
Thunderstorms and severe weather
Illinois averages around 50 days of thunderstorm activity a year which put it somewhat above average for number of thunderstorm days for the United States. Thunderstorms contribute over half of the annual precipitation statewide.[4] Illinois is vulnerable to tornadoes with an average of 35 occurring annually, which puts much of the state at around 5 tornadoes per 10,000 square miles (30,000 km2) annually.[2] Peak tornado activity occurs between April and June.[4] The deadliest tornado on record in the nation occurred largely in Illinois. The Tri-State Tornado of 1925 killed 695 people in three states; 613 of the victims lived in Illinois.[3] Illinois also receives the remnants of tropical cyclones which have struck the Gulf coast. One of the wetter systems, Tropical Storm Claudette, impacted the state in July 1979 bringing rainfall amounts up to 7.64 inches (194 mm).[20]
See also
- Cold wave
- Heat wave
- List of wettest known tropical cyclone remnants in Illinois
- List of ecoregions in Illinois
References
- 1 2 Illinois State Climatologist Office. Climate Maps for Illinois Archived February 7, 2006, at the Wayback Machine.. Accessed April 22, 2006.
- 1 2 "Annual average number of tornadoes, 1953-2004", NOAA National Climatic Data Center. Retrieved on October 24, 2006.
- 1 2 PAH Webmaster (2005-11-02). "NWS Paducah, KY: NOAA/NWS 1925 Tri-State Tornado Web Site -- General Information". Retrieved 2006-11-16.
- 1 2 3 4 Illinois State Water Survey. Climate of Illinois. Retrieved on 2008-03-19.
- ↑ Illinois State Climate Office. 1995 Chicago Heat Wave. Retrieved on 2008-02-01.
- ↑ Wayne Blanchard. WORST DISASTERS – LIVES LOST (U.S.). Retrieved on 2008-02-01.
- ↑ Minnesota State Climatology Office. This Day in Weather History. Retrieved on 2008-02-01.
- ↑ History for Rochelle, IL: January 15, 2009.. Accessed 2009-01-15
- ↑ . Accessed 2010-07-11
- ↑ Midwestern Regional Climate Center. Climate of the Midwest: Cold and Snow. Retrieved on 2008-02-01.
- ↑ "Average Weather for Cairo, IL",weather.com
- ↑ "Chicago Weather Archived May 24, 2008, at the Wayback Machine.", ustravelweather.com
- ↑ "",weather.com
- ↑ "Moline Weather Archived May 24, 2008, at the Wayback Machine.", ustravelweather.com
- ↑ "Peoria Weather Archived May 24, 2008, at the Wayback Machine.", ustravelweather.com
- ↑ "Rockford Weather Archived May 24, 2008, at the Wayback Machine.", ustravelweather.com
- ↑ "Springfield Weather Archived May 24, 2008, at the Wayback Machine.", ustravelweather.com
- ↑ Tammy Webber (The Associated Press) (2002-01-13). "Windy city has dodged (so far) its annua dose of big snow". St. Louis Post-Dispatch. pp. C4.
- ↑ "The Deep Snow: Winter of 1830–31 has legends that Chicago's records fail to shake". The Illinois Intelligencer. 1968-01-28. Retrieved 2008-02-01.
- ↑ Roth, David M; Weather Prediction Center (January 7, 2013). "Maximum Rainfall caused by Tropical Cyclones and their Remnants Per State (1950–2012)". Tropical Cyclone Point Maxima. United States National Oceanic and Atmospheric Administration's National Weather Service. Retrieved March 15, 2013.