Climate of Florida
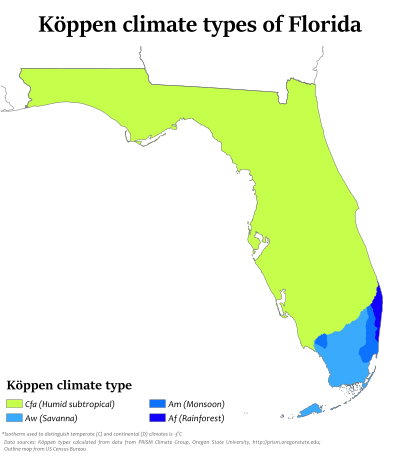
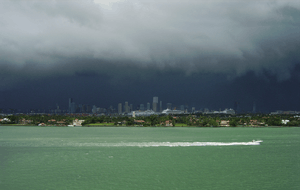
The climate of the north and central parts of the US state of Florida is humid subtropical. South Florida has a tropical savanna climate.[1] There is a defined rainy season from May through October, when air mass thundershowers that build in the heat of the day drop heavy but brief summer rainfall. Late summer and early fall bring decaying tropical lows (and occasionally landfalling tropical cyclones) that contribute to late summer and early fall rains.
In October the dry season sets in across much of Florida (starting early in the month in northern Florida and near the end of the month in deep southern Florida) and lasts until late April in most years. Fronts from mid-latitude storms north of Florida occasionally pass through northern and central parts of the state which bring light and brief winter rainfall. Mid and late winter can become severely dry in Florida. In some years the dry season becomes quite severe and water restrictions are imposed to conserve water. While most areas of Florida do not experience any type of frozen precipitation, north Florida can see fleeting snow or sleet a few times each decade.
The Gulf Stream running through the Florida Straits and then north off the Florida East Coast keeps temperatures moderate a few miles inland from around Stuart on the east coast to Ft. Myers on the west side of the state year round, with few extremes in temperature. The tropical ocean current also provides warm sea surface temperatures, giving Florida beaches the warmest ocean surf waters on the United States mainland.
Pressure
The low pressure measured from an extratropical cyclone was 28.84 inches/976.7 hPa during the Storm of the Century (1993).[2] From a tropical cyclone, the lowest pressure measured was 26.35 inches/892 hPa in the Florida Keys during the Labor Day Hurricane of 1935.[3] The highest known pressure measured statewide was 30.74 inches/1041.1 hPa in Tallahassee on February 5, 1996 and January 4, 1979.[2]
Wind
Over the winter prevailing winds are out of the north across the panhandle south to near Orlando, but are variable in the rest of the state. The summer season sees generally east and southeast winds across the peninsula. During the summer months, the average wind pattern implies a surface ridge axis which normally lies across central Florida, with easterly winds from Tampa southward and southwest winds across northern Florida. The peak wind gust during the 1930 through 1997 period was 115 mph (100 knots) at Miami International Airport during Hurricane Andrew.[4]
African dust outbreaks
In July the trade winds south of the northward-moving subtropical ridge expand northwestward into Florida. On occasion, dust from the Sahara moving around the southern periphery of the ridge moves into the state, suppressing rainfall and changing the sky from a blue to a white appearance and leads to an increase in red sunsets. Its presence negatively impacts air quality across the Southeastern United States during the summer, by adding to the count of airborne particulates. This is in sharp contrast to the normally clean air over Florida and the southeastern USA, which on average is the cleanest air in the USA.[5] Over 50% of the African dust that reaches the United States affects Florida.[6] Since 1970, dust outbreaks have worsened due to periods of drought in Africa. There is a large variability in the dust transport to the Caribbean and Florida from year to year.[7] Dust events are possibly linked to a decline in the health of coral reefs across the Caribbean and Florida, primarily since the 1970s.[8]
Winter
On average, Florida has the mildest winters in the United States. Average lows range from 65 °F (18 °C) in Key West to near 41 °F (5 °C) degrees Fahrenheit at Tallahassee, whereas daytime highs range from 64 °F (18 °C) at Tallahassee to 77 °F (25 °C) at Miami.[9][10] Predominant tropical easterly winds across southern Florida keep temperatures warm during the winter. Occasional strong cold fronts move southward down the peninsula with freezing or near freezing temperatures on a few nights into inland areas of central Florida every few years. A few times each decade Miami might see a winter night fall below 45 F. El Niño winters tend to be cooler due to increased cloud cover, but tend to have fewer freezes.[11]
Four hardiness zones exist. USDA zone 11b is found in Key West and the Florida Keys where average extreme lows range from 40 to 50 °F (4 to 10 °C). Zone 10 is found in coastal South Florida where annual extreme low temperatures range from 30 to 40 °F (−1 to 4 °C). Next is zone 9, where low temperatures range from 20 to 30 °F (−7 to −1 °C). The coolest, zone 8, is located in northernwestern Florida from roughly Gainesville and northwest including Tallahassee. Low temperatures range from 10 to 20 °F (−12 to −7 °C).[12]
Summer
During the summer, minima range from near 70 °F (21 °C) in northern Florida to near 80 °F (27 °C) in the Keys. High temperatures during the summer average in the lower 90s Fahrenheit statewide.[13] Relief from the heat during the summer comes in the form of afternoon and evening thunderstorm activity, late morning and afternoon sea breezes off the relatively cooler ocean, and during the passage of a tropical cyclone. The passage of a cold front through the state is rare during the warm season. The record high temperature for the state is 109 °F (43 °C) at Monticello in 1931.[2]
Fog
Like the remainder of the Southeastern United States, Florida has a winter maximum in dense fog conditions. Unlike the remainder of the region, the maximum in Florida contains roughly half of the annual occurrences per year, on average. Its summer minimum is less than the remainder of the Southeast. The annual number of heavy fog days (with visibility of .25 miles (0.40 km) or less) has ranged from 50 in Tallahassee, to 1 in Key West, the least foggy region in the state. The two types of fog that are most common in Florida are advection and radiational. Fog can be hazardous to early morning commuters. On January 9, 2008, when fog on Interstate 4 combined with smoke from a nearby fire, visibility was reduced to nearly zero. As a result, five individuals died in a 70-car pileup.[14][15]
Precipitation
Averages
Statewide, the highest rainfall amounts occur during the summer months. In northern Florida, there is a weak winter secondary maximum while statewide the driest months of the year are during the spring.[13] During El Niño, Florida sees greater rainfall between November and March.[11] Due to the lack of the secondary maximum across the peninsula, a distinct dry season is seen in the averages from winter through spring. This dry season provokes brush fires annually as temperatures rise during the late spring, before they fade during early June as the rainy season gets underway.
Extremes

The heaviest rainfall to occur in 24 hours was measured in Yankeetown during Hurricane Easy (1950), 38.70 inches (98.3 cm). This is also the highest known point storm total maximum related to any tropical cyclone which has impacted Florida,[16] and by itself would be the highest known rainfall total for any month from any location within Florida. This rainfall amount remained the national 24-hour rainfall record until Tropical Storm Claudette (1979).[17] Heavy rainfall events have fallen due to stalled fronts near the state as well, and occur during the March through May and October through November timeframe.
The wettest month recorded at a Florida climate station was during May 1891 when Gainesville, Florida received 30.90 inches (78.5 cm).[18] The wettest year on record for a Florida climate station was during 1879 when 127.24 inches (323.2 cm) fell at Pensacola, Florida.[19] The driest year for a climate station statewide was during 1974 when only 19.99 inches (50.8 cm) fell at Key West.[20]
One of the worst years for wildfires was in 1998, at the end of an El Nino cycle. 480 wildfires consumed 500,000 acres (2,000 km2) statewide.[21] In 2010, the National Weather Service issued more fire alerts in Florida than anywhere else in the nation.[22]
A statewide drought began in November 2005, one month after Hurricane Wilma's passage through the state, and persisted until 2009.[23] The previous significant drought occurred in 2000, which was the state's driest year on record.[24]
Snowfall

Snowfall is rare in Florida. The earliest recorded occurrence of snow or sleet occurred in 1774 in the far northern portion of the state.[25] The latest occurrence of snow or sleet in the spring fell on January 7, 8, and 9, 2010, as a cold front brought scattered snow flurries in the northern and central portions of the state.[26]
The state record for snowfall is 5 inches (13 cm), set in northern Florida during January 1800, though some debate exists about the accuracy.[27] The earliest in the season that frozen precipitation has fallen was during the Late November 2006 Nor'easter on November 21 across central Florida.[28] The latest in the season that snow or sleet has fallen was on April 8, 2007. Snow flurries has been recorded in the air as far south as Homestead, during a January 19, 1977 event. [29]
Thunderstorms
Florida reports more thunderstorms than any other US state. Some places report in excess of 90 thunderstorm days per year, making Florida one of the most thundery regions outside of the tropics. Florida receives the highest density of lightning strikes within the United States. Several deaths per year are blamed on lightning, making lightning one of the deadliest weather-related phenomenon in the state. However, since 1992, the number of lightning deaths has been slowly dropping despite a rising population, suggesting that lightning awareness programs are effective. The most likely targets of lightning strikes are construction workers and others who work outside, though 12 percent of the cases occurred indoors to people using electronic devices. Severe thunderstorms can sometimes produce hail, very strong straight line winds and tornadoes. Very heavy rainfall from thunderstorms can result in flash flooding. Thunderstorms occur most often during the summer but can occur at any time of the year.[30]
Tornadoes
There are more tornadoes per square mile in Florida than any other state.[31][32] However, these tornadoes tend to be much weaker and short-lived than in other states like the Midwest or Great Plains. Strong tornadoes do occasionally form in Florida, usually in conjunctions with a cold frontal passage in the winter or spring. A total of 42 people died in February 1998 from the deadliest such tornado outbreak in Central Florida, which occurred during the nighttime hours.[33]
While tornadoes in the Midwest are more severe, a higher rate of deaths are experienced in Florida, and Brevard County, specifically, due to higher population density and quantity of manufactured homes.[34]
Tropical cyclones
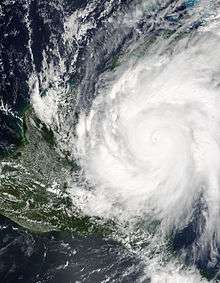
The earliest in the year a tropical cyclone has struck the sunshine state was the Groundhog Day Tropical Storm in 1952. The latest impact was from a hurricane which struck near Tampa on December 1, 1925. The strongest hurricane to strike Florida was the Labor Day Hurricane of 1935. Hurricane Easy in 1950 produced the wettest known point total from any tropical cyclone.[16] The record number of hurricane strikes on the state in one season is four in 2004.[35] Hurricanes typically spawn tornadoes within their northeast quadrant.[36]
Tropical cyclones have affected Florida in every month of the year but January and March. Nearly one-third of the cyclones affected the state in September, and nearly three-fourths of the storms affected the state between August and October, which coincides with the peak of the hurricane season. Portions of the coastline have the lowest return period, or the frequency at which a certain intensity or category of hurricane can be expected within 86 mi (139 km) of a given location, in the country. Monroe County was struck by 26 hurricanes since 1926, which is the greatest total for any county in the United States.[37]
Effect of climate cycles
El Niño has the following effects on Florida climate: above average rainfall in the spring.[21] This is followed by wildfire threat when rain dries up. Northern Florida is more susceptible to severe weather; below normal temperatures, increased number of low pressure systems in the Gulf of Mexico during the winter, and "almost always" reduces the frequency of storms and hurricanes.[38]
La Niña has the following effects: often dry conditions prevail in late fall, winter and early spring, increased risk of wildfires in spring and summer months, the temperatures average slightly above normal, and the chance of hurricane activity increases substantially.[38]
Long term forecasts are made based on these effects. However, they are easily overridden, in winter, by the Arctic oscillation and North Atlantic oscillations, which can only be predicted about two weeks in advance.[39] These can drop the temperature noticeably from seasonal norms.
Climates of selected Florida cities
The climate regime for much of the state is humid subtropical (Köppen Cfa), though portions of the Gold Coast of southeast Florida, as well as all of the Florida Keys, qualify as tropical wet-and-dry (Köppen Aw).
A narrow eastern part of the state including Orlando and Jacksonville receives between 2,400 and 2,800 hours of sunshine annually. The rest of the state, including Miami, receives between 2,800 and 3,200 hours annually.[40]
| Climate data for Pensacola, Florida | |||||||||||||
|---|---|---|---|---|---|---|---|---|---|---|---|---|---|
| Month | Jan | Feb | Mar | Apr | May | Jun | Jul | Aug | Sep | Oct | Nov | Dec | Year |
| Average high °F (°C) | 61.2 (16.2) |
64.4 (18) |
70.2 (21.2) |
76.2 (24.6) |
83.4 (28.6) |
89.0 (31.7) |
90.7 (32.6) |
90.1 (32.3) |
87.0 (30.6) |
79.3 (26.3) |
70.3 (21.3) |
63.4 (17.4) |
77.1 (25.1) |
| Average low °F (°C) | 42.7 (5.9) |
45.4 (7.4) |
51.7 (10.9) |
57.6 (14.2) |
65.8 (18.8) |
72.1 (22.3) |
74.5 (23.6) |
74.2 (23.4) |
70.4 (21.3) |
59.6 (15.3) |
51.1 (10.6) |
44.7 (7.1) |
59.2 (15.1) |
| Average rainfall inches (mm) | 5.34 (135.6) |
4.68 (118.9) |
6.40 (162.6) |
3.89 (98.8) |
4.40 (111.8) |
6.39 (162.3) |
8.02 (203.7) |
6.85 (174) |
5.75 (146) |
4.13 (104.9) |
4.46 (113.3) |
3.97 (100.8) |
64.28 (1,632.7) |
| Source: NOAA | |||||||||||||
| Climate data for Tallahassee, Florida | |||||||||||||
|---|---|---|---|---|---|---|---|---|---|---|---|---|---|
| Month | Jan | Feb | Mar | Apr | May | Jun | Jul | Aug | Sep | Oct | Nov | Dec | Year |
| Average high °F (°C) | 63.9 (17.7) |
66.9 (19.4) |
73.3 (22.9) |
80.0 (26.7) |
86.6 (30.3) |
90.6 (32.6) |
91.5 (33.1) |
91.1 (32.8) |
88.2 (31.2) |
81.0 (27.2) |
72.3 (22.4) |
65.5 (18.6) |
79.2 (26.2) |
| Average low °F (°C) | 39.8 (4.3) |
41.8 (5.4) |
47.4 (8.6) |
53.2 (11.8) |
61.9 (16.6) |
69.2 (20.7) |
71.7 (22.1) |
71.8 (22.1) |
68.5 (20.3) |
57.1 (13.9) |
46.8 (8.2) |
41.2 (5.1) |
55.9 (13.3) |
| Average rainfall inches (mm) | 4.37 (111) |
4.86 (123.4) |
5.72 (145.3) |
3.74 (95) |
4.27 (108.5) |
7.11 (180.6) |
8.27 (210.1) |
7.33 (186.2) |
5.43 (137.9) |
3.17 (80.5) |
3.34 (84.8) |
4.18 (106.2) |
61.79 (1,569.5) |
| Source: Florida Climate Center | |||||||||||||
| Climate data for Jacksonville, Florida | |||||||||||||
|---|---|---|---|---|---|---|---|---|---|---|---|---|---|
| Month | Jan | Feb | Mar | Apr | May | Jun | Jul | Aug | Sep | Oct | Nov | Dec | Year |
| Average high °F (°C) | 65.1 (18.4) |
67.8 (19.9) |
73.6 (23.1) |
79.7 (26.5) |
85.8 (29.9) |
89.8 (32.1) |
91.9 (33.3) |
90.8 (32.7) |
87.1 (30.6) |
80.3 (26.8) |
73.0 (22.8) |
66.5 (19.2) |
79.3 (26.3) |
| Average low °F (°C) | 42.5 (5.8) |
44.9 (7.2) |
50.2 (10.1) |
55.9 (13.3) |
63.7 (17.6) |
70.2 (21.2) |
72.8 (22.7) |
72.7 (22.6) |
70.1 (21.2) |
60.8 (16) |
50.7 (10.4) |
44.0 (6.7) |
58.2 (14.6) |
| Average rainfall inches (mm) | 3.03 (77) |
3.42 (86.9) |
3.72 (94.5) |
2.82 (71.6) |
3.40 (86.4) |
5.99 (152.1) |
6.57 (166.9) |
7.23 (183.6) |
7.83 (198.9) |
3.92 (99.6) |
1.90 (48.3) |
2.61 (66.3) |
62.44 (1,586) |
| Source: Florida Climate Center | |||||||||||||
| Climate data for Orlando, Florida | |||||||||||||
|---|---|---|---|---|---|---|---|---|---|---|---|---|---|
| Month | Jan | Feb | Mar | Apr | May | Jun | Jul | Aug | Sep | Oct | Nov | Dec | Year |
| Average high °F (°C) | 71.8 (22.1) |
73.9 (23.3) |
78.8 (26) |
83.0 (28.3) |
88.2 (31.2) |
91.0 (32.8) |
92.2 (33.4) |
92.0 (33.3) |
90.3 (32.4) |
85.0 (29.4) |
78.9 (26.1) |
73.3 (22.9) |
83.2 (28.4) |
| Average low °F (°C) | 49.9 (9.9) |
51.3 (10.7) |
55.9 (13.3) |
59.9 (15.5) |
65.9 (18.8) |
71.3 (21.8) |
72.6 (22.6) |
73.0 (22.8) |
71.9 (22.2) |
65.5 (18.6) |
58.7 (14.8) |
52.6 (11.4) |
62.4 (16.9) |
| Average rainfall inches (mm) | 2.43 (61.7) |
2.35 (59.7) |
3.54 (89.9) |
2.42 (61.5) |
3.74 (95) |
7.35 (186.7) |
7.15 (181.6) |
6.25 (158.8) |
5.76 (146.3) |
2.73 (69.3) |
2.32 (58.9) |
2.31 (58.7) |
48.35 (1,228.1) |
| Source: Florida Climate Center | |||||||||||||
| Climate data for Tampa, Florida | |||||||||||||
|---|---|---|---|---|---|---|---|---|---|---|---|---|---|
| Month | Jan | Feb | Mar | Apr | May | Jun | Jul | Aug | Sep | Oct | Nov | Dec | Year |
| Average high °F (°C) | 70.1 (21.2) |
71.6 (22) |
76.3 (24.6) |
80.6 (27) |
86.3 (30.2) |
88.9 (31.6) |
89.7 (32.1) |
90.0 (32.2) |
89.0 (31.7) |
84.1 (28.9) |
78.0 (25.6) |
72.0 (22.2) |
81.4 (27.4) |
| Average low °F (°C) | 52.4 (11.3) |
53.8 (12.1) |
58.5 (14.7) |
62.4 (16.9) |
68.9 (20.5) |
74.0 (23.3) |
75.3 (24.1) |
75.4 (24.1) |
74.3 (23.5) |
67.6 (19.8) |
60.7 (15.9) |
54.7 (12.6) |
64.8 (18.2) |
| Average rainfall inches (mm) | 2.27 (57.7) |
2.67 (67.8) |
2.84 (72.1) |
1.80 (45.7) |
2.85 (72.4) |
5.50 (139.7) |
6.49 (164.8) |
7.60 (193) |
6.54 (166.1) |
2.29 (58.2) |
1.62 (41.1) |
2.30 (58.4) |
44.77 (1,137.2) |
| Source: Florida Climate Center | |||||||||||||
| Climate data for Miami, Florida | |||||||||||||
|---|---|---|---|---|---|---|---|---|---|---|---|---|---|
| Month | Jan | Feb | Mar | Apr | May | Jun | Jul | Aug | Sep | Oct | Nov | Dec | Year |
| Average high °F (°C) | 75.7 (24.3) |
77.0 (25) |
79.7 (26.5) |
82.7 (28.2) |
85.9 (29.9) |
88.3 (31.3) |
89.6 (32) |
89.9 (32.2) |
88.4 (31.3) |
85.1 (29.5) |
80.6 (27) |
76.9 (24.9) |
83.3 (28.5) |
| Average low °F (°C) | 59.6 (15.3) |
60.9 (16.1) |
64.3 (17.9) |
68.1 (20.1) |
72.2 (22.3) |
75.1 (23.9) |
76.5 (24.7) |
76.8 (24.9) |
75.9 (24.4) |
72.4 (22.4) |
67.7 (19.8) |
61.8 (16.6) |
69.2 (20.7) |
| Average rainfall inches (mm) | 1.80 (45.7) |
2.12 (53.8) |
2.49 (63.2) |
3.20 (81.3) |
5.91 (150.1) |
9.33 (237) |
6.24 (158.5) |
7.97 (202.4) |
9.11 (231.4) |
6.95 (176.5) |
2.92 (74.2) |
1.95 (49.5) |
59.97 (1,523.2) |
| Source: Florida Climate Center | |||||||||||||
| Climate data for Key West, Florida | |||||||||||||
|---|---|---|---|---|---|---|---|---|---|---|---|---|---|
| Month | Jan | Feb | Mar | Apr | May | Jun | Jul | Aug | Sep | Oct | Nov | Dec | Year |
| Average high °F (°C) | 74.7 (23.7) |
75.7 (24.3) |
78.7 (25.9) |
81.7 (27.6) |
85.2 (29.6) |
88.0 (31.1) |
89.4 (31.9) |
89.6 (32) |
88.2 (31.2) |
84.7 (29.3) |
80.0 (26.7) |
76.1 (24.5) |
82.7 (28.2) |
| Average low °F (°C) | 64.7 (18.2) |
65.6 (18.7) |
68.7 (20.4) |
72.0 (22.2) |
75.7 (24.3) |
78.4 (25.8) |
79.6 (26.4) |
79.4 (26.3) |
78.4 (25.8) |
75.7 (24.3) |
71.2 (21.8) |
66.6 (19.2) |
73.0 (22.8) |
| Average rainfall inches (mm) | 1.96 (49.8) |
1.60 (40.6) |
1.66 (42.2) |
1.82 (46.2) |
3.07 (78) |
4.61 (117.1) |
3.69 (93.7) |
5.30 (134.6) |
6.55 (166.4) |
5.02 (127.5) |
2.49 (63.2) |
2.04 (51.8) |
39.83 (1,011.7) |
| Source: Florida Climate Center | |||||||||||||
See also
- Climate
- Climatology
- List of wettest known tropical cyclones in Florida
- Climate of Miami
- Climate of the Tampa Bay Area
References
- ↑ Köppen Classification Map, clearly showing South Florida has a tropical climate (image will take a few seconds to load)
- 1 2 3 National Weather Service Forecast Office Tallahassee, Florida. Tallahassee Weather Extremes. Retrieved on 2007-06-03. Archived October 14, 2006, at the Wayback Machine.
- ↑ Eric. S. Blake, Edward N. Rappaport, and Christopher W. Landsea. The Deadliest, Costliest, and Most Intense United States Tropical Cyclones from 1851 to 2006 (AND OTHER FREQUENTLY REQUESTED HURRICANE FACTS). Retrieved on 2007-06-03.
- ↑ National Climatic Data Center. Climatic Wind Data for the United States. Retrieved on 2007-06-02. Archived June 13, 2007, at the Wayback Machine.
- ↑ Science Daily. African Dust Called A Major Factor Affecting Southeast U.S. Air Quality. Retrieved on 2007-06-10.
- ↑ Science Daily. Microbes And The Dust They Ride In On Pose Potential Health Risks. Retrieved on 2007-06-10.
- ↑ Usinfo.state.gov. Study Says African Dust Affects Climate in U.S., Caribbean. Retrieved on 2007-06-10.
- ↑ U. S. Geological Survey. Coral Mortality and African Dust. Retrieved on 2007-06-10.
- ↑ Southeast Regional Climate Center. Tallahassee WSO AP Averages from 1948-2005. Retrieved on 2007-06-02.
- ↑ Southeast Regional Climate Center. Key West WSO AP Averages from 1948-2005. Retrieved on 2007-06-02.
- 1 2 South Florida Water Management District. EL NINO IN SOUTH FLORIDA. Retrieved on 2007-06-02. Archived September 16, 2007, at the Wayback Machine.
- ↑ Kridler, Chris (5 March 2011). "Freeze frazzled? Seek hardier plants". Florida Today. Melbourne, Florida. pp. 1D.
- 1 2 Southeast Regional Climate Center. Historical Climate Summaries for Florida. Retrieved on 2007-06-02.
- ↑ Gloria Forthun, M. B. Johnson, W. G. Schmitz, and J. Blume.Trends in Fog Frequency and Duration in the Southeast United States. Retrieved on 2007-06-07.
- ↑ Michael Mogil and Kristen L. Seaman. Florida's Climate and Weather. Retrieved on 2012-16-03.
- 1 2 David Roth. Tropical Cyclone Point Maxima. Retrieved on 2007-06-02.
- ↑ David Roth. Hurricane Easy (1950) Rainfall Graphic. Retrieved on 2007-06-02.
- ↑ Florida Climate Center. Gainesville Precipitation Data. Retrieved on 2007-06-02.
- ↑ Florida Climate Center. Pensacola Precipitation Data. Retrieved on 2007-06-02.
- ↑ Florida Climate Center. Key West Precipitation Data. Retrieved on 2007-06-02.
- 1 2 Waymer, Jim (11 March 2010). "Casualties of cold enhance fire fear". Melbourne, Florida: Florida Today. pp. 3A. Archived from the original on March 14, 2010.
- ↑ Knapp, Andrew (28 February 2011). "Wildfire alerts get stricted". Florida Today. Melbourne, Florida. pp. 1A.
- ↑ Travis Reed.Drought Saps Fla. Growers, Golf Courses Retrieved on 2007-06-02.
- ↑ NOAA. SEVERE DROUGHT CONDITIONS/FIRE DANGER LIKELY TO PERSIST THROUGHOUT CENTRAL FLORIDA. Retrieved on 2007-06-02.
- ↑ T. Frederick Davis (1908). "Climatology of Jacksonville, Fla. and Vicinity" (PDF). U.S. Weather Bureau. Retrieved 2008-03-09.
- ↑ Archived January 11, 2010, at the Wayback Machine.
- ↑ George Winterling (2003-12-04). Snow on the First Coast. Archived June 12, 2007, at the Wayback Machine. Retrieved on 2007-01-22.
- ↑ Local6.com. Snow Falls In Central Florida. Retrieved on 2006-11-26.
- ↑ National Weather Service Forecast Office Tallahassee, Florida. Florida's Top 10 Weather Events of the 20th Century. Retrieved on 2007-06-03. Archived October 14, 2006, at the Wayback Machine.
- ↑ Charles H. Paxton, J. Colson and N. Carlisle (2008). "P2.13 Florida lightning deaths and injuries 2004-2007". American Meteorological Society. Retrieved 2009-09-05.
- ↑ "Top Ten Tornado Lists", tornadoproject.com, archived from the original on 2012-02-04
- ↑ Average Annual Number of Tornadoes, 1991-2010. Downloaded Sunday, 04-Aug-2013 18:25:05 EDT. Last Updated Monday, 20-May-2013 10:45:01 EDT. From National Oceanic and Atmospheric Administration
- ↑ United States Department of Commerce (June 1998). "Service Assessment: Central Florida Tornado Outbreak February 22–23, 1998" (PDF). National Weather Service. Retrieved 2009-09-05.
- ↑ "Study: Florida #1 In Tornadoes and Deaths". Brevard Times. Cocoa Beach, Florida. 2014-06-16. Archived from the original on 2016-03-10.
- ↑ National Hurricane Center. Atlantic Tracks File 1851-2006. Retrieved on 2007-06-02.
- ↑ Atlantic Oceanographic and Meteorological Laboratory, Hurricane Research Division (2006-10-04). "Frequently Asked Questions: Are TC tornadoes weaker than midlatitude tornadoes?". NOAA. Retrieved 2006-07-25.
- ↑ National Hurricane Center (2006). "Tropical Cyclone Climatology". Retrieved 2007-10-02.
- 1 2 Florida Disaster Management accessed March 9, 2008 Archived December 9, 2007, at the Wayback Machine.
- ↑ Rice, Doyle (28 December 2010). "Winter "wild card" in play". Melbourne, Florida: Florida Today. pp. 4A.
- ↑ "united states annual sunshine map". HowStuffWorks, Inc. Archived from the original on 2011-04-29. Retrieved 2011-03-14.
- ↑ "Pensacola Climate Normals". National Oceanic and Atmospheric Administration.
- ↑ "Tallahassee Climate Normals". Florida Climate Center.
- ↑ "Jacksonville Climate Normals". Florida Climate Center.
- ↑ "Orlando Climate Normals". Florida Climate Center.
- ↑ "Tampa Climate Normals". Florida Climate Center.
- ↑ "Miami Climate Normals". Florida Climate Center.
- ↑ "Key West Climate Normals". Florida Climate Center.