Climate of Virginia
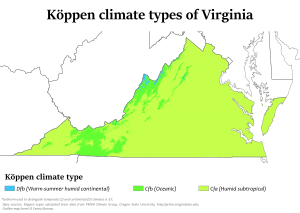

The climate of Virginia, a state on the east coast of the United States, is considered mild compared to other areas of the United States. Most of Virginia east of the Blue Ridge Mountains, the southern part of the Shenandoah Valley, and the Roanoke Valley, has a humid subtropical climate (Köppen climate classification Cfa), typical of the American South. In the mountainous areas west of the Blue Ridge, the climate becomes humid continental (Köppen Dfa) and maritime temperate (Köppen Cfb).[1] Severe weather, in the form of tornadoes, tropical cyclones, and winter storms, impacts the state on a regular basis. Central Virginia received significant snowfall of 20 inches in December 2009.
Climate zones
Many variations occur because of the state's significant relief. Elevations in Virginia vary from sea level to Mount Rogers at 5,729 ft (1,746 m) above sea level, with major gradations occurring at the edges of the Atlantic Ocean, the end of the Piedmont, and the Blue Ridge and Allegheny chains of the Appalachian Mountains. The moderating influence of the ocean from the east, powered by the Gulf Stream, also creates the potential for hurricanes near the mouth of Chesapeake Bay. Cold air masses arrive over the mountains, especially in winter, which can lead to significant snowfalls when coastal storms known as noreasters move up the Atlantic coast. Much of central and southern Virginia however has not had over one foot of snow in a single storm since the Blizzard of February 5, 2010.
The interaction of these elements with the state's topography create micro-climates in the Shenandoah Valley, the mountainous southwest, and the coastal plains that are slightly but noticeably distinct from each other.[2]
Statistics for selected cities
The highest recorded temperature is 115 °F (46 °C) at Balcony Falls on July 15, 1954 and the lowest recorded temperature is −30 °F (−34 °C) at Mountain Lake on January 22, 1985.
| Climate data for Lynchburg, Virginia (Lynchburg Regional Airport), 1981–2010 normals, extremes 1893–present[lower-alpha 1] | |||||||||||||
|---|---|---|---|---|---|---|---|---|---|---|---|---|---|
| Month | Jan | Feb | Mar | Apr | May | Jun | Jul | Aug | Sep | Oct | Nov | Dec | Year |
| Record high °F (°C) | 80 (27) |
82 (28) |
92 (33) |
95 (35) |
100 (38) |
104 (40) |
106 (41) |
105 (41) |
102 (39) |
98 (37) |
83 (28) |
79 (26) |
106 (41) |
| Average high °F (°C) | 45.4 (7.4) |
49.1 (9.5) |
57.9 (14.4) |
68.2 (20.1) |
75.4 (24.1) |
83.2 (28.4) |
86.5 (30.3) |
85.2 (29.6) |
78.3 (25.7) |
68.5 (20.3) |
58.5 (14.7) |
47.8 (8.8) |
67.0 (19.4) |
| Average low °F (°C) | 24.8 (−4) |
27.2 (−2.7) |
33.8 (1) |
42.6 (5.9) |
50.9 (10.5) |
60.1 (15.6) |
64.0 (17.8) |
63.0 (17.2) |
55.7 (13.2) |
44.0 (6.7) |
35.1 (1.7) |
27.3 (−2.6) |
44.0 (6.7) |
| Record low °F (°C) | −10 (−23) |
−11 (−24) |
5 (−15) |
20 (−7) |
31 (−1) |
40 (4) |
49 (9) |
45 (7) |
35 (2) |
21 (−6) |
8 (−13) |
−4 (−20) |
−11 (−24) |
| Average precipitation inches (mm) | 3.14 (79.8) |
2.93 (74.4) |
3.58 (90.9) |
3.31 (84.1) |
3.73 (94.7) |
3.62 (91.9) |
4.36 (110.7) |
3.26 (82.8) |
3.88 (98.6) |
3.11 (79) |
3.41 (86.6) |
3.24 (82.3) |
41.57 (1,055.9) |
| Average snowfall inches (cm) | 4.5 (11.4) |
4.2 (10.7) |
1.8 (4.6) |
0.1 (0.3) |
0 (0) |
0 (0) |
0 (0) |
0 (0) |
0 (0) |
0 (0) |
0.2 (0.5) |
2.1 (5.3) |
12.9 (32.8) |
| Average precipitation days (≥ 0.01 in) | 9.2 | 9.4 | 10.6 | 10.0 | 12.3 | 10.0 | 11.7 | 9.4 | 8.3 | 7.1 | 8.3 | 9.6 | 115.9 |
| Average snowy days (≥ 0.1 in) | 2.0 | 2.0 | 1.0 | 0.1 | 0 | 0 | 0 | 0 | 0 | 0 | 0.1 | 1.3 | 6.5 |
| Mean monthly sunshine hours | 167.0 | 168.2 | 221.7 | 243.7 | 272.3 | 287.5 | 273.4 | 256.6 | 226.5 | 215.4 | 169.6 | 155.9 | 2,657.8 |
| Percent possible sunshine | 54 | 56 | 60 | 62 | 62 | 65 | 61 | 61 | 61 | 62 | 55 | 52 | 60 |
| Source: NOAA (sun 1961–1990)[3][4][5] | |||||||||||||
| Climate data for Norfolk International Airport, Virginia (1981–2010 normals,[lower-alpha 2] extremes 1874–present[lower-alpha 3]) | |||||||||||||
|---|---|---|---|---|---|---|---|---|---|---|---|---|---|
| Month | Jan | Feb | Mar | Apr | May | Jun | Jul | Aug | Sep | Oct | Nov | Dec | Year |
| Record high °F (°C) | 84 (29) |
82 (28) |
92 (33) |
97 (36) |
100 (38) |
102 (39) |
105 (41) |
105 (41) |
100 (38) |
95 (35) |
86 (30) |
82 (28) |
105 (41) |
| Mean maximum °F (°C) | 71.1 (21.7) |
73.2 (22.9) |
80.2 (26.8) |
86.4 (30.2) |
91.4 (33) |
95.5 (35.3) |
97.8 (36.6) |
95.8 (35.4) |
92.1 (33.4) |
85.6 (29.8) |
78.7 (25.9) |
72.5 (22.5) |
98.8 (37.1) |
| Average high °F (°C) | 48.1 (8.9) |
50.9 (10.5) |
58.2 (14.6) |
67.6 (19.8) |
75.4 (24.1) |
83.5 (28.6) |
87.4 (30.8) |
85.1 (29.5) |
79.3 (26.3) |
70.1 (21.2) |
61.1 (16.2) |
52.1 (11.2) |
68.3 (20.2) |
| Average low °F (°C) | 32.7 (0.4) |
34.4 (1.3) |
40.5 (4.7) |
48.9 (9.4) |
57.9 (14.4) |
67.1 (19.5) |
71.9 (22.2) |
70.7 (21.5) |
65.3 (18.5) |
54.0 (12.2) |
44.6 (7) |
36.1 (2.3) |
52.1 (11.2) |
| Mean minimum °F (°C) | 17.6 (−8) |
21.2 (−6) |
27.2 (−2.7) |
35.7 (2.1) |
45.7 (7.6) |
55.5 (13.1) |
63.1 (17.3) |
61.6 (16.4) |
53.7 (12.1) |
39.7 (4.3) |
30.5 (−0.8) |
21.7 (−5.7) |
15.2 (−9.3) |
| Record low °F (°C) | −3 (−19) |
2 (−17) |
14 (−10) |
23 (−5) |
36 (2) |
45 (7) |
54 (12) |
49 (9) |
40 (4) |
27 (−3) |
17 (−8) |
5 (−15) |
−3 (−19) |
| Average precipitation inches (mm) | 3.40 (86.4) |
3.12 (79.2) |
3.68 (93.5) |
3.41 (86.6) |
3.41 (86.6) |
4.26 (108.2) |
5.14 (130.6) |
5.52 (140.2) |
4.76 (120.9) |
3.42 (86.9) |
3.15 (80) |
3.26 (82.8) |
46.53 (1,181.9) |
| Average snowfall inches (cm) | 2.4 (6.1) |
2.0 (5.1) |
0.2 (0.5) |
trace | 0 (0) |
0 (0) |
0 (0) |
0 (0) |
0 (0) |
0 (0) |
trace | 1.2 (3) |
5.8 (14.7) |
| Average precipitation days (≥ 0.01 in) | 10.4 | 9.5 | 10.6 | 10.1 | 10.6 | 9.9 | 11.1 | 10.1 | 8.8 | 7.6 | 8.5 | 9.8 | 117.0 |
| Average snowy days (≥ 0.1 in) | 1.6 | 1.3 | 0.4 | 0.1 | 0 | 0 | 0 | 0 | 0 | 0 | 0 | 0.6 | 4.0 |
| Average relative humidity (%) | 66.3 | 65.6 | 64.6 | 62.8 | 68.8 | 70.6 | 73.3 | 75.2 | 74.4 | 72.1 | 68.5 | 67.0 | 69.1 |
| Mean monthly sunshine hours | 171.5 | 175.2 | 229.3 | 252.8 | 271.7 | 280.1 | 278.3 | 260.4 | 231.4 | 208.3 | 175.7 | 160.4 | 2,695.1 |
| Percent possible sunshine | 56 | 58 | 62 | 64 | 62 | 64 | 62 | 62 | 62 | 60 | 57 | 53 | 61 |
| Source: NOAA (relative humidity and sun 1961–1990)[6][7][8] | |||||||||||||
| Climate data for Richmond International Airport, Virginia (1981–2010 normals,[lower-alpha 4] extremes 1887–present[lower-alpha 5]) | |||||||||||||
|---|---|---|---|---|---|---|---|---|---|---|---|---|---|
| Month | Jan | Feb | Mar | Apr | May | Jun | Jul | Aug | Sep | Oct | Nov | Dec | Year |
| Record high °F (°C) | 81 (27) |
83 (28) |
94 (34) |
96 (36) |
100 (38) |
104 (40) |
105 (41) |
107 (42) |
103 (39) |
99 (37) |
86 (30) |
81 (27) |
107 (42) |
| Mean maximum °F (°C) | 69.6 (20.9) |
72.0 (22.2) |
81.2 (27.3) |
88.1 (31.2) |
91.2 (32.9) |
96.3 (35.7) |
98.3 (36.8) |
96.8 (36) |
93.1 (33.9) |
86.3 (30.2) |
77.6 (25.3) |
70.8 (21.6) |
99.3 (37.4) |
| Average high °F (°C) | 47.4 (8.6) |
51.3 (10.7) |
60.0 (15.6) |
70.3 (21.3) |
77.9 (25.5) |
86.1 (30.1) |
89.7 (32.1) |
87.6 (30.9) |
81.2 (27.3) |
71.0 (21.7) |
61.4 (16.3) |
50.7 (10.4) |
69.6 (20.9) |
| Average low °F (°C) | 28.3 (−2.1) |
30.5 (−0.8) |
37.1 (2.8) |
46.1 (7.8) |
55.0 (12.8) |
64.5 (18.1) |
68.9 (20.5) |
67.4 (19.7) |
60.1 (15.6) |
48.3 (9.1) |
39.4 (4.1) |
31.4 (−0.3) |
48.1 (8.9) |
| Mean minimum °F (°C) | 10.3 (−12.1) |
15.9 (−8.9) |
21.5 (−5.8) |
31.1 (−0.5) |
41.5 (5.3) |
52.5 (11.4) |
59.3 (15.2) |
57.5 (14.2) |
46.3 (7.9) |
33.5 (0.8) |
24.7 (−4.1) |
15.7 (−9.1) |
7.8 (−13.4) |
| Record low °F (°C) | −12 (−24) |
−10 (−23) |
10 (−12) |
19 (−7) |
31 (−1) |
40 (4) |
51 (11) |
46 (8) |
35 (2) |
21 (−6) |
10 (−12) |
−2 (−19) |
−12 (−24) |
| Average precipitation inches (mm) | 3.04 (77.2) |
2.76 (70.1) |
4.04 (102.6) |
3.27 (83.1) |
3.78 (96) |
3.93 (99.8) |
4.51 (114.6) |
4.66 (118.4) |
4.13 (104.9) |
2.98 (75.7) |
3.24 (82.3) |
3.26 (82.8) |
43.6 (1,107.4) |
| Average snowfall inches (cm) | 3.9 (9.9) |
3.4 (8.6) |
0.6 (1.5) |
0.1 (0.3) |
0 (0) |
0 (0) |
0 (0) |
0 (0) |
0 (0) |
0 (0) |
0.2 (0.5) |
2.1 (5.3) |
10.3 (26.2) |
| Average precipitation days (≥ 0.01 in) | 9.7 | 8.9 | 10.3 | 10.0 | 10.8 | 10.0 | 11.4 | 9.1 | 8.4 | 7.4 | 8.3 | 9.7 | 114.0 |
| Average snowy days (≥ 0.1 in) | 1.9 | 1.9 | 0.8 | 0.1 | 0 | 0 | 0 | 0 | 0 | 0 | 0.2 | 1.2 | 6.1 |
| Average relative humidity (%) | 67.9 | 65.6 | 63.0 | 60.8 | 69.5 | 72.2 | 74.8 | 77.2 | 77.0 | 73.8 | 69.1 | 68.9 | 70.0 |
| Mean monthly sunshine hours | 172.5 | 179.7 | 233.3 | 261.6 | 288.0 | 306.4 | 301.4 | 278.9 | 237.9 | 222.8 | 183.5 | 163.0 | 2,829 |
| Percent possible sunshine | 56 | 59 | 63 | 66 | 65 | 69 | 67 | 66 | 64 | 64 | 60 | 55 | 64 |
| Source: NOAA (relative humidity and sunshine hours 1961–1990)[9][10][11] | |||||||||||||
| Climate data for Washington, D.C. (Reagan National Airport), 1981−2010 normals,[lower-alpha 6] extremes 1871−present[lower-alpha 7] | |||||||||||||
|---|---|---|---|---|---|---|---|---|---|---|---|---|---|
| Month | Jan | Feb | Mar | Apr | May | Jun | Jul | Aug | Sep | Oct | Nov | Dec | Year |
| Record high °F (°C) | 79 (26) |
84 (29) |
93 (34) |
95 (35) |
99 (37) |
104 (40) |
106 (41) |
106 (41) |
104 (40) |
96 (36) |
86 (30) |
79 (26) |
106 (41) |
| Mean maximum °F (°C) | 65.5 (18.6) |
67.5 (19.7) |
78.0 (25.6) |
85.8 (29.9) |
90.3 (32.4) |
95.2 (35.1) |
97.5 (36.4) |
96.5 (35.8) |
91.6 (33.1) |
83.7 (28.7) |
74.9 (23.8) |
66.4 (19.1) |
98.8 (37.1) |
| Average high °F (°C) | 43.4 (6.3) |
47.1 (8.4) |
55.9 (13.3) |
66.6 (19.2) |
75.4 (24.1) |
84.2 (29) |
88.4 (31.3) |
86.5 (30.3) |
79.5 (26.4) |
68.4 (20.2) |
57.9 (14.4) |
46.8 (8.2) |
66.8 (19.3) |
| Average low °F (°C) | 28.6 (−1.9) |
30.9 (−0.6) |
37.6 (3.1) |
47.0 (8.3) |
56.5 (13.6) |
66.3 (19.1) |
71.1 (21.7) |
69.7 (20.9) |
62.4 (16.9) |
50.6 (10.3) |
41.2 (5.1) |
32.5 (0.3) |
49.6 (9.8) |
| Mean minimum °F (°C) | 12.9 (−10.6) |
16.6 (−8.6) |
22.9 (−5.1) |
33.9 (1.1) |
44.6 (7) |
54.8 (12.7) |
62.1 (16.7) |
60.1 (15.6) |
49.7 (9.8) |
38.0 (3.3) |
28.7 (−1.8) |
18.2 (−7.7) |
9.9 (−12.3) |
| Record low °F (°C) | −14 (−26) |
−15 (−26) |
4 (−16) |
15 (−9) |
33 (1) |
43 (6) |
52 (11) |
49 (9) |
36 (2) |
26 (−3) |
11 (−12) |
−13 (−25) |
−15 (−26) |
| Average precipitation inches (mm) | 2.81 (71.4) |
2.62 (66.5) |
3.48 (88.4) |
3.06 (77.7) |
3.99 (101.3) |
3.78 (96) |
3.73 (94.7) |
2.93 (74.4) |
3.72 (94.5) |
3.40 (86.4) |
3.17 (80.5) |
3.05 (77.5) |
39.74 (1,009.4) |
| Average snowfall inches (cm) | 5.6 (14.2) |
5.7 (14.5) |
1.3 (3.3) |
trace | 0 (0) |
0 (0) |
0 (0) |
0 (0) |
0 (0) |
0 (0) |
0.5 (1.3) |
2.3 (5.8) |
15.4 (39.1) |
| Average precipitation days (≥ 0.01 in) | 9.6 | 9.0 | 10.5 | 10.4 | 11.1 | 10.7 | 10.3 | 8.2 | 8.3 | 7.7 | 8.6 | 9.7 | 114.1 |
| Average snowy days (≥ 0.1 in) | 3.0 | 2.4 | 0.9 | 0.1 | 0 | 0 | 0 | 0 | 0 | 0 | 0.2 | 1.5 | 8.1 |
| Average relative humidity (%) | 62.1 | 60.5 | 58.6 | 58.0 | 64.5 | 65.8 | 66.9 | 69.3 | 69.7 | 67.4 | 64.7 | 64.1 | 64.3 |
| Mean monthly sunshine hours | 144.6 | 151.8 | 204.0 | 228.2 | 260.5 | 283.2 | 280.5 | 263.1 | 225.0 | 203.6 | 150.2 | 133.0 | 2,527.7 |
| Percent possible sunshine | 48 | 50 | 55 | 57 | 59 | 64 | 62 | 62 | 60 | 59 | 50 | 45 | 57 |
| Source: NOAA (relative humidity and sun 1961−1990)[13][14][15][16] | |||||||||||||
Severe weather

Severe weather is a concern in Virginia. Hurricanes make the coastal area of Virginia vulnerable. It is rare for a major hurricane to threaten the Virginia coast as hurricanes this far north tend to weaken due to cooler coast waters and increasingly westerly winds aloft. Heavy rain from tropical cyclones remains a concern, however. Hurricane Isabel in 2003 brought much destruction from wind and rain, killing 10 directly and doing nearly two billion dollars in damage. Hurricane Gaston in 2004 inundated Richmond after moving ashore South Carolina.[17] Virginia is often struck with the remnants of systems which hit along the Gulf of Mexico coastline, which also bring torrential rain to the state. Hurricane Camille was an extreme example, bringing 27 inches (690 mm) of rainfall to portions of Nelson County in a matter of hours.[18] Thunderstorms are an occasional concern with the state averaging anywhere from 30–50 days of thunderstorm activity annually, with the highest area of occurrence going towards the west.
Rainfall in Virginia is frequent, but does not normally get severe enough for floods. HI-A Virginia averages seven tornadoes annually, though most are F2 and lower on the Fujita scale.[19] However, Virginia had eighty-five in 2004.[20] Eastern Virginia has a lower rate of tornadoes, and the state averages around 2 tornadoes per year.
See also
- Environment of Virginia
- List of wettest known tropical cyclones in Virginia
- United States tropical cyclone rainfall climatology
Notes
- ↑ Official records for Lynchburg were kept at the Weather Bureau Office from January 1893 to July 1944, and at Lynchburg Regional since August 1944. For more information, see ThreadEx
- ↑ Mean monthly maxima and minima (i.e. the expected highest and lowest temperature readings at any point during the year or given month) calculated based on data at said location from 1981 to 2010.
- ↑ Official records for Norfolk kept January 1874 to December 1945 at the Weather Bureau Office in downtown, and at Norfolk Int'l since January 1946. For more information, see Threadex
- ↑ Mean monthly maxima and minima (i.e. the expected highest and lowest temperature readings at any point during the year or given month) calculated based on data at said location from 1981 to 2010.
- ↑ Official records for Richmond kept January 1887 to December 1910 at downtown, Chimborazo Park from January 1911 to December 1929, and at Richmond Int'l since January 1930. For more information, see Threadex
- ↑ Mean monthly maxima and minima (i.e. the expected highest and lowest temperature readings at any point during the year or given month) calculated based on data at said location from 1981 to 2010.
- ↑ Official records for Washington, D.C. were kept at 24th and M Streets NW from January 1871 to June 1945, and at Reagan National since July 1945.[12]
References
- ↑ "World Map of Köppen−Geiger Climate Classification" (PDF). Archived from the original (PDF) on January 14, 2009. Retrieved 2008-12-19.
- ↑ "Climate of Virginia". Charles A. Grymes. Retrieved 2007-07-30.
- ↑ "NowData – NOAA Online Weather Data". National Oceanic and Atmospheric Administration. Retrieved March 29, 2015.
- ↑ "Station Name: VA LYNCHBURG RGNL AP". National Oceanic and Atmospheric Administration. Retrieved 2014-03-13.
- ↑ "WMO Climate Normals for LYNCHBURG WSO AP, VA 1961–1990". National Oceanic and Atmospheric Administration. Retrieved 2014-03-11.
- ↑ "NowData - NOAA Online Weather Data". National Oceanic and Atmospheric Administration. Retrieved 2016-09-07.
- ↑ "Station Name: VA NORFOLK INTL AP". National Oceanic and Atmospheric Administration. Retrieved 2016-09-07.
- ↑ "WMO Climate Normals for NORFOLK/INTL, VA 1961–1990". National Oceanic and Atmospheric Administration. Retrieved 2014-03-10.
- ↑ "NowData - NOAA Online Weather Data". National Oceanic and Atmospheric Administration. Retrieved 2016-09-07.
- ↑ "Station Name: VA RICHMOND INTL AP". National Oceanic and Atmospheric Administration. Retrieved 2016-09-13.
- ↑ "WMO Climate Normals for Richmond/Byrd, VA 1961–1990". National Oceanic and Atmospheric Administration. Retrieved October 31, 2013.
- ↑ "Threaded Station Extremes". threadex.rcc-acis.org.
- ↑ "NowData - NOAA Online Weather Data". National Oceanic and Atmospheric Administration. Retrieved 2016-04-17.
- ↑ "Station Name: VA WASHINGTON REAGAN AP". National Oceanic and Atmospheric Administration. Retrieved 2014-03-13.
- ↑ "WMO Climate Normals for WASHINGTON DC/NATIONAL ARPT VA 1961–1990". National Oceanic and Atmospheric Administration. Retrieved 2016-09-07.
- ↑ Rogers, Matt (1 April 2015). "April outlook: Winter be gone! First half of month looks warmer than average". The Washington Post. Retrieved 4 May 2015.
- ↑ David M. Roth. Hurricane Gaston Rainfall Graphic. Hydrometeorological Prediction Center. Retrieved on 2008-01-13.
- ↑ David M. Roth. Hurricane Camille Rainfall Page. Hydrometeorological Prediction Center. Retrieved on 2008-01-13.
- ↑ Ricketts, Lauryn (February 7, 2008). "Tornadoes DO happen in Virginia!". TV3 Winchester. Archived from the original on 2010-03-14. Retrieved 2009-02-13.
- ↑ "Natural Hazards : Tornadoes". Virginia Business Emergency Survival Toolkit]. 2007. Retrieved 2007-11-29.