Climate of Pennsylvania
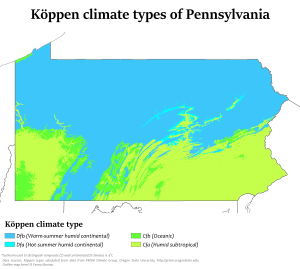
The climate of Pennsylvania is diverse due to the multitude of geographic features found within the state. Straddling two major climate zones, the southeastern corner of Pennsylvania has the warmest climate. Greater Philadelphia lies at the southernmost tip of the Humid continental climate zone, with some characteristics of the Humid subtropical climate that lies in Delaware and Maryland to the south. Moving west toward the mountainous interior of the state, the climate becomes markedly colder, the number of cloudy days increases,[1] and winter snowfall amounts are greater.
Precipitation
Western areas of the state, particularly cities near Lake Erie, can receive over 100 inches (254 cm) of snowfall annually, and the entire state receives an average of 41 inches (1,041 mm) of rainfall every year. Floods are more common in March and April than other months of the year.[2]
Tropical cyclones
Tropical cyclones normally threaten the states during the summer and fall, with their main impact being rainfall.[3] Although Hurricane Agnes was barely a hurricane at landfall in Florida, its major impact was over the Mid-Atlantic region, where Agnes combined with a non-tropical low to produce widespread rains of 6 inches (150 mm) to 12 inches (300 mm) with local amounts up to 19 inches (480 mm) in western Schuylkill County in Pennsylvania.[4] These rains produced widespread severe flooding from Virginia northward to New York, with other flooding occurring over the western portions of the Carolinas.
Philadelphia has received sustained winds approaching hurricane-force from tropical cyclones in the past.[5]
Climate statistics for selected cities
| Climate data for Allentown, Pennsylvania (Lehigh Valley Int'l), 1981–2010 normals,[lower-alpha 1] extremes 1922–present[lower-alpha 2] | |||||||||||||
|---|---|---|---|---|---|---|---|---|---|---|---|---|---|
| Month | Jan | Feb | Mar | Apr | May | Jun | Jul | Aug | Sep | Oct | Nov | Dec | Year |
| Record high °F (°C) | 72 (22) |
76 (24) |
87 (31) |
93 (34) |
97 (36) |
100 (38) |
105 (41) |
100 (38) |
99 (37) |
92 (33) |
81 (27) |
72 (22) |
105 (41) |
| Mean maximum °F (°C) | 57.9 (14.4) |
59.6 (15.3) |
71.6 (22) |
82.5 (28.1) |
88.2 (31.2) |
91.9 (33.3) |
94.2 (34.6) |
92.5 (33.6) |
88.0 (31.1) |
79.0 (26.1) |
70.6 (21.4) |
59.7 (15.4) |
95.4 (35.2) |
| Average high °F (°C) | 36.0 (2.2) |
39.8 (4.3) |
49.4 (9.7) |
61.3 (16.3) |
71.5 (21.9) |
80.1 (26.7) |
84.2 (29) |
82.4 (28) |
74.9 (23.8) |
63.6 (17.6) |
52.5 (11.4) |
40.5 (4.7) |
61.4 (16.3) |
| Average low °F (°C) | 19.5 (−6.9) |
21.7 (−5.7) |
28.8 (−1.8) |
38.5 (3.6) |
48.3 (9.1) |
58.1 (14.5) |
62.7 (17.1) |
60.9 (16.1) |
52.9 (11.6) |
41.3 (5.2) |
32.9 (0.5) |
24.0 (−4.4) |
40.8 (4.9) |
| Mean minimum °F (°C) | 3.0 (−16.1) |
5.7 (−14.6) |
13.1 (−10.5) |
26.0 (−3.3) |
35.5 (1.9) |
46.3 (7.9) |
52.6 (11.4) |
49.8 (9.9) |
39.2 (4) |
28.8 (−1.8) |
19.9 (−6.7) |
9.1 (−12.7) |
0.2 (−17.7) |
| Record low °F (°C) | −15 (−26) |
−12 (−24) |
−5 (−21) |
12 (−11) |
28 (−2) |
39 (4) |
46 (8) |
41 (5) |
30 (−1) |
21 (−6) |
3 (−16) |
−8 (−22) |
−15 (−26) |
| Average precipitation inches (mm) | 3.03 (77) |
2.70 (68.6) |
3.39 (86.1) |
3.56 (90.4) |
4.14 (105.2) |
4.31 (109.5) |
4.95 (125.7) |
3.69 (93.7) |
4.62 (117.3) |
3.88 (98.6) |
3.50 (88.9) |
3.58 (90.9) |
45.35 (1,151.9) |
| Average snowfall inches (cm) | 10.0 (25.4) |
11.1 (28.2) |
4.9 (12.4) |
1.0 (2.5) |
0 (0) |
0 (0) |
0 (0) |
0 (0) |
0 (0) |
0 (0) |
0.7 (1.8) |
5.2 (13.2) |
32.9 (83.6) |
| Average precipitation days (≥ 0.01 in) | 11.1 | 9.8 | 11.0 | 12.1 | 12.1 | 11.4 | 10.9 | 9.5 | 9.1 | 9.1 | 9.8 | 10.9 | 126.8 |
| Average snowy days (≥ 0.1 in) | 5.6 | 4.8 | 2.5 | .4 | 0 | 0 | 0 | 0 | 0 | 0 | .6 | 3.5 | 17.4 |
| Average relative humidity (%) | 69.1 | 66.7 | 62.6 | 60.9 | 65.6 | 67.9 | 68.8 | 71.9 | 74.0 | 71.8 | 70.5 | 71.4 | 68.4 |
| Source: NOAA (relative humidity 1961–1990)[6][7] | |||||||||||||
| Climate data for Harrisburg, Pennsylvania (Harrisburg Int'l), 1981–2010 normals, extremes 1888–present[lower-alpha 3] | |||||||||||||
|---|---|---|---|---|---|---|---|---|---|---|---|---|---|
| Month | Jan | Feb | Mar | Apr | May | Jun | Jul | Aug | Sep | Oct | Nov | Dec | Year |
| Record high °F (°C) | 73 (23) |
78 (26) |
87 (31) |
93 (34) |
97 (36) |
100 (38) |
107 (42) |
104 (40) |
102 (39) |
97 (36) |
84 (29) |
75 (24) |
107 (42) |
| Average high °F (°C) | 37.0 (2.8) |
40.7 (4.8) |
50.4 (10.2) |
62.4 (16.9) |
72.1 (22.3) |
81.0 (27.2) |
85.5 (29.7) |
83.4 (28.6) |
75.6 (24.2) |
64.1 (17.8) |
53.1 (11.7) |
41.3 (5.2) |
62.2 (16.8) |
| Average low °F (°C) | 22.8 (−5.1) |
25.1 (−3.8) |
33.0 (0.6) |
41.9 (5.5) |
52.1 (11.2) |
62.0 (16.7) |
66.3 (19.1) |
64.5 (18.1) |
56.2 (13.4) |
44.6 (7) |
35.1 (1.7) |
26.6 (−3) |
44.2 (6.8) |
| Record low °F (°C) | −22 (−30) |
−13 (−25) |
−1 (−18) |
11 (−12) |
31 (−1) |
40 (4) |
49 (9) |
45 (7) |
30 (−1) |
23 (−5) |
10 (−12) |
−8 (−22) |
−22 (−30) |
| Average precipitation inches (mm) | 2.88 (73.2) |
2.39 (60.7) |
3.37 (85.6) |
3.10 (78.7) |
3.79 (96.3) |
3.60 (91.4) |
4.61 (117.1) |
3.20 (81.3) |
4.07 (103.4) |
3.27 (83.1) |
3.23 (82) |
3.23 (82) |
40.74 (1,034.8) |
| Average snowfall inches (cm) | 8.8 (22.4) |
10.5 (26.7) |
5.2 (13.2) |
0.4 (1) |
0 (0) |
0 (0) |
0 (0) |
0 (0) |
0 (0) |
0 (0) |
0.6 (1.5) |
5.1 (13) |
30.6 (77.7) |
| Average precipitation days (≥ 0.01 in) | 10.6 | 9.9 | 10.9 | 10.8 | 12.2 | 11.1 | 10.7 | 9.1 | 9.2 | 8.8 | 9.0 | 9.7 | 122.0 |
| Average snowy days (≥ 0.1 in) | 5.2 | 5.0 | 2.6 | 0.3 | 0 | 0 | 0 | 0 | 0 | 0 | 0.9 | 2.8 | 16.8 |
| Average relative humidity (%) | 64.4 | 63.2 | 60.7 | 59.2 | 65.2 | 67.7 | 68.6 | 72.2 | 73.8 | 70.5 | 68.2 | 66.4 | 66.7 |
| Mean monthly sunshine hours | 154.9 | 167.2 | 213.8 | 235.7 | 266.7 | 288.5 | 310.1 | 285.4 | 226.7 | 199.2 | 139.6 | 126.0 | 2,613.8 |
| Percent possible sunshine | 52 | 56 | 58 | 59 | 60 | 64 | 68 | 67 | 61 | 58 | 47 | 43 | 59 |
| Source: NOAA (relative humidity and sun 1961–1990 at Capital City Airport)[6][9][10] | |||||||||||||
| Climate data for Philadelphia (Philadelphia Airport), 1981–2010 normals,[lower-alpha 4] extremes 1872–present[lower-alpha 5] | |||||||||||||
|---|---|---|---|---|---|---|---|---|---|---|---|---|---|
| Month | Jan | Feb | Mar | Apr | May | Jun | Jul | Aug | Sep | Oct | Nov | Dec | Year |
| Record high °F (°C) | 74 (23) |
79 (26) |
87 (31) |
95 (35) |
97 (36) |
102 (39) |
104 (40) |
106 (41) |
102 (39) |
96 (36) |
84 (29) |
73 (23) |
106 (41) |
| Mean maximum °F (°C) | 62.0 (16.7) |
62.7 (17.1) |
73.6 (23.1) |
83.2 (28.4) |
89.1 (31.7) |
94.2 (34.6) |
96.4 (35.8) |
94.7 (34.8) |
89.8 (32.1) |
81.7 (27.6) |
72.3 (22.4) |
63.5 (17.5) |
97.5 (36.4) |
| Average high °F (°C) | 40.3 (4.6) |
43.8 (6.6) |
52.7 (11.5) |
63.9 (17.7) |
73.8 (23.2) |
82.7 (28.2) |
87.1 (30.6) |
85.3 (29.6) |
78.0 (25.6) |
66.6 (19.2) |
56.0 (13.3) |
44.8 (7.1) |
64.6 (18.1) |
| Average low °F (°C) | 25.6 (−3.6) |
27.7 (−2.4) |
34.4 (1.3) |
44.1 (6.7) |
54.0 (12.2) |
63.8 (17.7) |
69.2 (20.7) |
67.9 (19.9) |
60.3 (15.7) |
48.4 (9.1) |
39.2 (4) |
30.1 (−1.1) |
47.1 (8.4) |
| Mean minimum °F (°C) | 8.7 (−12.9) |
12.7 (−10.7) |
19.4 (−7) |
31.6 (−0.2) |
42.0 (5.6) |
52.2 (11.2) |
59.8 (15.4) |
57.8 (14.3) |
47.2 (8.4) |
35.8 (2.1) |
26.0 (−3.3) |
15.8 (−9) |
6.4 (−14.2) |
| Record low °F (°C) | −7 (−22) |
−11 (−24) |
5 (−15) |
14 (−10) |
28 (−2) |
44 (7) |
51 (11) |
44 (7) |
35 (2) |
25 (−4) |
8 (−13) |
−5 (−21) |
−11 (−24) |
| Average precipitation inches (mm) | 3.03 (77) |
2.65 (67.3) |
3.79 (96.3) |
3.56 (90.4) |
3.71 (94.2) |
3.43 (87.1) |
4.35 (110.5) |
3.50 (88.9) |
3.78 (96) |
3.18 (80.8) |
2.99 (75.9) |
3.56 (90.4) |
41.53 (1,054.9) |
| Average snowfall inches (cm) | 6.5 (16.5) |
8.8 (22.4) |
2.9 (7.4) |
0.5 (1.3) |
0 (0) |
0 (0) |
0 (0) |
0 (0) |
0 (0) |
0 (0) |
0.3 (0.8) |
3.4 (8.6) |
22.4 (56.9) |
| Average precipitation days (≥ 0.01 in) | 10.6 | 9.4 | 10.5 | 11.3 | 11.1 | 9.8 | 9.9 | 8.4 | 8.7 | 8.6 | 9.3 | 10.6 | 118.2 |
| Average snowy days (≥ 0.1 in) | 4.4 | 3.6 | 1.8 | 0.4 | 0 | 0 | 0 | 0 | 0 | 0 | 0.2 | 1.8 | 12.2 |
| Average relative humidity (%) | 66.2 | 63.6 | 61.7 | 60.4 | 65.4 | 67.8 | 69.6 | 70.4 | 71.6 | 70.8 | 68.4 | 67.7 | 67.0 |
| Mean monthly sunshine hours | 155.7 | 154.7 | 202.8 | 217.0 | 245.1 | 271.2 | 275.6 | 260.1 | 219.3 | 204.5 | 154.7 | 137.7 | 2,498.4 |
| Percent possible sunshine | 52 | 52 | 55 | 55 | 55 | 61 | 61 | 61 | 59 | 59 | 52 | 47 | 56 |
| Source: NOAA (relative humidity and sun 1961–1990) [6][13][14] | |||||||||||||
| Climate data for Pittsburgh (Pittsburgh International Airport), 1981–2010 normals,[lower-alpha 6] extremes 1871–present[lower-alpha 7] | |||||||||||||
|---|---|---|---|---|---|---|---|---|---|---|---|---|---|
| Month | Jan | Feb | Mar | Apr | May | Jun | Jul | Aug | Sep | Oct | Nov | Dec | Year |
| Record high °F (°C) | 75 (24) |
77 (25) |
84 (29) |
90 (32) |
95 (35) |
98 (37) |
103 (39) |
103 (39) |
102 (39) |
91 (33) |
82 (28) |
74 (23) |
103 (39) |
| Mean maximum °F (°C) | 59.7 (15.4) |
61.9 (16.6) |
74.9 (23.8) |
81.5 (27.5) |
85.7 (29.8) |
90.0 (32.2) |
91.3 (32.9) |
90.5 (32.5) |
87.2 (30.7) |
79.0 (26.1) |
71.5 (21.9) |
61.3 (16.3) |
92.7 (33.7) |
| Average high °F (°C) | 35.7 (2.1) |
39.3 (4.1) |
49.2 (9.6) |
61.7 (16.5) |
70.8 (21.6) |
79.1 (26.2) |
82.5 (28.1) |
81.4 (27.4) |
74.3 (23.5) |
62.6 (17) |
51.2 (10.7) |
39.4 (4.1) |
60.6 (15.9) |
| Average low °F (°C) | 21.1 (−6.1) |
23.0 (−5) |
30.0 (−1.1) |
40.2 (4.6) |
49.3 (9.6) |
58.4 (14.7) |
62.8 (17.1) |
61.5 (16.4) |
54.0 (12.2) |
42.9 (6.1) |
34.7 (1.5) |
25.3 (−3.7) |
41.9 (5.5) |
| Mean minimum °F (°C) | −0.1 (−17.8) |
3.6 (−15.8) |
10.9 (−11.7) |
24.6 (−4.1) |
34.8 (1.6) |
44.1 (6.7) |
50.7 (10.4) |
49.6 (9.8) |
39.3 (4.1) |
29.0 (−1.7) |
18.9 (−7.3) |
6.7 (−14.1) |
−3.9 (−19.9) |
| Record low °F (°C) | −22 (−30) |
−20 (−29) |
−5 (−21) |
11 (−12) |
26 (−3) |
34 (1) |
42 (6) |
39 (4) |
31 (−1) |
16 (−9) |
−1 (−18) |
−12 (−24) |
−22 (−30) |
| Average precipitation inches (mm) | 2.70 (68.6) |
2.39 (60.7) |
2.95 (74.9) |
3.11 (79) |
3.95 (100.3) |
4.30 (109.2) |
3.83 (97.3) |
3.48 (88.4) |
3.11 (79) |
2.29 (58.2) |
3.23 (82) |
2.85 (72.4) |
38.19 (970) |
| Average snowfall inches (cm) | 11.5 (29.2) |
10.2 (25.9) |
7.4 (18.8) |
1.5 (3.8) |
0 (0) |
0 (0) |
0 (0) |
0 (0) |
0 (0) |
0.4 (1) |
2.1 (5.3) |
8.3 (21.1) |
41.4 (105.2) |
| Average precipitation days (≥ 0.01 in) | 16.2 | 13.6 | 14.0 | 13.8 | 13.3 | 12.1 | 10.2 | 9.8 | 9.8 | 10.5 | 12.8 | 15.1 | 151.2 |
| Average snowy days (≥ 0.1 in) | 11.4 | 8.3 | 5.9 | 2.0 | 0 | 0 | 0 | 0 | 0 | 0.3 | 3.0 | 8.5 | 39.4 |
| Average relative humidity (%) | 69.9 | 67.3 | 64.1 | 59.8 | 63.4 | 66.2 | 68.8 | 71.2 | 72.0 | 68.3 | 70.2 | 71.9 | 67.8 |
| Mean monthly sunshine hours | 93.9 | 108.5 | 155.4 | 182.8 | 217.4 | 242.2 | 254.9 | 228.4 | 196.7 | 167.3 | 99.4 | 74.4 | 2,021.3 |
| Percent possible sunshine | 31 | 36 | 42 | 46 | 49 | 54 | 56 | 54 | 53 | 48 | 33 | 26 | 45 |
| Source: NOAA (relative humidity and sun 1961–1990)[6][15][10] | |||||||||||||
| Climate data for Wilkes-Barre/Scranton Int'l Airport, Pennsylvania (1981–2010 normals,[lower-alpha 8] extremes 1901–present[lower-alpha 9]) | |||||||||||||
|---|---|---|---|---|---|---|---|---|---|---|---|---|---|
| Month | Jan | Feb | Mar | Apr | May | Jun | Jul | Aug | Sep | Oct | Nov | Dec | Year |
| Record high °F (°C) | 69 (21) |
74 (23) |
85 (29) |
93 (34) |
93 (34) |
99 (37) |
103 (39) |
102 (39) |
100 (38) |
91 (33) |
81 (27) |
71 (22) |
103 (39) |
| Mean maximum °F (°C) | 55.4 (13) |
56.4 (13.6) |
69.6 (20.9) |
81.3 (27.4) |
86.6 (30.3) |
89.8 (32.1) |
91.8 (33.2) |
90.0 (32.2) |
85.7 (29.8) |
77.3 (25.2) |
68.7 (20.4) |
57.5 (14.2) |
93.4 (34.1) |
| Average high °F (°C) | 33.2 (0.7) |
36.8 (2.7) |
46.2 (7.9) |
59.1 (15.1) |
69.7 (20.9) |
77.7 (25.4) |
81.9 (27.7) |
79.9 (26.6) |
72.3 (22.4) |
60.7 (15.9) |
49.4 (9.7) |
37.5 (3.1) |
58.8 (14.9) |
| Average low °F (°C) | 18.5 (−7.5) |
20.7 (−6.3) |
27.6 (−2.4) |
38.2 (3.4) |
47.6 (8.7) |
56.5 (13.6) |
60.9 (16.1) |
59.5 (15.3) |
52.1 (11.2) |
41.1 (5.1) |
33.3 (0.7) |
23.8 (−4.6) |
40.1 (4.5) |
| Mean minimum °F (°C) | −0.8 (−18.2) |
3.2 (−16) |
9.1 (−12.7) |
24.0 (−4.4) |
34.4 (1.3) |
43.1 (6.2) |
49.4 (9.7) |
47.1 (8.4) |
37.5 (3.1) |
28.3 (−2.1) |
18.9 (−7.3) |
5.9 (−14.5) |
−3.1 (−19.5) |
| Record low °F (°C) | −21 (−29) |
−19 (−28) |
−4 (−20) |
8 (−13) |
27 (−3) |
34 (1) |
43 (6) |
38 (3) |
29 (−2) |
19 (−7) |
6 (−14) |
−13 (−25) |
−21 (−29) |
| Average precipitation inches (mm) | 2.37 (60.2) |
2.03 (51.6) |
2.55 (64.8) |
3.33 (84.6) |
3.52 (89.4) |
4.03 (102.4) |
3.79 (96.3) |
3.41 (86.6) |
4.07 (103.4) |
3.34 (84.8) |
3.14 (79.8) |
2.68 (68.1) |
38.26 (971.8) |
| Average snowfall inches (cm) | 14.2 (36.1) |
9.3 (23.6) |
9.0 (22.9) |
3.3 (8.4) |
0 (0) |
0 (0) |
0 (0) |
0 (0) |
0 (0) |
0.1 (0.3) |
2.9 (7.4) |
7.4 (18.8) |
46.2 (117.3) |
| Average precipitation days (≥ 0.01 in) | 12.0 | 11.0 | 11.8 | 12.3 | 13.2 | 12.8 | 11.2 | 11.3 | 10.2 | 10.7 | 11.2 | 11.5 | 139.2 |
| Average snowy days (≥ 0.1 in) | 9.3 | 7.7 | 5.0 | 1.7 | 0 | 0 | 0 | 0 | 0 | 0.1 | 2.1 | 7.1 | 33.0 |
| Average relative humidity (%) | 70.1 | 67.5 | 63.3 | 60.4 | 64.6 | 70.5 | 71.1 | 73.8 | 75.2 | 71.6 | 71.8 | 72.5 | 69.4 |
| Mean monthly sunshine hours | 130.3 | 143.7 | 185.7 | 210.5 | 246.9 | 269.7 | 285.7 | 257.2 | 200.2 | 173.3 | 104.3 | 95.9 | 2,303.4 |
| Percent possible sunshine | 44 | 48 | 50 | 53 | 55 | 60 | 62 | 60 | 54 | 50 | 35 | 33 | 52 |
| Source: NOAA (relative humidity 1964–1990, sun 1961–1990)[17][18][19] | |||||||||||||
Government spending related to climate change in Pennsylvania
Former Pennsylvania Governor Edward Rendell approved a bill that established a $500 million fund to support renewable energy projects. Special Session House Bill 1 authorizes the Commonwealth Financing Authority to borrow $500 million, most of which will be split into six funding sources relating to energy efficiency and renewable energy: $80 million in grants and loans for solar energy projects; $100 million in grants, loans, and rebates for up to 35% and small businesses; $165 million in grants and loans for alternative energy projects, excluding solar energy, at businesses and local government facilities; $25 million for wind energy and geothermal energy projects; $40 million to help start-up businesses involved in energy efficiency technologies; and $25 million in grants and loans to improve the energy efficiency of new and existing homes and small business buildings. An additional $65 million will go toward pollution control technologies and to help low-income families pay their energy bills.
In addition to the $500 million fund, the bill creates a Consumer Energy Program that is funded at $15 million for the next 3 fiscal years, then gradually decreases to $8 million by the 2015-2016 fiscal year, for a total of $100 million. Of that, $92.5 million will support loans, grants, and rebates for up to 25% of the cost of energy efficiency improvements to homes and small businesses, while $5 million will support low-interest loans for energy efficiency improvements to homes. An additional $50 million will be available over the next 8 years to support tax credits for 15% of the cost of alternative energy projects, capped at $1 million per year for each project.
Governor Rendell also approved two bills on July 10 that relate to biofuels. House Bill 1202 could add as much as 1 billion US gallons (3,800,000 m3) of advanced biofuels to the state's fuel supply. It requires all retail diesel fuel sold in the state to contain 2% biodiesel, once the in-state production of biodiesel reaches 40 million US gallons (150,000 m3) per year, increasing incrementally to a 20% biodiesel requirement, once the in-state production of biodiesel reaches 400 million US gallons (1,500,000 m3) per year (but only if vehicle manufacturers approve the use of 20% biodiesel). Likewise, all retail gasoline sold in the state must contain 10% ethanol, once the in-state production of cellulosic ethanol reaches 350 million US gallons (1,300,000 m3) per year. The state already has a biodiesel production capacity of 60 million US gallons (230,000 m3) per year, so the 2% biodiesel requirement could go into effect soon, if production is high enough. To encourage biodiesel production, Special Session Senate Bill 22 will offer a subsidy of 75 cents per 1-US-gallon (3.8 L) of biodiesel produced, capped at $1.9 million per year for each producer. The bill also expands a hybrid vehicle rebate program to include plug-in hybrids and other alternative fuel vehicles.§.
See also
- Johnstown Flood
- List of Pennsylvania weather records
- List of wettest known tropical cyclones in Pennsylvania
- Wind power in Pennsylvania
Notes
- ↑ Mean monthly maxima and minima (i.e. the highest and lowest temperature readings during an entire month or year) calculated based on data at said location from 1981 to 2010.
- ↑ Official records for Allentown were kept at Allentown Gas Company from March 1922 to December 1943, and at Lehigh Valley Int'l since January 1944. For more information, see ThreadEx.
- ↑ Official records for Harrisburg kept at downtown from July 1888 to December 1938, Capital City Airport from January 1939 to September 1991, and at Harrisburg Int'l in Middletown since October 1991.[8]
- ↑ Mean monthly maxima and minima (i.e. the highest and lowest temperature readings during an entire month or year) calculated based on data at said location from 1981 to 2010.
- ↑ Official temperature and precipitation measurements for Philadelphia were taken at the Weather Bureau Office in downtown from January 1872 to 19 June 1940, and at Philadelphia Int'l from 20 June 1940 to the present.[11] Snowfall and snow depth records date to 1 January 1884 and 1 October 1948, respectively.[6] In 2006, snowfall measurements were moved to National Park, New Jersey directly across the Delaware River from the airport.[12]
- ↑ Mean monthly maxima and minima (i.e. the highest and lowest temperature readings during an entire month or year) calculated based on data at said location from 1981 to 2010.
- ↑ Records kept January 1871 to June 1935 at the Weather Bureau Office across the Allegheny River from downtown, at Allegheny County Airport from July 1935 to 14 September 1952, and at Pittsburgh Int'l (KPIT) since 15 September 1952. Due to its river valley and urban location as well as elevation, many of the summertime warm minima temperature records set at the WBO have not even come close to being matched at KPIT, which is at-elevation and located in the western suburbs. For more information, see Threadex
- ↑ Mean monthly maxima and minima (i.e. the expected highest and lowest temperature readings at any point during the year or given month) calculated based on data at said location from 1981 to 2010.
- ↑ Official records for Avoca/Wilkes-Barre–Scranton kept at downtown Scranton from January 1901 to 17 April 1955 and at Wilkes-Barre/Scranton International Airport since 18 April 1955.[16]
References
- ↑ The Pennsylvania State Climatologist. Annual Average Number of Cloudy Days In Pennsylvania. Retrieved on 2008-01-28.
- ↑ The Pennsylvania State Climatologist. Climate of Pennsylvania. Archived February 25, 2009, at the Wayback Machine. Retrieved on 2008-01-28.
- ↑ Roth, David M; Weather Prediction Center (2012). "Tropical Cyclone Rainfall in the Mid-Atlantic United States". Tropical Cyclone Rainfall Point Maxima. United States National Oceanic and Atmospheric Administration's National Weather Service. Retrieved June 23, 2012.
- ↑ Roth, David M. (April 29, 2015). "Tropical Cyclone Point Maxima". Tropical Cyclone Rainfall Data. United States Weather Prediction Center. Retrieved May 8, 2016.
- ↑ David M. Roth and Hugh D. Cobb III. RE-ANALYSIS OF THE GALE OF '78 - STORM 9 OF THE 1878 HURRICANE SEASON. Retrieved on 2008-03-05.
- 1 2 3 4 5 "NowData - NOAA Online Weather Data". National Oceanic and Atmospheric Administration. Retrieved 2016-04-13.
- ↑ "WMO Climate Normals for ALLENTOWN/A.-BETHLEHEM, PA 1961–1990". National Oceanic and Atmospheric Administration. Retrieved 2014-05-28.
- ↑ ThreadEx
- ↑ "Station Name: PA MIDDLETOWN HARRISBURG INTL AP". National Oceanic and Atmospheric Administration. Retrieved 2014-03-13.
- 1 2 "WMO Climate Normals for HARRISBURG/CAPITAL CI AP PA 1961–1990". National Oceanic and Atmospheric Administration. Retrieved 2014-03-10.
- ↑ ThreadEx; search for location= "PA - Philadelphia", variable= "Station thread"
- ↑ Wood, Anthony R. "Snow total at airport gets a boost A new measuring station and technique likely contributed to two 8-inch-plus readings". Philly.com. The Inquirer. Retrieved 2014-06-10.
- ↑ "Station Name: PA PHILADELPHIA INTL AP". National Oceanic and Atmospheric Administration. Retrieved 2014-03-13.
- ↑ "WMO Climate Normals for PHILADELPHIA/INT'L ARPT PA 1961–1990". National Oceanic and Atmospheric Administration. Retrieved 2014-03-11.
- ↑ "Station Name: PA PITTSBURGH INTL AP". National Oceanic and Atmospheric Administration. Retrieved 2013-03-11.
- ↑ ThreadEx
- ↑ "NowData - NOAA Online Weather Data". National Oceanic and Atmospheric Administration. Retrieved 2012-01-27.
- ↑ "Station Name: PA WILKES-BARRE INTL AP". National Oceanic and Atmospheric Administration. Retrieved 2016-09-11.
- ↑ "NOAA". NOAA.