Climate of the United States
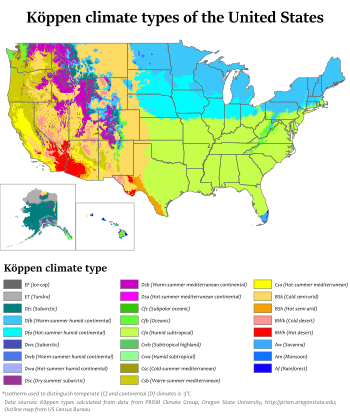
The climate of the United States varies due to differences in latitude, and a range of geographic features, including mountains and deserts. West of the 100th meridian, much of the US is semi-arid to arid, even desert in the far southwestern US. East of the 100th meridian, the climate is humid continental in the northern areas (locations above 40 north latitude), to humid temperate in the central and middle Atlantic coast regions, to humid subtropical climate in the Gulf and south Atlantic regions. The southern tip of Florida is tropical. Higher-elevation areas of the Rocky Mountains, the Wasatch and Bighorn mountain ranges, the Sierra Nevada, and the Cascade Range are alpine.
The climate along the coast of California is Mediterranean, while upper West Coast areas in coastal Oregon and Washington are cool temperate oceanic. The state of Alaska, on the northwestern corner of the North American continent, is largely subarctic, but with a cool oceanic climate in the southeast (Alaska Panhandle), southwestern peninsula and Aleutian Islands, and a polar climate in the north. The archipelago state of Hawaii, in the middle of the Pacific Ocean, is tropical, with rainfall concentrated in the cooler season (November to March).
As in most land masses located in the middle and lower-middle latitudes, the primary drivers of weather in the contiguous United States are the seasonal change in the solar angle, the migration north/south of the subtropical highs, and the seasonal change in the position of the polar jet stream.
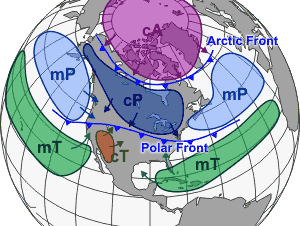
In the Northern Hemisphere summer, the "Bermuda High" over the subtropical Atlantic Ocean typically sends warm, humid air over the eastern, southern and central United States - resulting in southerly airflow, warm to hot temperatures, high humidity and occasional thunderstorm activity. In summer, high pressure over the north-central Pacific typically results in northwesterly airflow, stable conditions and cool to mild conditions along most of the immediate Pacific coast, from Washington state to San Diego, CA. In the Northern Hemisphere winter, the subtropical highs retreat southward. The polar jet stream (and associated conflict zone between cold, dry air masses from Canada and warm, moist air masses from the Gulf of Mexico) drops further southward into the United States - bringing major rain, ice and snow events, and much more variable, and sometimes dramatically colder, temperatures. Areas in the extreme southern US (Florida, the Gulf Coast, the Desert Southwest, and southern California) however, often have more stable weather, as the polar jet stream’s impact does not usually reach that far south.
Weather systems, be they high-pressure systems (anticyclones), low-pressure systems (cyclones) or fronts (boundaries between air masses of differing temperature, humidity and most commonly, both) are faster-moving and more intense in the winter/colder months than in the summer/warmer months. The Gulf of Alaska is the origination area of many storms that enter the United States. Such "North Pacific lows" enter the US through the Pacific Northwest, then move eastward across the northern Rocky Mountains, northern Great Plains, upper Midwest, Great Lakes and New England states. Across the central states from late fall to spring, "Panhandle hook" storms move from the central Rockies into the Oklahoma/Texas panhandle areas, then northeast toward the Great Lakes. They generate unusually large temperature contrasts, and often bring copious Gulf moisture northward, resulting sometimes in cold conditions and possibly-heavy snow or ice north and west of the storm track, and warm conditions, heavy rains and potentially-severe thunderstorms south and east of the storm track - often simultaneously. Across the northern states in winter (usually Montana/Dakotas eastward), "Alberta clipper" storms can be frequent, usually bringing light to moderate snowfalls, but often, windy and severe Arctic outbreaks behind them. When winter-season Canadian cold air masses drop unusually far southward, "Gulf lows" can develop in or near the Gulf of Mexico, then track eastward or northeastward across the Southern states, or nearby Gulf or South Atlantic waters. They often bring on the South's rare ice and/or snow events.
In the cold season (generally November to March), most precipitation occurs in conjunction with organized low-pressure systems and associated fronts, especially in the east-central, eastern and southeastern states. Average winter-season precipitation is especially heavy in Tennessee, Kentucky and the northern Gulf Coast states, and coastal North Atlantic districts. In the summer, storms are much more localized, with short-duration thunderstorms common in many areas east of the 100th meridian. In the warm season, storm systems affecting a large area are less frequent, and weather conditions are more solar {sun} controlled, with the greatest chance for thunderstorm and severe weather activity during peak heating hours, mostly between 3 PM and 9 PM local time. From May to August especially, often-overnight mesoscale-convective-system (MCS) thunderstorm complexes, usually associated with frontal activity, can deliver significant to flooding rainfall amounts from the Dakotas/Nebraska eastward across Iowa/Minnesota to the Great Lakes states. From late summer into fall (mostly August to October), tropical cyclones sometimes approach or cross the Gulf and south Atlantic states, bringing high winds, heavy rainfall, and storm surges (often topped with battering waves) to coastal areas. More rarely, tropical cyclones can affect the mid-Atlantic and Northeastern states, such as with the "Long Island Express" hurricane in September 1938, and Superstorm Sandy in October 2012.
Precipitation
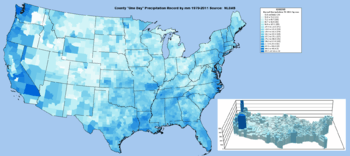
The characteristics of precipitation across the United States differ significantly across the United States and its possessions. Late summer and fall extratropical cyclones bring a majority of the precipitation which falls across western, southern, and southeast Alaska annually. During the fall, winter, and spring, Pacific storm systems bring most of Hawaii and the western United States much of their precipitation.[1]
In the central and eastern United States, precipitation is evenly distributed throughout the year, although summer rainfall increases as one moves southeastward, until a sharp wet summer and dry winter prevail in Florida. Lake-effect snows add to precipitation potential downwind of the Great Lakes,[2] as well as Great Salt Lake and the Finger Lakes during the cold season. The average snow to liquid ratio across the contiguous United States is 13:1, meaning 13 inches (330 mm) of snow melts down to 1 inch (25 mm) of water.[3] The El Niño-Southern Oscillation affects the precipitation distribution, by altering rainfall patterns across the West, Midwest, the Southeast, and throughout the tropics.[4][5][6][7]
During the summer, the Southwest monsoon combined with Gulf of California and Gulf of Mexico moisture moving around the subtropical ridge in the Atlantic ocean bring the promise of afternoon and evening thunderstorms to the southern tier of the country as well as the Great Plains.[8] Equatorward of the subtropical ridge, tropical cyclones enhance precipitation (mostly from August to October) across southern and eastern sections of the country, as well as Puerto Rico, the United States Virgin Islands, the Northern Mariana Islands, Guam, and American Samoa.[9] Over the top of the ridge, the jet stream brings a summer precipitation maximum to the Great Lakes. Large thunderstorm areas known as mesoscale convective complexes move through the Plains, Midwest, and Great Lakes during the warm season, contributing up to 10% of the annual precipitation to the region.[10]
Extremes
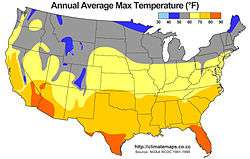
In northern Alaska, tundra and arctic conditions predominate, and the temperature has fallen as low as −80 °F (−62 °C).[11] On the other end of the spectrum, Death Valley, California once reached 134 °F (56.7 °C), officially the highest temperature ever recorded on Earth.[12]
On average, the mountains of the western states receive the highest levels of snowfall on Earth. The greatest annual snowfall level is at Mount Rainier in Washington, at 692 inches (1,758 cm); the record there was 1,122 inches (2,850 cm) in the winter of 1971–72. This record was broken by the Mt. Baker Ski Area in northwestern Washington which reported 1,140 inches (2,896 cm) of snowfall for the 1998-99 snowfall season. Other places with significant snowfall outside the Cascade Range are the Wasatch Mountains, near the Great Salt Lake and the Sierra Nevada, near Lake Tahoe.
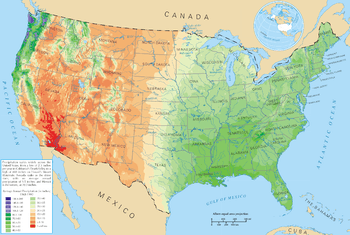
Along the coastal mountain ranges in the Pacific Northwest, rainfall is greater than anywhere else in the continental US, with Quinault Ranger Station in Washington having an average of 137 inches (3,480 mm).[13] Hawaii receives even more, with 460 inches (11,684 mm) measured annually, on average, on Mount Waialeale, in Kauai.[14] The Sonoran Desert in the southwest is home to the driest locale in the US. Yuma, Arizona, has an average of 2.63 inches (67 mm) of precipitation each year.[15]
| Climate data for United States | |||||||||||||
|---|---|---|---|---|---|---|---|---|---|---|---|---|---|
| Month | Jan | Feb | Mar | Apr | May | Jun | Jul | Aug | Sep | Oct | Nov | Dec | Year |
| Record high °F (°C) | 98 (37) |
105 (41) |
108 (42) |
118 (48) |
124 (51) |
129 (54) |
134 (57) |
127 (53) |
126 (52) |
117 (47) |
105 (41) |
100 (38) |
134 (57) |
| Record low °F (°C) | −80 (−62) |
−75 (−59) |
−68 (−56) |
−50 (−46) |
−25 (−32) |
−1 (−18) |
10 (−12) |
5 (−15) |
−13 (−25) |
−48 (−44) |
−61 (−52) |
−72 (−58) |
−80 (−62) |
| Source: http://www.infoplease.com/ipa/A0762182.html | |||||||||||||
Overall average(s)
| Climate data for Contiguous US average[16] | |||||||||||||
|---|---|---|---|---|---|---|---|---|---|---|---|---|---|
| Month | Jan | Feb | Mar | Apr | May | Jun | Jul | Aug | Sep | Oct | Nov | Dec | Year |
| Daily mean °F (°C) | 30.81 (−0.66) |
34.65 (1.47) |
42.56 (5.87) |
52.02 (11.12) |
61.04 (16.13) |
69.25 (20.69) |
74.29 (23.49) |
72.77 (22.65) |
65.42 (18.57) |
54.77 (12.65) |
42.51 (5.84) |
33.38 (0.77) |
52.79 (11.55) |
| Average precipitation inches (mm) | 2.2 (55.88) |
2.0102 (51.06) |
2.4 (60.96) |
2.4402 (61.98) |
2.8799 (73.15) |
2.9098 (73.91) |
2.7701 (70.36) |
2.6098 (66.29) |
2.4902 (63.25) |
2.1598 (54.86) |
2.1201 (53.85) |
2.2598 (57.40) |
29.2299 (742.44) |
| Source: NOAA (US)[17] | |||||||||||||
Natural disasters and effects
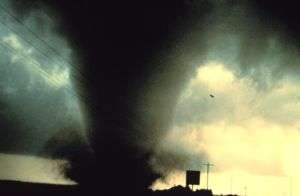
The Great Plains, the Midwest and the southern United States - because of contrasting air masses - have frequent severe thunderstorms and tornado outbreaks during spring and summer. In central portions of the US, tornadoes are more common than anywhere else on Earth[18] and touch down most commonly in the spring and summer. The strip of land from north Texas north to Nebraska and east into Southern Michigan is known as Tornado Alley, where many houses have tornado shelters and many towns have tornado sirens. Stretching across Mississippi and Alabama, Dixie Alley has experienced tornadoes and violent thunderstorms, with peak tornado season coming on as early as February and waning by May. Florida also reports many tornadoes but these are rarely very strong. The southern US has a second tornado season during the Fall. In general, the area at greatest risk for tornadoes migrates northward from February to June, peaking in the Gulf States in February and March, the Ohio Valley and lower Midwest in April, southern and central Plains and central Midwest in May, and Northern Plains and upper Midwest (Dakotas, Minnesota and Wisconsin) in June.
The Appalachian region and the Midwest experience the worst floods. Widespread severe flooding is rare. Some exceptions include the Great Mississippi Flood of 1927, the Great Flood of 1993, and widespread flooding and mudslides caused by the 1982-1983 El Niño event in the western United States. Localized flooding can, however, occur anywhere, and mudslides from heavy rain can cause problems in any mountainous area, particularly the Southwest. The narrow canyons of many mountain areas in the west and severe thunderstorm activity during the monsoon season in summer leads to sometimes devastating flash floods as well, while Nor'easter snowstorms can bring activity to a halt in the New England and Great Lakes regions.
In 2013, the US sustains $10 billion annually in damage from floods.[19]
The Southwest has the worst droughts; one is thought to have lasted over 500 years and to have decimated the Anasazi people.[20] Large stretches of desert shrub in the west can fuel the spread of wildfires. Although severe drought is rare, it has occasionally caused major problems, such as during the Dust Bowl (1931–1942), which coincided with the Great Depression. Farmland failed throughout the Plains, entire regions were virtually depopulated, and dust storms ravaged the land. More recently, the western US experienced widespread drought from 1999 to 2004.
In terms of deaths from heatwaves, 7,415 losses occurred from 1999 to 2010, a mean of 618 per year. A disproportionate amount of men, a full 68% of deaths, versus women have been affected. The highest yearly total of heat-related deaths in that period was 1999 while the lowest was 2004.[21] In terms of deaths from waves of cold temperatures, the same gender inequality exists (66% of hypothermia-related deaths in 2002 were of males). From 1979 2002, 16,555 deaths occurred due to exposure to excessive cold temperatures, a mean of 689 per year.[22]
See also
- Climate change in the United States
- Geography of the United States
- United States tropical cyclone rainfall climatology
- Meteorology
References
- ↑ Norman W. Junker. West Coast Cold Season Heavy Rainfall Events. Retrieved on 2008-03-01.
- ↑ Thomas W. Schmidlin. Climatic Summary of Snowfall and Snow Depth in the Ohio Snowbelt at Chardron. Retrieved on 2008-03-01.
- ↑ Martin A. Baxter, Charles E. Graves, and James T. Moore. A Climatology of Snow-to-Liquid Ratio for the Contiguous United States. Retrieved on 2008-03-21.
- ↑ John Monteverdi and Jan Null. WESTERN REGION TECHNICAL ATTACHMENT NO. 97-37 NOVEMBER 21, 1997: El Niño and California Precipitation. Retrieved on 2008-02-28.
- ↑ Nathan Mantua. La Niña Impacts in the Pacific Northwest. Retrieved on 2008-02-29.
- ↑ Southeast Climate Consortium. SECC Winter Climate Outlook. Retrieved on 2008-02-29.
- ↑ Reuters. La Nina could mean dry summer in Midwest and Plains. Retrieved on 2008-02-29.
- ↑ National Weather Service Forecast Office Flagstaff, Arizona. The Monsoon. Retrieved on 2008-02-28.
- ↑ Roth, David M; Weather Prediction Center (January 7, 2013). "Maximum Rainfall caused by Tropical Cyclones and their Remnants Per State (1950–2012)". Tropical Cyclone Point Maxima. United States National Oceanic and Atmospheric Administration's National Weather Service. Retrieved March 15, 2013.
- ↑ Walker S. Ashley, Thomas L. Mote, P. Grady Dixon, Sharon L. Trotter, Emily J. Powell, Joshua D. Durkee, and Andrew J. Grundstein. Distribution of Mesoscale Convective Complex Rainfall in the United States. Retrieved on 2008-03-02.
- ↑ Williams, Jack Each state's low temperature record, USA Today, URL accessed 13 June 2006.
- ↑ "World: Highest Temperature". World Weather / Climate Extremes Archive. Arizona State University. 2012. Archived from the original on January 4, 2013. Retrieved January 15, 2013.
- ↑ National Atlas. Average Annual Precipitation, 1961-1990. Retrieved on 2006-06-15.
- ↑ Diana Leone. Rain supreme. Retrieved on 2008-03-19.
- ↑ Hereford, Richard, et al., Precipitation History of the Mojave Desert Region, 1893–2001, US Geological Survey, Fact Sheet 117-03, URL accessed 13 June 2006.
- ↑ "USGS TNM 2.0 Viewer". Viewer.nationalmap.gov. Retrieved 2016-04-24.
- ↑ "CONTIGUOUS UNITED STATES Climate Summary".
- ↑ NOVA, Tornado Heaven, Hunt for the Supertwister, URL accessed 15 June 2006.
- ↑ Baird, Joel Banner (August 4, 2013). "Stream-gage insight at risk from budget cuts". The Burlington Free Press. Burlington, Vermont. pp. 3C.
- ↑ O'Connor, Jim E. and John E. Costa, Large Floods in the United States: Where They Happen and Why, US Geological Survey Circular 1245, URL accessed 13 June 2006.
- ↑ QuickStats: Number of Heat-Related Deaths,* by Sex — National Vital Statistics System, United States,† 1999–2010§. Cdc.gov (2012-09-14). Retrieved on 2013-07-29.
- ↑ Hypothermia-Related Deaths - United States, 2003-2004. Cdc.gov. Retrieved on 2013-07-29.