Harlow District Council election, 2010
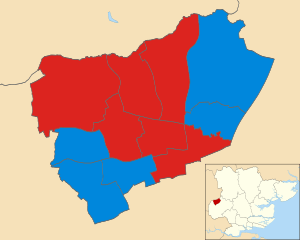
The 2010 Harlow District Council election took place on 6 May 2010 to elect members of Harlow District Council in Essex, England. One third of the council was up for election and the Conservative party stayed in overall control of the council.[1]
After the election, the composition of the council was
- Conservative 18
- Labour 10
- Liberal Democrats 5[2]
Background
The Conservative party gained a majority on the council at the last election in 2008 and after the election had 19 councillors, compared to 8 for the Liberal Democrats and 6 for Labour.[3][4] In April 2009 the Liberal Democrats gained a seat in Staple Tye after a by-election, which had previously been held by independent David Kirton, who had been elected as a Conservative but suspended from the party in October 2008.[5][6] However, in September 2009 councillor Linda Pailing of Netteswell ward left the Liberal Democrats to become an independent and then would go on to join the Conservatives in January 2010.[7]
Election result
At the same time as the Conservative party gained the Harlow parliamentary constituency from Labour at the 2010 general election, the party also held control of Harlow council.[8] However Labour made gains to win 6 of the 11 seats contested, while the Liberal Democrats lost the seats of Bush Fair, Mark Hall and Staple Tye.[8]
| Harlow local election result 2010[2][9] | ||||||||||
|---|---|---|---|---|---|---|---|---|---|---|
| Party | Seats | Gains | Losses | Net gain/loss | Seats % | Votes % | Votes | +/− | ||
| Labour | 6 | 4 | 0 | +4 | 54.5 | 36.3 | 13,815 | +8.9% | ||
| Conservative | 5 | 1 | 2 | -1 | 45.5 | 41.6 | 15,837 | -9.3% | ||
| Liberal Democrat | 0 | 0 | 3 | -3 | 0 | 21.5 | 8,194 | +0.7% | ||
| Independent | 0 | 0 | 0 | 0 | 0 | 0.5 | 186 | +0.2% | ||
Ward results
| Party | Candidate | Votes | % | ± | |
|---|---|---|---|---|---|
| Labour | Helen Hart | 1,254 | 36.4 | +4.8 | |
| Liberal Democrat | Paulette Alexander | 1,134 | 33.0 | -8.6 | |
| Conservative | Daniel Lucia | 1,053 | 30.6 | +3.8 | |
| Majority | 120 | 3.5 | |||
| Turnout | 3,441 | 61.7 | +25.5 | ||
| Labour gain from Liberal Democrat | Swing | ||||
| Party | Candidate | Votes | % | ± | |
|---|---|---|---|---|---|
| Conservative | Tony Hall | 2,718 | 62.9 | -13.5 | |
| Labour | Kenneth Lawrie | 1,004 | 23.2 | +8.7 | |
| Liberal Democrat | Shinjita Basu | 600 | 13.9 | +4.7 | |
| Majority | 1,714 | 39.7 | -22.2 | ||
| Turnout | 4,322 | 67.6 | +39.3 | ||
| Conservative hold | Swing | ||||
| Party | Candidate | Votes | % | ± | |
|---|---|---|---|---|---|
| Conservative | Joshua Jolles | 1,688 | 47.7 | -16.1 | |
| Labour | Norman Knight | 1,276 | 36.1 | +9.9 | |
| Liberal Democrat | Pauline Bell | 573 | 16.2 | +6.2 | |
| Majority | 412 | 11.6 | -26.0 | ||
| Turnout | 3,537 | 68.2 | +33.0 | ||
| Conservative hold | Swing | ||||
| Party | Candidate | Votes | % | ± | |
|---|---|---|---|---|---|
| Labour | Maggie Hulcoop | 1,448 | 40.1 | +9.6 | |
| Conservative | John Steer | 1,398 | 38.7 | -7.9 | |
| Liberal Democrat | Laura Rideout | 578 | 16.0 | -4.3 | |
| Independent | Gary Roberts | 186 | 5.2 | +2.6 | |
| Majority | 50 | 1.4 | |||
| Turnout | 3,610 | 65.5 | +28.3 | ||
| Labour hold | Swing | ||||
| Party | Candidate | Votes | % | ± | |
|---|---|---|---|---|---|
| Labour | Tony Durcan | 1,635 | 46.5 | +4.9 | |
| Conservative | Linda Pailing | 1,267 | 36.0 | -12.8 | |
| Liberal Democrat | Kuzna Jackson | 613 | 17.4 | +7.8 | |
| Majority | 368 | 10.5 | |||
| Turnout | 3,515 | 61.2 | +29.5 | ||
| Labour hold | Swing | ||||
| Party | Candidate | Votes | % | ± | |
|---|---|---|---|---|---|
| Labour | Paul Sztumpf | 1,145 | 35.6 | +6.0 | |
| Liberal Democrat | Robert Thurston | 1,114 | 34.6 | -2.2 | |
| Conservative | Conrad Nowikow | 961 | 29.8 | -3.8 | |
| Majority | 31 | 1.0 | |||
| Turnout | 3,220 | 63.4 | +23.5 | ||
| Labour gain from Liberal Democrat | Swing | ||||
| Party | Candidate | Votes | % | ± | |
|---|---|---|---|---|---|
| Labour | Michael Danvers | 1,329 | 41.1 | +12.9 | |
| Conservative | Daniel Margetson | 1,042 | 32.3 | -3.3 | |
| Liberal Democrat | James Rideout | 860 | 26.6 | -3.6 | |
| Majority | 287 | 8.9 | |||
| Turnout | 3,231 | 59.0 | +23.3 | ||
| Labour gain from Conservative | Swing | ||||
| Party | Candidate | Votes | % | ± | |
|---|---|---|---|---|---|
| Conservative | Michael Garnett | 1,855 | 51.8 | -13.6 | |
| Labour | Charles Cochrane | 1,139 | 31.8 | +10.2 | |
| Liberal Democrat | Simon MacNeill | 584 | 16.3 | +3.3 | |
| Majority | 716 | 20.0 | -23.8 | ||
| Turnout | 3,578 | 68.8 | +34.9 | ||
| Conservative hold | Swing | ||||
| Party | Candidate | Votes | % | ± | |
|---|---|---|---|---|---|
| Conservative | Guy Mitchinson | 1,083 | 36.7 | -13.9 | |
| Labour | Dennis Palmer | 1,021 | 34.6 | +18.4 | |
| Liberal Democrat | Sally Sambridge | 848 | 28.7 | -4.5 | |
| Majority | 62 | 2.1 | -15.3 | ||
| Turnout | 2,952 | 57.8 | +25.5 | ||
| Conservative gain from Liberal Democrat | Swing | ||||
| Party | Candidate | Votes | % | ± | |
|---|---|---|---|---|---|
| Conservative | Nicholas Churchill | 1,506 | 45.6 | -19.7 | |
| Labour | Paul Schroder | 1,107 | 33.5 | +9.3 | |
| Liberal Democrat | Sue Woodlands | 688 | 20.8 | +10.3 | |
| Majority | 399 | 12.1 | -29.0 | ||
| Turnout | 3,301 | 60.8 | +30.0 | ||
| Conservative hold | Swing | ||||
| Party | Candidate | Votes | % | ± | |
|---|---|---|---|---|---|
| Labour | Rod Truan | 1,457 | 43.8 | +8.7 | |
| Conservative | David Carter | 1,266 | 38.1 | -17.9 | |
| Liberal Democrat | Christopher Robins | 602 | 18.1 | +9.2 | |
| Majority | 191 | 5.7 | |||
| Turnout | 3,325 | 61.8 | +25.4 | ||
| Labour gain from Conservative | Swing | ||||
References
- ↑ "Harlow". BBC News Online. 7 May 2010. Retrieved 2 January 2015.
- 1 2 "Local elections 2010". The Guardian. 7 May 2010. Retrieved 3 January 2015.
- ↑ "Harlow". BBC News Online. 2 May 2008. Retrieved 3 January 2015.
- ↑ "Harlow Common Ward Election Result". Harlow District Council. Archived from the original on 18 February 2012. Retrieved 3 January 2015.
- ↑ "Update: Tory party suspends councillor". Harlow Herald. 14 October 2008. Retrieved 3 January 2015.
- ↑ "Harlow: Lib Dems narrowly beat Conservatives in Staple Tye by-election". Harlow Herald. 1 May 2009. Retrieved 3 January 2015.
- ↑ Moss, Chris (29 January 2010). "Former Lib Dem councillor joins Conservatives". Harlow Star. Retrieved 3 January 2015.
- 1 2 Moss, Chris (2 May 2011). "Candidates prepare to lock horns in local elections". Harlow star. Retrieved 3 January 2015.
- 1 2 3 4 5 6 7 8 9 10 11 12 "Harlow Council Elections 2010 Results". Harlow District Council. Archived from the original on 20 May 2010. Retrieved 2 January 2015.