Group size measures
_at_Sultanpur_I_Picture_076.jpg)
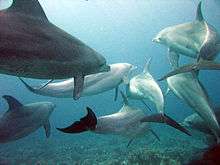
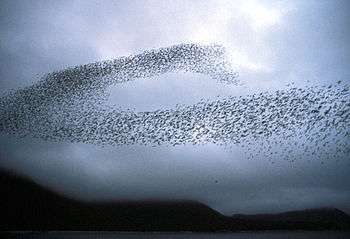
Many animals, including humans, tend to live in groups, herds, flocks, bands, packs, shoals, or colonies (hereafter: groups) of conspecific individuals. The size of these groups, as expressed by the number of participant individuals, is an important aspect of their social environment. Group size tend to be highly variable even within the same species, thus we often need statistical measures to quantify group size and statistical tests to compare these measures between two or more samples. Group size measures are notoriously hard to handle statistically since groups sizes typically follow an aggregated (right-skewed) distribution: most groups are small, few are large, and a very few are very large.
Statistical measures of group size roughly fall into two categories.
Outsiders' view of group size
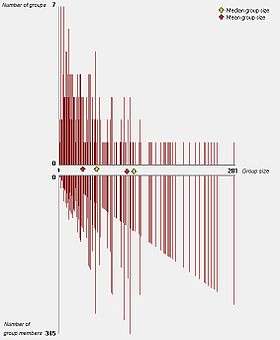
- Group size is the number of individuals within a group;
- Mean group size , the arithmetic mean of group sizes averaged over groups;
- Confidence interval for mean group size;
- Median group size, the median of group sizes calculated over groups;
- Confidence interval for median group size.
Insiders' view of group size
As Jarman (1974) pointed out, average individuals live in groups larger than average. Therefore, when we wish to characterize a typical (average) individual’s social environment, we should apply non-parametric estimations of group size. Reiczigel et al. (2008) proposed the following measures:
- Crowding is the size (the number of individuals) of a group that a particular individual lives in (equals to group size: 1 for a solitary individual, 2 for both individuals in a group of 2, etc.). Practically, it describes the social environment of one particular individual. This was called Individual Group Size in Jovani & Mavor's (2011) paper.;
- Mean crowding, i.e. the arithmetic mean of crowding measures averaged over individuals (this was called "Typical Group Size" according to Jarman's 1974 terminology);
- Confidence interval for mean crowding.
Example
Imagine a sample with 3 groups, where group sizes are 1, 2, and 6 individuals, respectively, then
- mean group size (group sizes averaged over groups) equals ;
- mean crowding (group sizes averaged over individuals) equals .


Generally speaking, given there are G groups with sizes n1, n2, ..., nG, mean crowding can be calculated as:
- mean crowding=

Statistical methods
Due to the aggregated (right-skewed) distribution of group members among groups, the application of parametric statistics would be misleading. Another problem arises when analyzing crowding values. Crowding data consist of non-independent values, or ties, which show multiple and simultaneous changes due to a single biological event. (Say, all group members' crowding values change simultaneously whenever an individual joins or leaves.)
Reiczigel et al. (2008) discuss the statistical problems associated with group size measures (calculating confidence intervals, 2-sample tests, etc.) and offer a free statistical toolset (Flocker 1.1).
Literature
- Debout G 2003. Le corbeau freux (Corvus frugilegus) nicheur en Normandie: recensement 1999 & 2000. Cormoran, 13, 115–121.
- Jarman PJ 1974. The social organisation of antelope in relation to their ecology. Behaviour, 48, 215–268.
- Jovani R, Mavor R 2011. Group size versus individual group size frequency distributions: a nontrivial distinction. Animal Behaviour, 82, 1027–1036.
- Lengyel S, Tar J, Rozsa L 2012. Flock size measures of migrating Lesser White-fronted Geese Anser erythropus Acta Zoologica Academiae Scientiarum Hungaricae, 58, 297–303. (2012)
- Reiczigel J, Lang Z, Rózsa L, Tóthmérész B 2008. Measures of sociality: two different views of group size. Animal Behaviour, 75, 715–721.
- Reiczigel J, Mejía Salazar MF, Bollinger TK, Rozsa L 2015. Comparing radio-tracking and visual detection methods to quantify group size measures. European Journal of Ecology, 1(2), 1–4.
See also
Size of groups, organizations, and communities
External links
Gallery
-
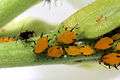
An aphid colony
-
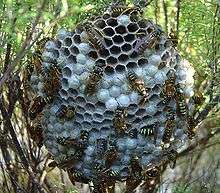
European paper wasp colony
-
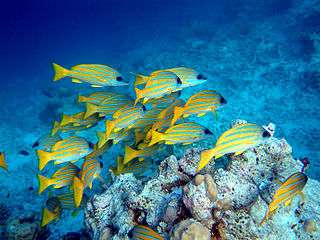
Bluestripe snapper schooling.
-
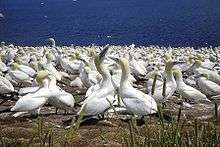
Gannet colony
-
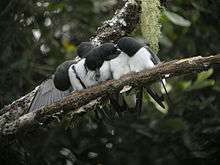
Great woodswallows allopreening.
-
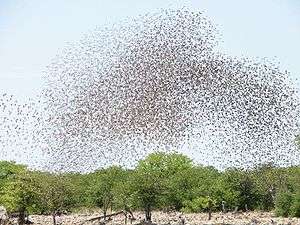
Red-billed quelea flock
-
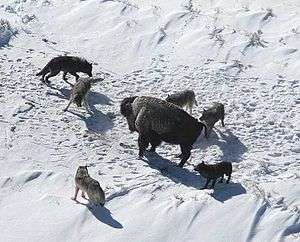
Wolf pack hunting
-
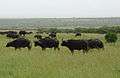
African buffalo herd
-
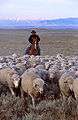
Sheep flock