Head and shoulders (chart pattern)
On the technical analysis chart, the Head and shoulders formation occurs when a market trend is in the process of reversal either from a bullish or bearish trend; a characteristic pattern takes shape and is recognized as reversal formation.
Head and shoulders top
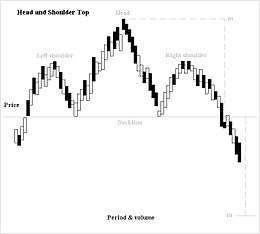
Head and Shoulders formation consists of a left shoulder, a head, and a right shoulder and a line drawn as the neckline. The left shoulder is formed at the end of an extensive move during which volume is noticeably high. After the peak of the left shoulder is formed, there is a subsequent reaction and prices slide down to a certain extent which generally occurs on low volume. The prices rally up to form the head with normal or heavy volume and subsequent reaction downward is accompanied with lesser volume. The right shoulder is formed when prices move up again but remain below the central peak called the Head and fall down nearly equal to the first valley between the left shoulder and the head or at least below the peak of the left shoulder. Volume is lesser in the right shoulder formation compared to the left shoulder and the head formation. A neckline is drawn across the bottoms of the left shoulder, the head and the right shoulder. When prices break through this neckline and keep on falling after forming the right shoulder, it is the ultimate confirmation of the completion of the Head and Shoulders Top formation. It is quite possible that prices pull back to touch the neckline before continuing their declining trend.[1]
Head and shoulders bottom
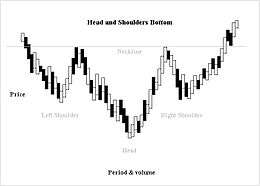
This formation is simply the inverse of a Head and Shoulders Top and often indicates a change in the trend and the sentiment.[2] The formation is upside down in which volume pattern is different from a Head and Shoulder Top. Prices move up from first low with increase volume up to a level to complete the left shoulder formation and then falls down to a new low. It follows by a recovery move that is marked by somewhat more volume than seen before to complete the head formation. A corrective reaction on low volume occurs to start formation of the right shoulder and then a sharp move up that must be on quite heavy volume breaks though the neckline.
Another difference between the Head and Shoulders Top and Bottom is that the Top Formations are completed in a few weeks, whereas a Major Bottom (Left, right shoulder or the head) usually takes a longer, and as observed, may prolong for a period of several months or sometimes more than a year.
Importance of neckline
The drawn neckline of the pattern represents a support level, and assumption cannot be taken that the Head and Shoulder formation is completed unless it is broken and such breakthrough may happen to be on more volume or may not be. The breakthrough should not be observed carelessly. A serious situation can occur if such a break is more than three to four percent.
When a stock drifts through the neckline on small volume, there may be a wave up, although it is not certain, but it is observed, the rally normally does not cross the general level of the Neckline and before selling pressure increases, the steep decline occurs and prices tumble with greater volume.
Characteristics
- Most of the time Head and Shoulders are not perfectly shaped due the dandruff collection and lack of shampooing. This formation is slightly tilted upward or downward.
- One shoulder may appear to droop.
- On many chart patterns, any one of the two shoulders may appear broader than the other which is caused by the time involved in the formation of the valleys.
- The neckline may not be perfectly horizontal; it may be ascending or descending.
- If the neckline is ascending then the only qualification of the formation lies in the fact that the lowest point of the right shoulder must be noticeably lower than the peak of the left shoulder.
Usage as a tool
Head and Shoulders is an extremely useful tool after its confirmation to estimate and measure the minimum probable extent of the subsequent move from the neckline. To find the distance of subsequent move, measure the vertical distance from the peak of the head to the neckline. Then measure this same distance down from the neckline beginning at the point where prices penetrate the neckline after the completion of the right shoulder. This gives the minimum objective of how far prices can decline after the completion of this top formation.
If the price advance preceding the Head and Shoulders top is not long, the subsequent price fall after its completion may be small as well.
Complex head and shoulders
This type of Head and Shoulders pattern has more than one left and/or right shoulders and/or head. It is also known as Multiple Head and Shoulders pattern.
References
- ↑ "Head and Shoulders Stock Chart Pattern". Investors Underground. Retrieved 1 July 2016.
- ↑ "Head and Shoulders Bottom (Reversal)". Stock Charts. Retrieved 1 July 2016.
External links
- Analyzing Chart Patterns: Head And Shoulders at investopedia.com